Abstract
This study aimed to identify genetic biomarkers in pancreatic cancer (PC) and explore its function in PC via a feature-base analysis of bioinformatics. OMIM and DisGeNET databases discovered 209 PC connected genes and then 516 connected genes were identified. We selected 29 genes according to optimal features and chose COL1A2, which had the highest expression, for the following experiment. The expression of COL1A2 was determined by qRT-PCR; cell proliferation was determined by MTT assay; migration and invasion after COL1A2 and miR-25-3p transfection was evaluated by Transwell assay. COL1A2 presented the highest expression in PC tissues, which was validated in functional experiments. MiR-25-3p suppressed the expression of COL1A2 in cell lines and inhibited migration, invasion and proliferation of PC cells. MiR-25-3p could suppress the expression of COL1A2 and inhibit the proliferation, migration and invasion of PC cells which provided a new idea for the detection and treatment of PC.
Keywords: Pancreatic cancer, COL1A2, MiR-25-3p, bioinformatics
Introduction
Pancreatic cancer (PC) is one of the most common malignancies in the world, with high mortality rates1,2. In recent years, the incidence of PC has gradually increased, and its 5-year relative survival rate is only 5%2,3, which leads to an urgent demand for new horizons. The occurrence of PC is usually associated with a variety of factors, such as genetic factors, environmental factors and living habits. Moreover, PC cells are characterised by tumour infiltration and susceptibility to systemic diffusion4, which makes molecular biology study insufficient. Thus, more investigations for the mechanism of PC tumorigenesis are warranted.
Gene ontology (GO) could be classified according to its molecular function, biological pathways and cell localisation. Through the analysis of GO enrichment, it is beneficial to overall grasp the function of differentially expressed genes in specific diseases5. Kyoto Encyclopedia of Genes and Genomes (KEGG) is a database based on the known molecular interaction network, which helps to observe the biological pathways and functional characteristics of mutant genes through the enrichment score of mapping network6. In the process of tumorigenesis, it is often accompanied by the abnormal expression or variation of genes, which lead to turbulence in signalling pathways, as well as complex regulatory networks. Therefore, GO and KEGG analyses were adopted for the encoding genes, which was conducive to regulatory network speculation and the feature genes prediction7.
In this study, a systematic biological method was used to collect PC-related genes recorded in the disease-gene relevance databases, then GO and KEGG were adopted for PC-related genes and non-related genes. Classification and optimal feature extraction by machine learning were used to identify GO and KEGG pathway features for predicting PC-related genes, which helped us identify PC-related gene COL1A2 that encodes type I collagen at the autosomal 7q22.1 locus with a total length of 38 kb and 52 exons8. Nowadays, putative mutant genes in PC reported including KRAS, CDKN2A, TP53 and SMAD49. At present, it is reported that COL1A2 involves in the regulation of osteogenesis imperfecta (OI)10, Ehlers-Danlos syndrome11, osteoarthritis12 and so on. Furthermore, some researchers reported that COL1A2 might directly play a role in pancreatic cancer proliferation, migration, invasion and in vivo xenograft progression, through its interaction with microRNA (miRNA)13–15.
MiRNA, a kind of single-stranded noncoding RNA, has been widely investigated in cancer researches due to its wide range of target genes regulation16. Particularly, it plays a key role in the proliferation and migration of cancer cells and is commonly used as a potential target for cancer therapy17. It has been reported that miR-25–3p was highly expressed in colon cancer, gastric cancer, prostate cancer and ovarian cancer, and involved in cell proliferation, apoptosis and migration16,18–22. However, the association between miR-25–3p and COL1A2 as well as their roles in PC has not been clearly elucidated.
Here, the features of PC-related genes were analysed and new genetic biomarkers were predicted by machine learning. Our study explored the role of COL1A2 in PC cells and the association between COL1A2 and miR-25–3p in vitro. The findings may shed light on the diagnosis and treatment of PC.
Materials and methods
Selection of optimal features and prediction of PC-related genes
The features of PC-related genes were defined based on Online Mendelian Inheritance in Man (OMIM) and DisGeNET databases, then each gene was ranked according to the enrichment score of GO and involved KEGG pathways. The higher the score was, the more reliable the function definition would be. Optimal features of PC-related genes screening and gene prediction were conducted based on the machine learning methods of minimum redundancy maximum relevance (mRMR), incremental feature selection (IFS) and Random Forest algorithm (RFA)23. Specifically, the screening features were sorted using mRMR based on two criteria: Max-Relevance (MaxRel) and Min-Redundancy (mRed). In the process of IFS, we added features according to the order of the mRMR list. After adding a new feature, a new sub-data set of positive and negative samples would be built accordingly. Then each sub-data set was examined and evaluated to confirm the optimal one, which contained the optimal feature. Classification analysis of RFA was performed by Weka 3.6.4 software8, using default parameter and being estimated by Ten-fold cross validation. The test performance evaluation was assessed by Matthews’s correlation coefficient (MCC) to obtain a sub-data set with maximum MCC value, which contained the optimal feature set. Based on that, all human genes could be classified by RFA. For each gene, it would be divided into related and non-related genomes.
Gene expression microarray validation
Predicted PC-related genes were validated via two datasets (GSE15471 and GSE28735) from the Gene Expression Omnibus (GEO) database (https://www.ncbi.nlm.nih.gov/geo/). In GSE15471, 36 pairs of normal and tumour tissue samples were obtained at the time of surgery from resected pancreas of 36 pancreatic cancer patients. Gene expression was analysed on Affymetrix U133 plus 2.0 whole genome microarrays. The microarray data were subsequently normalised using the Robust Multi-array Average (RMA) algorithm. In GSE28735, the profile compared the microarray gene-expression profiles of 45 matching pairs of pancreatic tumour and adjacent non-tumour tissues with the platform of Affymetrix Human Gene 1.0 ST Array. Analysis of gene differential expression was used by R package of Limma following by the filtration criteria were: Log2 (Fold Change) > 2 and p < .05.
Clinical samples
Fifteen PC patients were selected for clinical participants. The tumours were graded in line with the criteria of the World Health Organization (WHO, 2008). Fifteen pairs of tumour tissues with matched adjacent normal tissues were obtained. All experiments were approved by the Ethics Committee of Second Affiliated Hospital of Dalian Medical University, and informed consents were obtained from all the participating patients. All the tissues were stored in liquid nitrogen at –80 °C for the following experiments.
Cell lines
Human PC cell lines PANC-1, CAPAN-1, SW1990, JF305 and benign cell line HPC-Y5 were purchased from American Type Culture Collection (ATCC, Manassas, VA). HPC-Y5 cells were selected as controls. Each cell line was inoculated into Dulbecco’s modified Eagle’s medium (DMEM; Sigma-Aldrich, St. Louis, MO) containing 10% foetal bovine serum (FBS; Sijiqing Biochemical, Hangzhou, China) at 37 °C in an incubator with 5% CO2.
Plasmid construction and transfection
Using siRNA to interfere with COL1A2 gene transcription, the siRNA for specifically knocking down COL1A2 was transferred into shRNA which was inserted into pSilencer2.1-U6 neo vectors (Ambion, Austin, TX) at the BamHI and HindIII cleavage sites. The pcDNA 3.1-neo vector (Thermo Fisher Scientific, Waltham, MA) were used to constructed COL1A2 overexpression vector with sites of HindIII and EcoRV. MiR-25–3p (5′-CAU UGC ACU UGU CUC GGU CUG A-3′) mimics and inhibitor were commercially synthesised by Thermo Fisher Scientific. Lipofectamine 2000 reagent (Invitrogen Inc, Carlsbad, CA) was adopted for plasmid transfection in accordance with the manufacturer’s instructions.
Quantitative RT-PCR
Total RNA was extracted from PC cells in strict accordance with the instruction of TRIzol Reagent Kit (Invitrogen, Carlsbad, CA). Total RNA (5 µg) was reverse-transcribed into cDNA using specific primer M-MLV reverse transcriptase (Promega Corp, Madison, WI). Taking cDNA as template, PCR amplification was carried out by qRT-PCR for quantitative determination. The PCR procedure was set as follows: 94 °C for 3 min, followed by 40 cycles of 94 °C for 30 s, 50 °C for 30 s and 72 °C for 30 s. The formula for calculating gene expression is 2–ΔΔCt. The gene expression levels were relative to the untreated cells. U6 snRNA or GAPDH mRNA was served as control for miRNA or mRNA respectively.
RNA pull-down assay
Biotinylated miR-25–3p pull-down assay was performed. The pancreatic cancer cells were transfected with biotinylated miR-25–3p or the NC and were harvested after 48 h transfection. The cells were washed with PBS and incubated in a lysis buffer (20 mM Tris, pH 7.5, 200 mM NaCl, 2.5 mM MgCl2, 0.05% Igepal, 60 U Superase-In/ml (Ambion), 1 mM DTT, protease inhibitors (Roche) on ice for 10 min. Fifty microlitre of the sample was aliquoted for input. Simultaneously, Streptavidin-Dyna beads (Invitrogen, CA) incubated with remaining lysates. The beads were incubated at 4 °C for 3 h, there times with the low salt buffer (0.1% SDS, 1% Triton X-100, 2 mM EDTA, 20 mM Tris-HCl pH8.0 and 150 mM NaCl) and once with the high salt buffer (0.1% SDS, 1% Triton X-100, 2 mM EDTA, 20 mM Tris-HCl pH 8.0 and 500 mM NaCl). The bound RNA was then precipitated using Trizol and then applied in the q-RT-PCR analysis for COL1A2 mRNA enrichment.
MTT assay
MTT was performed to detect cell proliferation. PC cells were seeded into 96-well and cultured for 12 h before transfection. After transfection with 24 h, 48 h, 72 h and 96 h, the plates were taken out at the corresponding time point with each well added 20 µl MTT (5 mg/ml) and incubated for an additional 4 h. After the clear liquid was carefully aspirated, 200 µl dimethyl sulfoxide (DMSO) was added to each well, incubated at 37 °C for 10 min or oscillated for 10 min until the blue-violet crystals were completely dissolved. The absorbance of each well was measured at 570 nm via a microplate reader (Bio-Tek Instruments, Winooski, VT) and then the cell growth curve was drawn.
Transwell assay
Transwell chamber (Corning Costar, NY) was used to perform migrative or invasive assay. Cells of 1 × 10⁵ were seeded into the upper chambers with serum-free. The lower chambers were added with DMEM containing 10% FBS. After being incubated at 37 °C in a 5% CO2 incubator for 24 h transfection, the cells were fixed 15 min with methanol, stained 15 min with 0.05% crystal violet in PBS and counted under a microscope (Olympus, Tokyo, Japan). After migration or invasion, cells in upper chamber were wiped with cotton swabs carefully and fixed with PBS containing 4% formaldehyde and subsequently immersed in a 2% ethanol solution containing 1% crystal violet. An optical microscope (100×) was used to observe and take photographs for cells. For invasion detection, Matrigel (BD Biosciences, Franklin Lakes, NJ) was added to the upper chamber of Transwell.
Statistical analysis
Statistical analysis was done by GraphPad Prism 6.0 (GraphPad, La Jolla, MA). The measurement data were represented as mean ± standard deviation (SD). Student’s t test was applied for two-group comparison, while one-way analysis of variance (ANOVA) was adopted for the comparison of multi-groups. p < .05 was expressed when the mean difference was statistically significant.
Results
Optimal features of PC-related genes and gene prediction
According to Online Mendelian Inheritance in Man (OMIM) database, 200 genes were found to be connected with PC. We also identified 12 PC-related genes in DisGeNET database. Excluding repeating ones, a total of 209 genes were selected for further investigation as shown in Supplementary Table S1.
All these 209 genes were taken as a positive sample group and the genes randomly selected from other human genes were used as a negative sample group. The latter was divided into 10 parts to keep the balance of gene numbers in positive samples and negative samples. Subsequently, 10 positive and negative sample datasets named dataset 1 to dataset 10 were constructed in the way of combining 10 negative samples with positive samples. For each dataset, the correlation of each feature with positive and negative samples was calculated. The features with a correlation below 0.1 were removed, and the rest were retained for the next round of optimal feature screening and optimal feature selection. The number of residual features, the corresponding optimal features and the accuracy of machine learning as well as MCC value in each dataset was shown in Table 1.
Table 1.
Performance of prediction based on the screened optimal features.
| Dataset | Residual features number | Optimal feature number | Sensitivity | Specificity | Accuracy | MCC |
|---|---|---|---|---|---|---|
| 1 | 3924 | 1121 | 0.94 | 0.9 | 0.92 | 0.84 |
| 2 | 3299 | 455 | 0.97 | 0.82 | 0.91 | 0.81 |
| 3 | 3427 | 1679 | 0.94 | 0.93 | 0.93 | 0.86 |
| 4 | 3644 | 1196 | 0.90 | 1.00 | 0.94 | 0.88 |
| 5 | 3768 | 219 | 0.97 | 0.71 | 0.87 | 0.73 |
| 6 | 3948 | 602 | 0.90 | 0.90 | 0.90 | 0.8 |
| 7 | 4009 | 386 | 0.87 | 0.9 | 0.88 | 0.77 |
| 8 | 4506 | 1313 | 0.94 | 0.94 | 0.94 | 0.86 |
| 9 | 4210 | 376 | 0.97 | 0.71 | 0.87 | 0.73 |
| 10 | 4828 | 670 | 1.oo | 0.71 | 0.95 | 0.82 |
MCC: Matthews’s correlation coefficient.
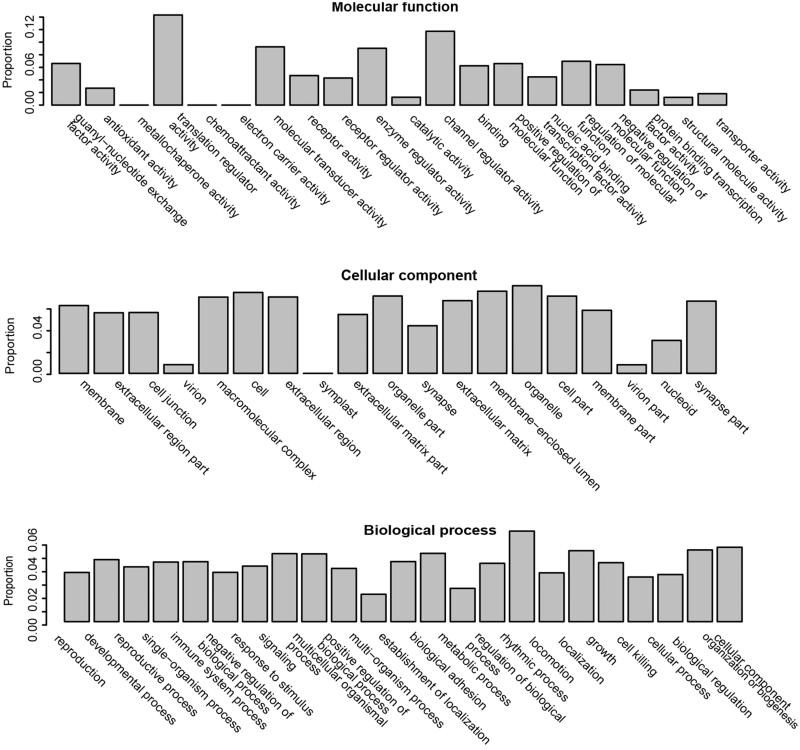
The features that appeared in the optimal features of at least 6 datasets were selected as the overall optimal features, which were enriched 2175 GO terms and 79 KEGG pathways (Supplementary Table S2). The results of GO enrichment were presented in three categories, including biological processes, cellular components and molecular functions, as shown in Figure 1. According to the overall optimal features, PC-related genes were further predicted by RFA. Through the classification of RFA, 516 PC-related genes were finally predicted (Supplementary Table S3).
Figure 1.
Gene Ontology (GO) for optimal features of PC-related genes. GO enrichment were presented in three categories, including biological processes, cellular components and molecular functions.
Validation of predicted PC related genes in GEO datasets
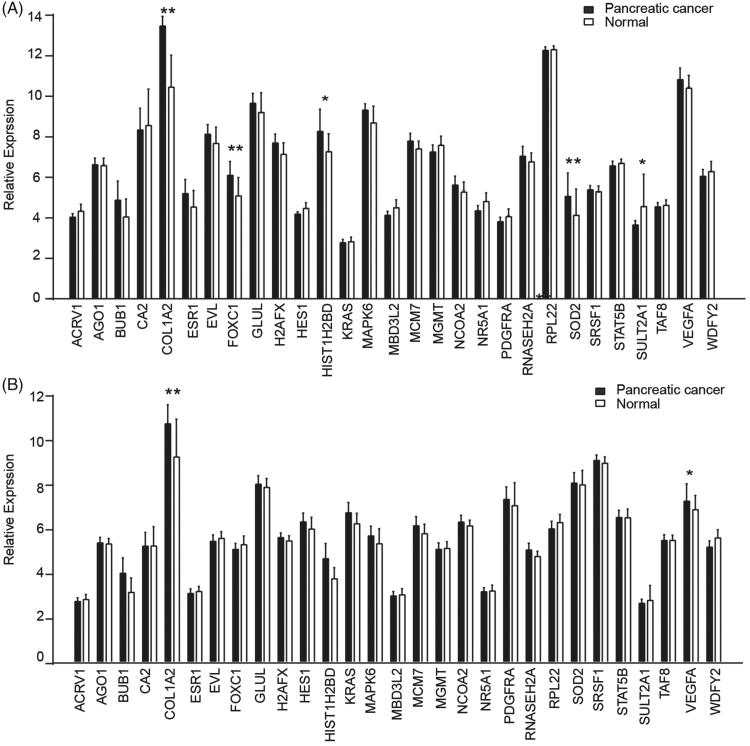
Two GEO microarray datasets (GSE15471 and GSE28735) were used to certify the associations of the 516 PC-related genes with PC. Using the 516 PC-related genes as features of PC, samples were classified by RFA, and then, the classification accuracy of this gene set was obtained for differentiating PC samples from normal controls. These PC-related genes were further optimised by feature selection method as mentioned above to obtain an optimised gene set with 29 genes, when the accuracy of classification would be 96%. As shown in Figure 2, COL1A2 presented consistently higher expression in two GEO datasets, compared with normal samples. Hence, the role of COL1A2 in PC was worthy to be further verified in vitro.
Figure 2.
Validation of predicted PC related genes in GEO datasets. COL1A2 presented a significantly high expression in PC tissues among 29 genes screened by machine learning in GSE15417 (A) and GSE28735 (B) datasets. *, p < .05; **, p < .01.
COL1A2 expression was elevated in PC tissues and cells
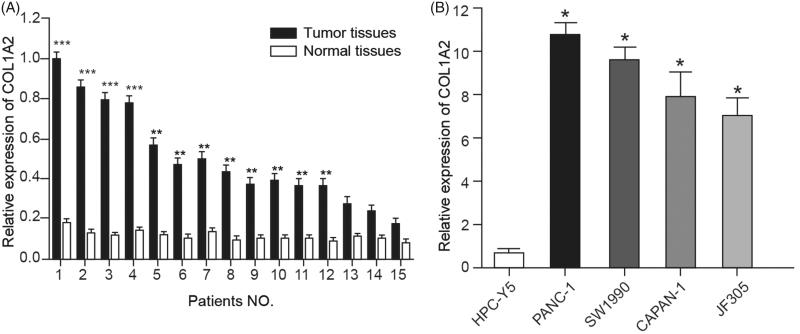
The expression of COL1A2 was verified in 15 pairs of PC tissues and normal adjacent tissues, which showed that COL1A2 was highly expressed in PC tissues (Figure 3(A)). In addition, high expression of COL1A2 was also confirmed in four PC cell lines compared with benign cell line HPC-Y5 (Figure 3(B)). Expression of COL1A2 in PANC-1 and SW1990 cell lines presented the highest level and they were selected for further experiments.
Figure 3.
COL1A2 expression was elevated in PC tissues and cells. (A) COL1A2 was highly expressed in PC tissues in 15 patients compared with normal adjacent tissues. (B) COL1A2 was highly expressed in four PC cell lines compared with benign cell line HPC-Y5. *, p < .05; **, p < .01; ***, p < .001.
Effect of COL1A2 inhibition on the proliferation, migration and invasion of PC cells
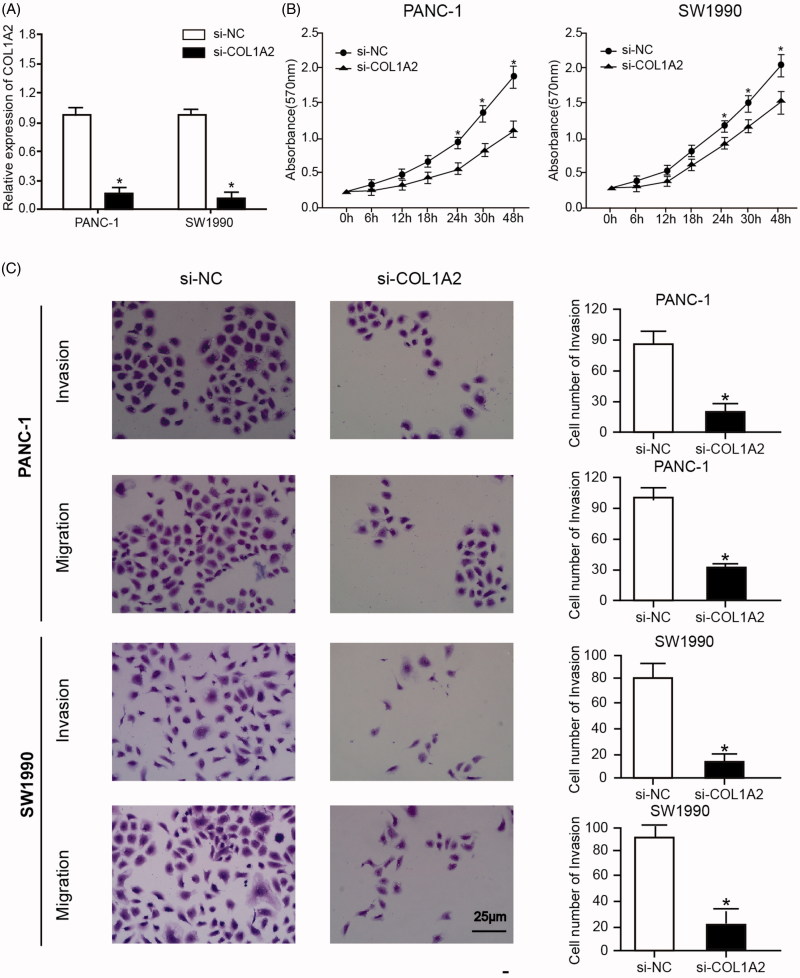
Plasmid si-COL1A2 was transfected into PANC-1 and SW1990 cell lines in order to study the mechanism of COL1A2 in PC. Taking si-NC as a control, the expression of COL1A2 mRNA was detected by qRT-PCR. The result manifested that the expression of COL1A2 mRNA in PANC-1 and SW1990 cell lines transfected with si-COL1A2 was significantly lower than that in si-NC group (Figure 4(A)). In addition, MTT assay verified that cell proliferation was significantly suppressed in si-COL1A2 group after 24 h (Figure 4(B)). At the same time, the invasion and migration of PANC-1 and SW1990 cells transfected with si-COL1A2 were analysed by Transwell (Figure 4(C)). In PANC-1 and SW1990 cells transfected with si-COL1A2, the number of migrated and invaded cells decreased significantly compared with the control group transfected with si-NC. The above results indicated that COL1A2 silencing could inhibit cell proliferation, migration and invasion of PC cells.
Figure 4.
COL1A2 silencing could inhibit cell proliferation, migration and invasion of PC cells. (A) Expression of COL1A2 mRNA in PANC-1 and SW1990 cell lines transfected with si-COL1A2 was significantly lower than that in the si-NC group. (B) MTT assay verified that cell proliferation was significantly suppressed in si-COL1A2 group after 24h. (C) Transwell assay indicated the number of migrated and invaded cells in PANC-1 and SW1990 cells transfected with si-COL1A2 decreased significantly compared with the control group transfected with si-NC. *, p < .05.
MiR-25–3p down-regulated COL1A2 expression
TargetScan identified miR-25–3p could directly bind to 3′UTR of COL1A2. In both PANC-1 and SW1990 cells lines, COL1A2 expression was regulated by miR-25–3p mimics and miR-25–3p inhibitor transfection (Figure 5(A,B)). The result demonstrated that miR-25–3p could down-regulated the expression of COL1A2, and they were negatively correlated. The relationship between COL1A2 and miR-25–3p was further confirmed by RNA pull-down assay. The result suggested that COL1A2 in PANC-1 and SW1990 cell lines could be significantly enriched by miR-25–3p (Figure 5(C)), which implied that that COL1A2 is the target gene for miR-25–3p.
Figure 5.
MiR-25–3p down-regulated COL1A2 expression. (A) MiR-25–3p mimics inhibited the expression of COL1A2. (B) MiR-25–3p inhibitor enhanced the expression of COL1A2. (C) RNA pull-down assay showed that COL1A2 was higher in the miR-25–3p probe group than in the NC group. *, p < .05.
Interaction between miR-25–3p and COL1A2 in PC cells
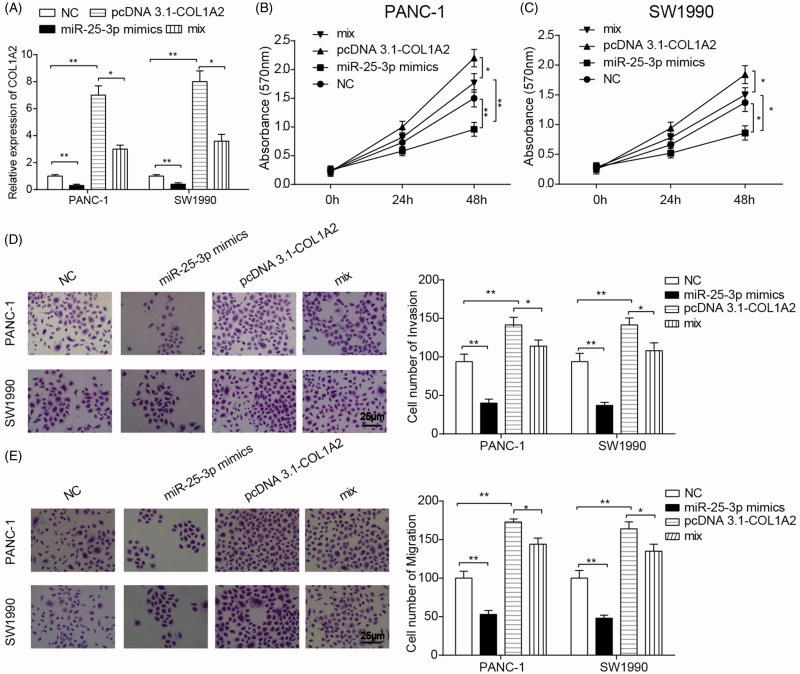
To further verify the interaction between COL1A2 and miR-25–3p in PC cells, PANC-1 and SW1990 cells were transfected with pcDNA 3.1-neo vectors (NC), pcDNA 3.1-COL1A2, miR-25–3p mimics and miR-25–3p mimics + pcDNA 3.1-COL1A2 (mix). The results of qRT-PCR showed that COL1A2 expression was elevated in pcDNA 3.1-COL1A2 group and COL1A2 expression reduced in miR-25–3p mimics group (Figure 6(A)). In addition, miR-25–3p mimics could reverse the effect of pcDNA 3.1-COL1A2 on COL1A2 expression. Similarly, proliferation of PANC-1 and SW1990 cells was promoted in pcDNA 3.1-COL1A2 group and suppressed in miR-25–3p mimics group (Figure 6(B,C)), with counterbalanced effect in mix group. At last, Transwell assay suggested inhibited migration and invasion in miR-25–3p mimics group and enhanced migration in pcDNA 3.1-COL1A2 group. The promoting effect on migration and invasion of PANC-1 and SW1990 cells by pcDNA 3.1-COL1A2 plasmid transfection was counteracted after the co-transfection of miR-25–3p mimics (Figure 6(D,E)).
Figure 6.
Interaction between miR-25–3p and COL1A2 in PC cells. (A) COL1A2 expression was detected by qRT-PCR in four groups, including PANC-1 and SW1990 cells were transfected with pcDNA 3.1-neo vectors (NC), pcDNA 3.1-COL1A2, miR-25–3p mimics and miR-25–3p mimics + pcDNA 3.1-COL1A2 (mix). (B-C) MTT assay was applied to detect the proliferation of PANC-1 and SW1990 cells in four groups. (D-E) Transwell assay was used for the detection of migration and invasion in PANC-1 and SW1990 cells. *p < .05 indicated significant differences compared with NC groups or mix groups. *, p < .05; **, p < .01.
Discussion
This study hypothesised COL1A2 as a significant regulator in PC after the combined selection of OMIM/DisGeNET databases, GO/KEGG analyses and machine learning model constructed by algorithm. Its suppressor role was validated in functional experiments by miR-25–3p overexpression, which resulted in inhibition in cell proliferation, migration and invasion.
Systematic biology is widely used to reveal the regulation mechanism of oncogene and the interaction of cancer proteins from a holistic perspective by multidisciplinary approach24. In this paper, based on the confirmed reports, GO and KEGG pathway were combined to investigate 2175 GO terms and 79 KEGG pathway that were highly associated with the development of PC. Machine learning model in bioinformatics might not only integrate information about PC genes from the collected large data but also show consistency between the predicted feature genes by algorithm and the reported cancer-related genes, which also supported the accuracy of bioinformatics in predicting oncogenes. This study may provide new ideas in future clinical research about PC development.
Among the screened optimal feature genes in PC, there were many known PC-related genes, and these predicted feature genes would coincide with many reported results. Many genes such as BUB1, FOXC1, STAT5B and VEGFA were found to be correlated to the development of PC, but the mechanism was not clear. For example, the predicted signal transducer and activator of transcription 5b (STAT5B) gene could significantly inhibit the growth, angiogenesis and metastasis of PC, which was thought to be a novel molecular target for PC25. Vascular Endothelial Growth Factor-A (VEGFA) has long been considered as an important factor in the growth and spread of PC26. Other genes such as budding uninhibited by Benomyl (BUB1) were important components of the spindle pole body. Hempen27 found that BUB1 in PC cells had double missense variation, which affected the development of its tumour cells. Moreover, the predicted Forkhead box C1 (FOXC1) gene is an important oncogene of basal-like breast cancer (BLBC)28. The role of some genes in PC such as COL1A2 in this paper has not been reported, but its role in the development of other cancers remains to be discovered.
Studies have found that PIK3CA, RAS (KRAS, NRAS) and BRAF gene mutations could activate PI3K/AKT/mTOR and RAS/RAF/MEK pathways, thereby enhancing the proliferation and migration of PC cells29. As target genes of miR-25–3p, these PC oncogenes play a significant role in the development of PC, which also indicate that miR-25–3p is of great importance in the early drive, proliferation and migration of PC and the effect may be caused by multiple target genes. Studies have found that miR-25–3p could suppress COL1A2 and influence the proliferation and migration of PC cells. Furthermore, the expression of COL1A2 gene was negatively associated with the transcription level of miR-25–3p, which was similar to the result that NEAT1 affected the growth and invasion of PC cells reported by Cao et al.3 Therefore, we assumed that the effect of COL1A2 on PC cells may be similar to that of NEAT1. That is, over-expressed genes antagonised the interaction with miR-25–3p, thereby reducing downstream PC oncogenes expression and further promoted the proliferation and migration of PC cells.
Limitations shall be attended in this study as well. COL1A2, a biomarker in blood, could affect cancer progression in multiple ways, which remains to be discovered in future researches. Besides, the underlying mechanism of COL1A2 and miR-25–3p co-function needs further investigation. Turbulence in cancer metastasis including epigenetic modifications, metabolic changes, locus mutations and micro-environment changes could be investigated in future studies.
In conclusion, machine learning as well as databases selected COL1A2 as a PC-related gene. COL1A2 was high expressed in cancer tissues. MiR-25–3p would suppress COL1A2 expression and inhibit the proliferation, migration and invasion, which provided ideas for mechanism studies and clinical trials.
Supplementary Material
Acknowledgements
We would like to acknowledge the helpful comments on this paper received from our reviewers.
Disclosure statement
The authors report no declarations of interest.
Data availability
The data that support the findings of this study are available from the corresponding author, LS, upon reasonable request.
Reference
- 1.He J, Ahuja N, Makary MA, et al. 2564 resected periampullary adenocarcinomas at a single institution: trends over three decades. HPB (Oxford) 2014;16:83–90. [DOI] [PMC free article] [PubMed] [Google Scholar]
- 2.Li Z, Li BQ, Jiang M, et al. Prediction and analysis of retinoblastoma related genes through gene ontology and KEGG. BioMed Res Int 2013;2013:305029. [DOI] [PMC free article] [PubMed] [Google Scholar]
- 3.Cao J, Zhang Y, Yang J, et al. NEAT1 regulates pancreatic cancer cell growth, invasion and migration though mircroRNA-335-5p/c-met axis. Am J Cancer Res 2016;6:2361–74. [PMC free article] [PubMed] [Google Scholar]
- 4.Li C, Heidt DG, Dalerba P, et al. Identification of pancreatic cancer stem cells. Cancer Res 2007;67:1030–7. [DOI] [PubMed] [Google Scholar]
- 5.Fan H, Guo Z, Wang C. Combinations of gene ontology and pathway characterize and predict prognosis genes for recurrence of gastric cancer after surgery. DNA Cell Biol 2015;34:579–87. [DOI] [PubMed] [Google Scholar]
- 6.Yang J, Chen L, Kong X, et al. Analysis of tumor suppressor genes based on gene ontology and the KEGG pathway. PLoS One 2014;9:e107202. [DOI] [PMC free article] [PubMed] [Google Scholar]
- 7.Xing Z, Chu C, Chen L, Kong X. The use of Gene Ontology terms and KEGG pathways for analysis and prediction of oncogenes. Biochim Biophys Acta 2016;1860:2725–34. [DOI] [PubMed] [Google Scholar]
- 8.Abdemami B, Shokrgozar MA, Shahreza HK, Ghavami M. Design and construction of two yeast shuttle vectors containing human procollagen genes expression cassette for expression in yeast. Avicenna J Med Biotechnol 2011;3:11–8. [PMC free article] [PubMed] [Google Scholar]
- 9.Hayashi H, Nishihara H [A Novel Treatment Strategy for Pancreatic Cancer Based on Gene Profiles]. Gan to Kagaku Ryoho 2016;43:1326–31. [PubMed] [Google Scholar]
- 10.Zhang H, Yue H, Wang C, et al. Clinical characteristics and the identification of novel mutations of COL1A1 and COL1A2 in 61 Chinese patients with osteogenesis imperfecta. Mol Med Rep 2016;14:4918–26. [DOI] [PubMed] [Google Scholar]
- 11.Hatamochi A, Hamada T, Yoshino M, Hashimoto T. The first Japanese case of the arthrochalasia type of Ehlers-Danlos syndrome with COL1A2 gene mutation. Gene 2014;538:199–203. [DOI] [PubMed] [Google Scholar]
- 12.Stellavato A, Tirino V, de Novellis F, et al. Biotechnological chondroitin a novel glycosamminoglycan with remarkable biological function on human primary chondrocytes. J Cell Biochem 2016;117:2158–69. [DOI] [PMC free article] [PubMed] [Google Scholar]
- 13.Shintani Y, Hollingsworth MA, Wheelock MJ, Johnson KR. Collagen I promotes metastasis in pancreatic cancer by activating c-Jun NH(2)-terminal kinase 1 and up-regulating N-cadherin expression. Cancer Res 2006;66:11745–53. [DOI] [PubMed] [Google Scholar]
- 14.Armstrong T, Packham G, Murphy LB, et al. Type I collagen promotes the malignant phenotype of pancreatic ductal adenocarcinoma. Clin Cancer Res 2004;10:7427–37. [DOI] [PubMed] [Google Scholar]
- 15.Lohr M, Trautmann B, Gottler M, et al. Human ductal adenocarcinomas of the pancreas express extracellular matrix proteins. Br J Cancer 1994;69:144–51. [DOI] [PMC free article] [PubMed] [Google Scholar]
- 16.Xu JY, Yang LL, Ma C, et al. MiR-25-3p attenuates the proliferation of tongue squamous cell carcinoma cell line Tca8113. Asian Pac J Trop Med 2013;6:743–7. [DOI] [PubMed] [Google Scholar]
- 17.Li HL, Xie SP, Yang YL, et al. Clinical significance of upregulation of mir-196a-5p in gastric cancer and enriched KEGG pathway analysis of target genes. Asian Pac J Cancer Prev 2015;16:1781–7. [DOI] [PubMed] [Google Scholar]
- 18.Li Q, Zou C, Zou C, et al. MicroRNA-25 functions as a potential tumor suppressor in colon cancer by targeting Smad7. Cancer Lett 2013;335:168–74. [DOI] [PubMed] [Google Scholar]
- 19.Su ZX, Zhao J, Rong ZH, et al. Upregulation of microRNA-25 associates with prognosis in hepatocellular carcinoma. Diag Pathol 2014;9:47. [DOI] [PMC free article] [PubMed] [Google Scholar]
- 20.Wang X, Meng X, Li H, et al. MicroRNA-25 expression level is an independent prognostic factor in epithelial ovarian cancer. Clin Transl Oncol 2014;16:954–8. [DOI] [PubMed] [Google Scholar]
- 21.Jin Y, Yu D, Tolleson WH, et al. MicroRNA hsa-miR-25-3p suppresses the expression and drug induction of CYP2B6 in human hepatocytes. Biochem Pharmacol 2016;113:88–96. [DOI] [PMC free article] [PubMed] [Google Scholar]
- 22.Song J, Li Y. miR-25-3p reverses epithelial-mesenchymal transition via targeting Sema4C in cisplatin-resistance cervical cancer cells. Cancer Sci 2017;108:23–31. [DOI] [PMC free article] [PubMed] [Google Scholar] [Retracted]
- 23.Li L, Zhang K, Lee J, et al. Discovering cancer genes by integrating network and functional properties. BMC Med Genomics 2009;2:61. [DOI] [PMC free article] [PubMed] [Google Scholar]
- 24.Hood L, Heath JR, Phelps ME, Lin B. Systems biology and new technologies enable predictive and preventative medicine. Science 2004;306:640–3. [DOI] [PubMed] [Google Scholar]
- 25.Moser C, Ruemmele P, Gehmert S, et al. STAT5b as molecular target in pancreatic cancer-inhibition of tumor growth, angiogenesis, and metastases. Neoplasia 2012;14:915–25. [DOI] [PMC free article] [PubMed] [Google Scholar]
- 26.Liu A, Huang C, Cai X, et al. Twist promotes angiogenesis in pancreatic cancer by targeting miR-497/VEGFA axis. Oncotarget 2016;7:25801–14. [DOI] [PMC free article] [PubMed] [Google Scholar]
- 27.Hempen PM, Kurpad H, Calhoun ES, et al. A double missense variation of the BUB1 gene and a defective mitotic spindle checkpoint in the pancreatic cancer cell line Hs766T. Hum Mutat 2003;21:445. [DOI] [PubMed] [Google Scholar]
- 28.Liu J, Shen L, Yao J, et al. Forkhead box C1 promoter upstream transcript, a novel long non-coding RNA, regulates proliferation and migration in basal-like breast cancer. Mol Med Rep 2015;11:3155–9. [DOI] [PubMed] [Google Scholar]
- 29.Janku F, Lee JJ, Tsimberidou AM, et al. PIK3CA mutations frequently coexist with RAS and BRAF mutations in patients with advanced cancers. PLoS One 2011;6:e22769. [DOI] [PMC free article] [PubMed] [Google Scholar]
Associated Data
This section collects any data citations, data availability statements, or supplementary materials included in this article.
Supplementary Materials
Data Availability Statement
The data that support the findings of this study are available from the corresponding author, LS, upon reasonable request.


