Abstract
Environmental cues profoundly affect cellular plasticity in multicellular organisms. For instance, exercise promotes a glycolytic-to-oxidative fiber-type switch in skeletal muscle, and cold acclimation induces beige adipocyte biogenesis in adipose tissue. However, the molecular mechanisms by which physiological or pathological cues evokes developmental plasticity remain insufficiently understood. Here, we report a previously uncharacterized form of beige adipocytes that play a critical role in cold adaptation in the absence of β-adrenergic receptor (β-AR) signaling. This unique beige fat possesses distinct characteristics from the conventional beige fat in their developmental origin, regulation, and enhanced glucose oxidation; hence, we refer to them as glycolytic beige fat (g-beige). Mechanistically, we identify GA-binding protein alpha (GABPα) that controls g-beige adipocyte differentiation through a myogenic intermediate. Our study uncovers a non-canonical adaptive mechanism by which thermal stress induces progenitor cell plasticity and recruits a distinct form of thermogenic cells required for energy homeostasis and survival.
Keywords: Adaptive thermogenesis, Brown adipose tissue, Beige fat, Glycolytic beige adipocytes
Cold acclimation stimulates non-shivering adipose tissue thermogenesis primarily through activation of the sympathetic nervous system, followed by increased β-AR signaling1. Beige fat, an inducible form of thermogenic adipocyte, has become an extensive research interest because it has potent anti-obesity and diabetic effects2–4, and the existence of beige adipocytes in adult humans has been verified by the molecular analyses5–8 and 18F-fluorodeoxyglucose Positron Emission Tomography (18FDG-PET/CT)-based imaging showing that cold acclimation promotes the recruitment of new thermogenic fat in adults9–11. Although extensive efforts have been made in the past to activate adipose tissue thermogenesis using selective β3-AR agonists as an anti-obesity medication, these attempts were unsuccessful partly because their poor bioavailability and safety concerns that pharmacological β3-AR activation leads to an increase in blood pressure, a major risk factor for cardiovascular diseases12. Thus, identifying alternative pathways to promote beige fat biogenesis, which bypass β-AR signaling, promises auspicious therapeutic interventions with minimal cardiovascular risks.
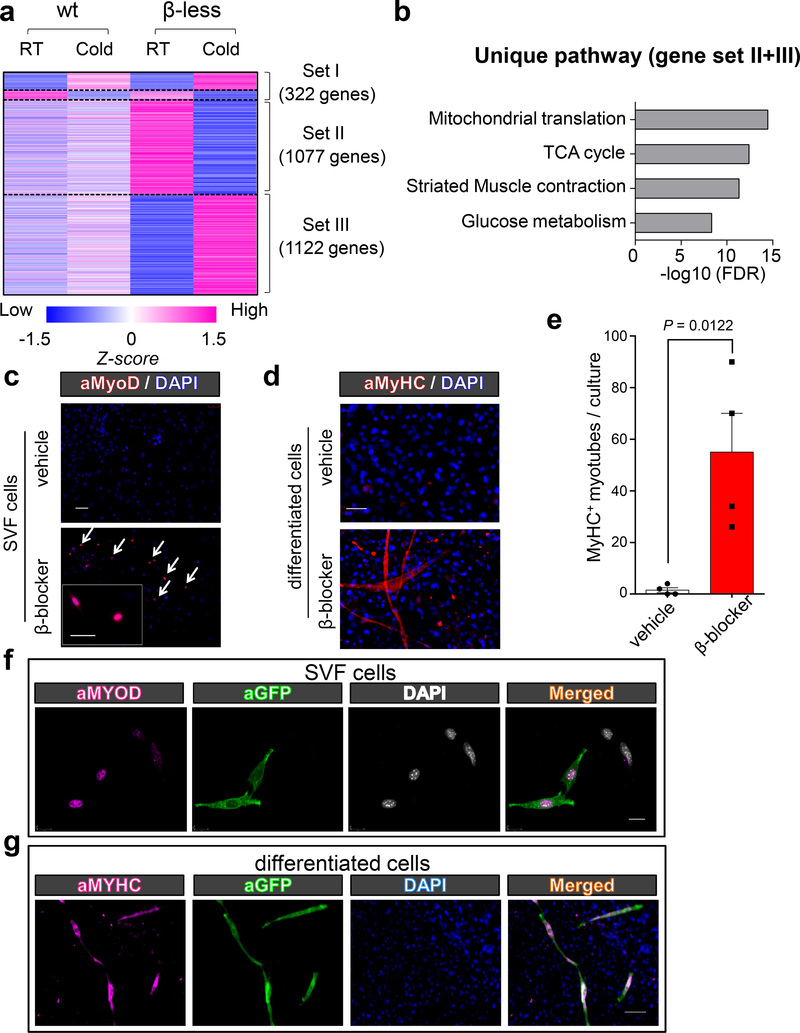
Here, we aimed to identify new compensatory pathways of beige fat biogenesis in the absence of β-AR signaling. To do so, we used a mouse model lacking all the three forms of β-ARs (β-less mouse)13. After β-less mice and wild-type control mice (WT) were gradually acclimated to a mild cold condition at 15°C, their adaptive thermogenic response was analyzed (Extended Data Fig. 1a). Consistent with a previous study13, the thermogenic gene expression in the interscapular BAT (iBAT) was significantly lower in β-less mice than controls (Extended Data Fig. 1b). However, we found, along with others14,15, that β-ARs signaling was dispensable for cold-induced beige adipocyte biogenesis in vivo. RNA-seq followed by the biological pathway analysis in the inguinal white adipose tissue (WAT) identified genes (Set I, Fig. 1a) that were involved in brown fat thermogenesis, respiratory electron transport, and fatty acid metabolism (e.g., Ucp1, Elovl3, and Cox8b), whose expression was altered by cold exposure both in WT mice and β-less mice (Extended Data Fig. 1c-d). However, the underlying mechanism by which cold acclimation stimulates beige adipocyte biogenesis in the absence of β-ARs remained unknown.
Fig.1. β-AR blockade promotes myogenesis in inguinal WAT.
a, Transcriptomics in the inguinal WAT of WT and β-less mice at 23°C or 15ºC. n=3, biologically independent samples. P < 0.05 analyzed by two-sided t-test. b, GO analysis of Gene Set II & III. P values (−log10) by delta method–based test. c, Immuno-fluorescent staining of MyoD (arrows) in the inguinal WAT-derived SVFs from β-blocker or vehicle-treated mice. Scale bar=100 μm. d, Immuno-fluorescent staining of MyHC in differentiated SVF cells under pro-adipogenic conditions. Scale bar=100 μm. e, Quantification of MyHC+ myotubes in (d). n=4 biologically independent samples. Data are mean ± SEM, and analyzed by unpaired Student’s two-sided t-test. f, Immuno-fluorescent staining of MyoD (arrows) in the inguinal WAT-derived SVFs from Myod-CreERT2 reporter mice. Scale bar=20 μm. g, Immuno-fluorescent staining of MyHC in differentiated SVFs. Scale bar=100 μm. (c,d,f,g) DAPI as counter stain. The images represent four independent experiments.
β-AR blockade promotes myogenesis in WAT
We identified unique genes (Set II and III) that were regulated only in β-less mice following cold exposure and involved in mitochondrial translation, TCA cycle, striated muscle contraction, and glucose metabolism (Fig. 1b). Striated muscle contraction caught our attention given the heterogeneous cellular origins of inguinal WAT16. This unexpected observation was validated by gene expression analyses of skeletal muscle-related genes, including Myh1 and Acta1, in the inguinal WAT and other tissues (Extended Data Fig. 1e-g).
The ectopic induction of myogenic genes in the inguinal WAT of β-less mice was not caused by a constitutive genetic loss of β-ARs, because similar results were observed following temporal blockade of β-AR signaling by administering propranolol hydrochloride (known as β-blocker) to WT mice (Extended Data Fig. 1h-i). Unexpectedly, we found that a subset of the cells in the stromal vascular fraction (SVF), isolated from the inguinal WAT of β-blocker-treated mice but not vehicle-treat mice, expressed MyoD protein (Fig. 1c). The stromal cells from β-blocker-treated mice fused together and formed multi-nucleated myotubes that expressed myosin heavy chain (MyHC) and actively twitched by day 6 of differentiation under pro-adipogenic media (Fig. 1d and SI Video). By contrast, we did not observe MyHC+ myotubes in vehicle-treated mice (Fig. 1e) nor in the SVFs from iBAT and epidydimal WAT (Extended Data Fig. 1j-k). Furthermore, lineage tracing using the inducible Myod-CreERT2 reporter mice (Myod-CreERT2;Rosa26-mTmG) (Extended Data Fig. 1l) found that β-AR blockade lead to emergence of mononucleated MyoD+ cells that were labeled by GFP in the inguinal WAT-derived SVFs (Fig. 1f) and that these cells underwent myogenesis into GFP+ myotubes even cultured under pro-adipogenic conditions (Fig. 1g).
Identification of glycolytic beige fat
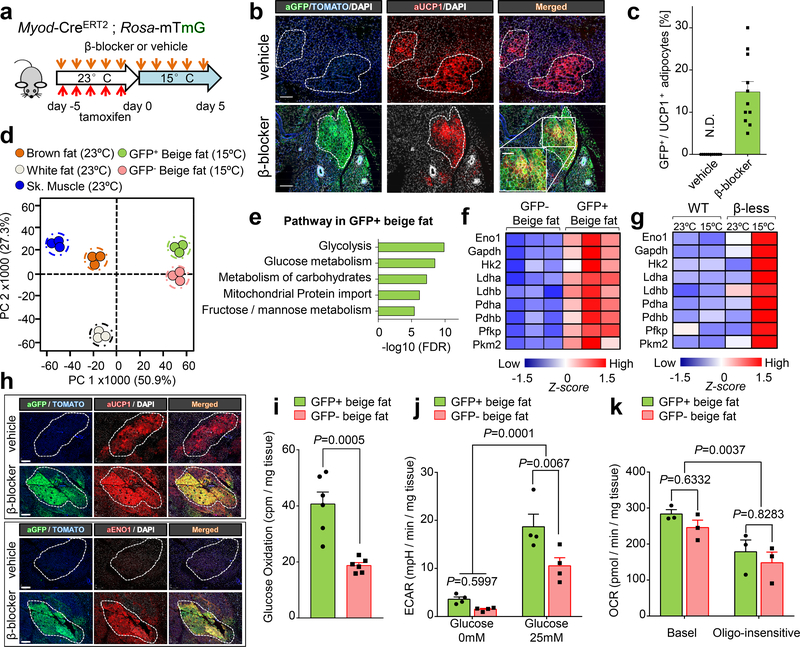
Although Myod-lineage cells do not typically give rise to either white or beige adipocytes16,17, our unexpected results show that MyoD+ cells emerge within inguinal WAT when β-AR signaling is inhibited. Accordingly, we performed lineage tracing using Myod-CreERT2 reporter mice that were pre-treated with β-blocker or vehicle together with tamoxifen at ambient temperature for 5 days, and subsequently acclimated to 15°C for additional 5 days (Fig. 2a). By the end of 5-day-cold exposure, we observed a substantial number of UCP1+ beige adipocytes in the inguinal WAT, although no Myod-derived beige adipocytes were found in vehicle-treated mice. On the other hand, we found that a subset of UCP1+ beige adipocytes were derived from MyoD+ cells and localized near the lymph node where microvasculature (CD31+ endothelial cells) were enriched (Fig. 2b and Extended Data Fig. 2a-b). Since cold-induced GFP+ beige adipocytes do not express endogenous MyoD despite the developmental origin from MyoD+ progenitors, we refer to them as Myod-derived beige fat. On average, Myod-derived beige adipocytes accounted for 14.8% ± 2.5% of total UCP1+ beige adipocytes in the inguinal WAT of β-blocker-treated mice after 5 days at 15°C (Fig. 2c). No detectable Myod-derived adipocytes were found in iBAT and epididymal WAT (Extended Data Fig. 2c-d). Of note, Myod-derived beige adipocytes were induced without β-blocker when mice were kept under a prolonged severe cold condition at 6 °C for 2 weeks (8.75 % ± 1.59%) (Extended Data Fig. 2e). The effect of cold acclimation on Myod-derived beige adipocyte biogenesis is mediated through a distinct mechanism from the activation of β3-AR because no Myod-derived beige adipocytes were found after 2-weeks-treatment with a β3-AR agonist (CL316,243) (Extended Data Fig. 2f-g). Besides, no beige adipocytes were derived from Myogenin-lineage (Extended Data Fig. 2h-i). These results suggest that stromal cells in inguinal WAT possess a unique progenitor population that expresses Myod, but still retain cellular plasticity to give rise to beige adipocytes under cold conditions when β-AR signaling is inhibited.
Fig.2. MyoD+ progenitors in inguinal WAT give rise to glycolytic beige fat.
a, Schematic of the experiment. b, Immuno-fluorescent staining of GFP and UCP in the inguinal WAT of mice in (a). Scale bar=100 μm. c, Quantification of GFP+ beige adipocytes among total UCP1+ adipocytes in inguinal WAT. n=11 biologically independent samples. N.D., not detected. Data are mean ± SEM. d, PCA of transcriptome from indicated tissues. n=3 biologically independent samples. e, GO analysis of enriched genes in GFP+ beige fat in (d). f, Expression of glucose metabolism genes. n=3 biologically independent samples, P<0.05 by unpaired Student’s two-sided t-test. g, Expression of glucose metabolism genes in inguinal WAT of WT and β-less mice. n=3 biologically independent samples, P<0.05 by one-way ANOVA followed by Tukey’s test. h, Immuno-fluorescent staining of GFP, UCP1, and ENO1 in inguinal WAT of Myod-CreERT2 reporter mice at 15°C. Scale bar=100 μm. i, Glucose oxidation in GFP+ and GFP- beige fat from β-blocker-treated Myod-CreERT2 reporter mice at 15°C. n=6 biologically independent samples. Data are mean ± SEM, and analyzed by unpaired Student’s two-sided t-test. j, ECAR in GFP+ and GFP- beige fat from Myod-CreERT2 reporter mice under glucose free (0mM) or high glucose medium (25mM) conditions. n=4. k, OCR in GFP+ and GFP- beige fat from Myod-CreERT2 reporter mice. n=3. (b,h) DAPI and tdTomato for counter staining. The images represent three independent experiments. (j-k) Data are expressed as mean ± SEM of biologically independent samples, and analyzed by two-way ANOVA by Bonferroni’s test adjustment.
To ask whether Myod-derived beige adipocytes constitute a distinct adipose cell population, we used laser-capture microdissection to isolate Myod-derived and non-Myod-derived beige adipocytes in inguinal WAT for transcriptomics. As additional controls, transcriptome data from brown adipocytes, white adipocytes from inguinal WAT, and skeletal muscle were included. The transcriptome data suggests that Myod-derived GFP+ adipocytes were classified as beige adipocytes, but not myocytes, because they abundantly expressed brown/beige fat-selective markers (Ucp1, Kcnk3) and adipocyte-selective genes (Adiponectin, Fabp4), whereas they did not express skeletal muscle-specific genes (Myh1, Myogenin) (Extended Data Fig. 3a-b). Principle Components Analysis (PCA) showed that Myod-derived beige fat exhibited a distinct molecular signature from the conventional beige fat, although it was far distinct from brown adipocytes, white adipocytes, or skeletal muscle (Fig. 2d). Notably, many genes involved in glycolysis, glucose metabolism, carbohydrate metabolism, and fructose/mannose metabolism, were enriched in Myod-derived beige adipocytes relative to non-Myod-derived beige fat (Fig. 2e). For example, expression of the glycolysis genes, including Eno1 and Pkm2, was significantly higher in Myod-derived beige adipocytes relative to GFP- beige adipocytes (Fig. 2f and Extended Data Fig. 3c). These glycolytic genes were also highly enriched in the inguinal WAT of β-less mice following cold exposure (Fig. 2g). On the other hand, expression of β3-AR was lower in Myod-derived beige adipocytes than GFP- beige adipocytes (Extended Data Fig. 3d).
The above results suggest that Myod-derived beige fat possesses enhanced glucose metabolism. Consistent with the notion, we found that Enolase 1 (ENO1), a marker of glycolytic cells, was abundantly expressed in nearly all the Myod-derived beige fat (Fig. 2h). Furthermore, Myod-derived GFP+ beige fat exhibited significantly higher glucose oxidation than GFP- beige fat (Fig. 2i), although no difference was found in fatty acid oxidation (Extended Data Fig. 3e). Similarly, extracellular acidification rate (ECAR) was significantly higher in Myod-derived beige fat than GFP- beige fat in the presence of glucose (Fig. 2j), while both types exhibited similar oxygen consumption rate (OCR) (Fig. 2k). These results indicate that an adaptive thermogenic response promotes the formation of unique beige fat with enhanced glucose metabolism, i.e., glycolytic beige fat (g-beige fat) when β-AR signaling is blocked.
Characterizing g-beige fat progenitors
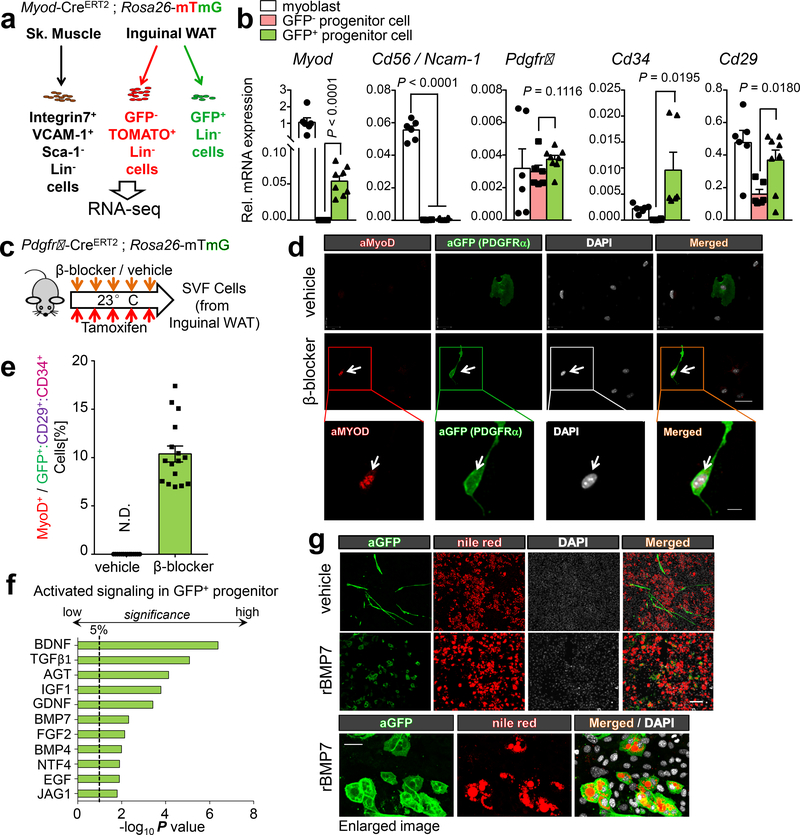
We aimed to probe the lineage relationship between MyoD+ stromal cells and other cell types in the SVFs of inguinal WAT. The emergence of MyoD+ cells was not due to proliferation of pre-existing MyoD+ progenitors because we did not detect BrdU incorporation in MyoD+ cells following β-blocker treatment (Extended Data Fig. 4a-b). Thus, we next characterized the molecular signatures of Lin-:GFP+ stromal cells in the inguinal WAT of Myod-CreERT2 reporter. The analysis also included satellite cell-derived myoblasts in skeletal muscle (Lin-:Sca1-:VCAM1+:integrin-α7+) and fibro-adipogenic progenitors (FAPs) (Fig. 3a and Extended Data Fig. 4c). Transcriptome analysis suggested that GFP+ progenitors exhibited a distinct molecular signature from myoblasts and FAPs (Extended Data Fig. 4d-e). For instance, qRT-PCR analysis in independent samples verified that a myoblast-enriched marker Ncam1 (Cd56) was not expressed in GFP+ progenitors, although GFP+ progenitors expressed Myod mRNA and MyoD protein (Fig. 3b and Extended Data Fig. 4f). Moreover, MyoD+ progenitors in inguinal WAT were not derived from Pax7-lineage (Extended Data Fig. 4g-h). Since GFP+ progenitors also expressed Pdgfra, Cd34, and Cd29 that mark adipogenic progenitors18, we next used Pdgfra-CreERT reporter mice to test the hypothesis that a subset of PDGFRα+:CD34+:CD29+ adipocyte progenitors express MyoD (Fig. 3c and Extended Data Fig. 5a-b). Following β-blocker treatment, we found that MyoD protein was detected in a subset (10.4% ± 0.8%) of GFP+(PDGFRα+):CD34+:CD29+ progenitors in the inguinal WAT, whereas no MyoD+ cell was observed in vehicle-treated mice (Fig. 3d-e and Extended Data Fig. 5c).
Fig.3. Characterization of MyoD+ progenitors.
a, GFP+ and GFP- SVFs from the inguinal WAT of Myod-CreERT2 reporter mice were applied for RNA-seq. b, Gene expression in GFP+ progenitors (n=8), GFP- progenitors (n=6), and myoblasts (n=6). Data are expressed as mean ± SEM of biologically independent samples, and analyzed by unpaired two-sided Student’s t-test. c, Inguinal WAT-derived SVFs were isolated from Pdgfrα-CreERT reporter mice with β-blocker or vehicle treatment. d, Immuno-fluorescent staining of MyoD and GFP in (c). DAPI for counter stain. Scale bar=25 μm. Enlarged image, Scale bar=10 μm. e, Quantification of MyoD+ cells in Lin-:PDGFRα+(GFP+):CD34+:CD29+ cells in the inguinal WAT of Pdgfrα-CreERT reporter mice. n=16 biologically independent samples. Data are mean ± SEM. f, Ingenuity upstream analysis of transcriptomics in GFP+ progenitors. Over-representation analysis is used and −log10 of the P values determined by the delta-method based hypothesis test. g, Immuno-fluorescent staining of GFP and Nile-red staining of lipid droplets on differentiated cells pre-treated with rBMP7 or vehicle. DAPI for counter staining. Scale bar=100 μm. Enlarged image represent of independent experiments, Scale bar=25 μm. (d,g) The images represent three independent experiments.
To elucidate the upstream signaling of MyoD+ progenitors, we applied Ingenuity pathway analysis to the above transcriptome data. The analysis identified enhanced signaling pathways enriched in MyoD+ progenitors, including but not limited to those induced by bone morphogenetic proteins (BMPs) (Fig. 3f). This is consistent with the observations that MyoD+ progenitors abundantly expressed Smad5 and a BMP receptor Bmpr1b (Extended Data Fig. 6a). Because BMP7 is known to promote brown adipogenesis19, we probed whether BMP7 promotes beige adipogenesis in MyoD+ progenitors using Myod-CreERT2 reporter mice (Extended Data Fig. 6b). By 8 days of differentiation under pro-adipogenic conditions with rBMP7 pre-treatment, a large part of the GFP+ progenitors differentiated into adipocytes containing numerous lipid droplets, while all the GFP+ progenitors formed myotubes without rBMP7 pre-treatment (Fig. 3g). Adipogenesis in MyoD+ progenitors was regulated independently from α/β-AR signaling because known activators of α/β-AR signaling did not promote adipocyte differentiation (Extended Data Fig. 6c).
GABPα controls g-beige fat development
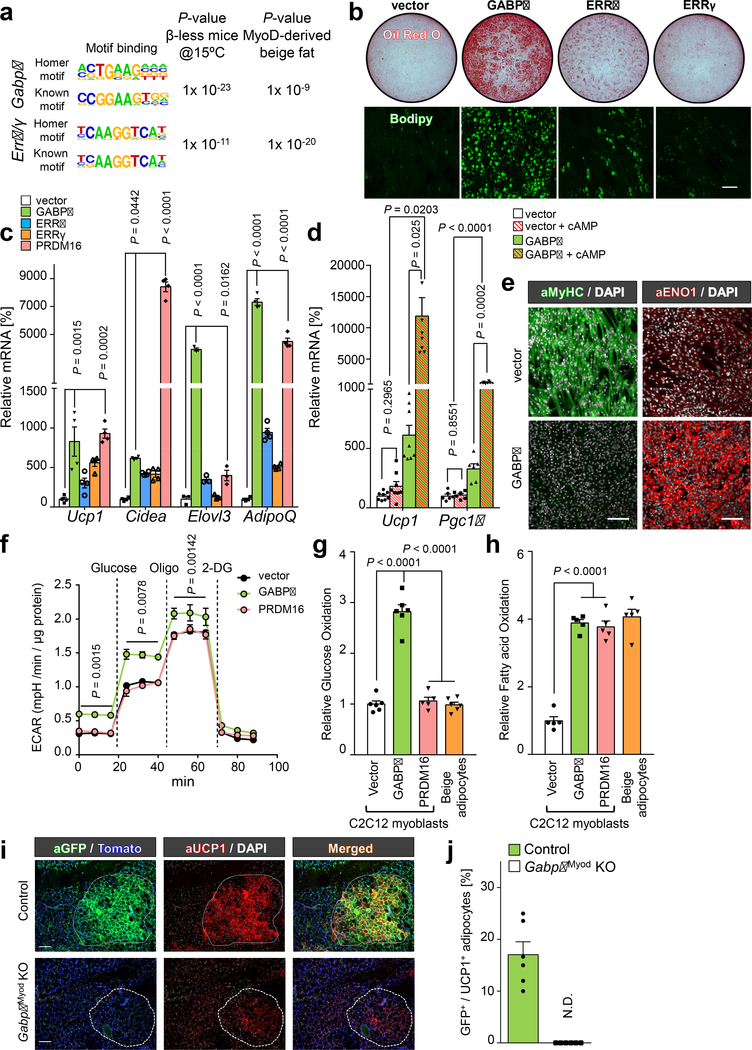
To examine the transcriptional circuits that control g-beige adipocyte differentiation, we applied the transcriptome datasets of g-beige fat and β-less mice to HOMER (Hypergeometric Optimization of Motif Enrichment) analysis20. This analysis identified DNA-binding motifs for GA-binding protein-α (GABPα), estrogen-related receptor-α (ERRα), and ERRγ, all of which were significantly enriched in Myod-derived g-beige fat and cold-induced beige fat in β-less mice (Fig. 4a and Extended Data Fig. 7a-c). Previous reports show that GABPα, ERRα, and ERRγ stimulate mitochondrial biogenesis and the OXPHOS program through the interaction with PGC1α21–23. Accordingly, we overexpressed each factor in C2C12 myoblasts and tested if any of the transcription factors induced g-beige adipocyte differentiation in MyoD+ progenitors (Extended Data Fig. 7d). Under pro-adipogenic conditions, C2C12 cells expressing an empty vector differentiated into myotubes; however, GABPα-expressing myoblasts efficiently differentiated into lipid-containing adipocytes (Fig. 4b). A small fraction of ERRα-expressing cells, but not ERRγ-expressing cells, differentiated into adipocytes, although their adipogenic differentiation potency was far lower than GABPα-expressing myoblasts. Notably, GABPα potently promoted beige adipogenesis in C2C12 myoblasts to levels comparable to PRDM16 with a 3,908-fold increase in Adiponectin (Fig. 4c). Akin to thermogenic adipocytes, GABPα-expressing adipocytes expressed thermogenic genes at levels significantly higher than controls, such as Ucp1 (65.7-fold) and Pgc1a (11.4-fold) in response to forskolin (cAMP) treatment (Fig. 4d). Furthermore, GABPα-expressing cells expressed ENO1, PPARγ, UCP1 protein under pro-adipogenic conditions, whereas GABPα inhibited myogenesis and Myod mRNA expression (Fig. 4e and Extended Data Fig. 7e-f). Since C2C12 cells expressed undetectable levels of endogenous PRDM16, and GABPα did not induce Prdm16 expression (Extended Data Fig. 7g), GABPα appears to stimulate g-beige adipogenesis independent of PRDM16. At the functional level, GABPα-expressing adipocytes exhibited higher ECAR than controls and PRDM16-expressing adipocytes (Fig. 4f). Importantly, GABPα-expressing adipocytes displayed high glucose uptake and oxidation (Fig. 4g and Extended Data Fig. 8a), while fatty acid oxidation and OCR were at comparable levels (Fig. 4h and Extended Data Fig. 8b). These data indicate that GABPα drives g-beige fat differentiation program in MyoD+ progenitors.
Fig.4. GABPα promotes g-beige fat differentiation in myoblasts.
a, HOMER motif analysis based on transcriptomics from β-less mice (left) and g-beige fat (right). P values represents enrichment of indicated binding motifs. b, Oil-O-Red staining and Bodipy staining of differentiated C2C12 cells expressing am empty vector or indicated factors under pro-adipogenic conditions. Scale bar=100 μm. c, mRNA expression of indicated genes in differentiated C2C12 cells. n=3–4. d, mRNA expression of Ucp1 and Pgc1α in differentiated C2C12 cells treated with or without forskolin (cAMP). n=6–8. e, Immuno-fluorescent staining of MyHC and ENO1 in differentiated C2C12 cells. DAPI for counter stain. Scale bar=100 μm. f, ECAR in differentiated C2C12 cells. n=10, biologically independent samples. Data are mean ± SEM, and analyzed by two-way ANOVA followed by Bonferroni’s test. g, Glucose oxidation in indicated cells. n=6. h, Fatty acid oxidation in indicated cells. n=5. i, Immuno-fluorescent staining of GFP and UCP1 in the inguinal WAT of control and GabpαMyod KO mice. Mice were pre-treated with β-blocker and acclimated to 15°C. tdTomato or DAPI for counter stain. Scale bar=100 μm. j, Quantification of GFP+:UCP1+ adipocytes in (i). n=6. N.D., not detected. Data are expressed as mean ± SEM. (b,e,j) The images represent three independent experiments. (c,d,g,h) Data are mean ± SEM of biologically independent samples and analyzed by ANOVA followed by Tukey’s test.
To determine the requirement of GABPα for g-beige adipocyte development, two independent lentiviruses that expressed shRNAs targeting Gabpα (shGabpα-#1 and #2) or a scrambled control (SCR) were infected in primary MyoD+ progenitors from Myod-CreERT2 reporter mice (Extended Data Fig. 8c). We found that adipogenesis in MyoD+ progenitors was severely impaired when Gabpα was depleted by sh-Gabpα, while SCR-control cells differentiated into adipocytes under pro-adipogenic conditions with rBMP7 pre-treatment (Extended Data Fig. 8d). Gene expression analysis showed that knockdown of Gabpα significantly reduced the expression of Ucp1, Adiponectin, and Fabp4, whereas expression of myogenic genes, Myh1 and Myod, was elevated in Gabpα-knockdown cells (Extended Data Fig. 8e). Furthermore, Gabpα knockdown significantly reduced OCR and ECAR relative to SCR-control cells (Extended Data Fig. 8f-g). Accordingly, we asked if GABPα was required for g-beige fat biogenesis in vivo. Since whole-body deletion of Gabpα causes embryonic lethality24, we generated MyoD-specific GABPα KO mice (GabpαMyod KO, Myod-CreERT2;Gabpαflox/flox;Rosa26-mTmG). Of note, these mice contained the Rosa26-mTmG reporter, allowing us to trace and quantify the number of Myod-derived g-beige adipocytes. Following β-blocker pre-treatment and cold acclimation to 15°C, control mice (Myod-CreERT2;Gabpαflox/+;Rosa26-mTmG) formed GFP+:UCP1+ g-beige adipocytes. In contrast, the formation of g-beige adipocytes was impaired in GabpαMyod KO mice, although GFP-:UCP1+ beige adipocytes were still observed (Fig. 4i-j). These results indicate that GABPα is required for g-beige fat development.
The role of g-beige fat in metabolism
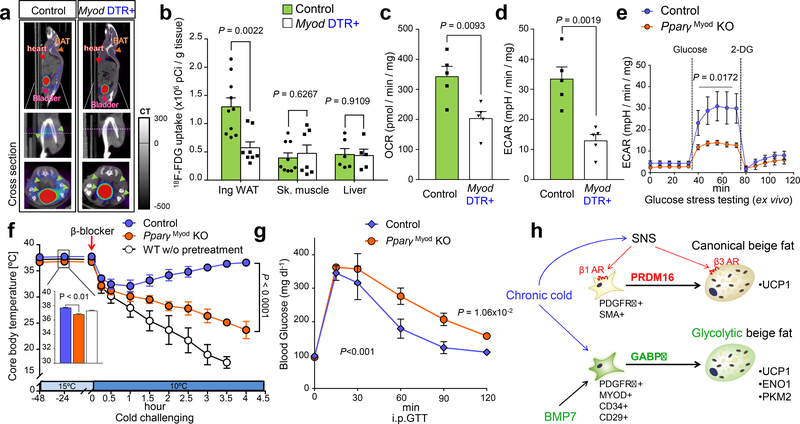
To examine the role of g-beige fat in vivo, we developed g-beige fat deficient mice by crossing Myod-CreERT2 mice with mice expressing a loxP-flanked stop cassette upstream of the diphtheria toxin receptor (DTR) (Extended Data Fig. 9a). This model enabled selective depletion of Myod-derived cells upon administration of diphtheria toxin (DT). Myod-CreERT2;Rosa26-DTR mice (Myod-DTR+) or littermate control mice (Myod-CreERT2) were pre-treated with β-blocker and acclimated to 15°C, leading to the formation of Myod-derived glycolytic beige fat. Of note, β-blocker treatment reduced glucose uptake by iBAT and heart, and completely suppressed iBAT thermogenesis without affecting muscle shivering (Extended Data Fig. 9b-e). Following DT treatment, glycolytic beige fat, as visualized by ENO1 and UCP1 immunostaining, were substantially reduced in Myod-DTR+ mice relative to control mice with without changing muscle shivering (Extended Data Fig. 9f-h). 18FDG-PET/CT imaging detected active glucose uptake in the inguinal WAT of control mice due to g-beige formation; however, glucose uptake in the inguinal WAT of Myod-DTR+ mice, but not in the muscle and liver, was significantly decreased (Fig. 5a-b). We also found that DT-induced depletion of g-beige fat lead to a significant reduction in OCR and ECAR in the inguinal WAT (Fig. 5c-d). Because of the possibility that muscle function is impaired in Myod-DTR+ mice, we developed an alternative g-beige defective mouse model by deleting PPARγ in Myod-derived cells (PpargMyoD KO) (Extended Data Fig. 10a-c). Consistent with the results in Myod-DTR+ mice, Myod-specific PPARγ deletion reduced OCR and ECAR in the inguinal WAT (Fig. 5e and Extended Data Fig. 10d). These data suggest that Myod-derived g-beige fat significantly contributes to cold-stimulated glucose uptake and thermogenesis in the inguinal WAT.
Fig.5. Requirement of g-beige fat for energy homeostasis.
d, 18F-FDG PET/CT images of control mice and Myod-DTR+ mice following cold acclimation. Green arrows indicate 18F-FDG uptake in inguinal WAT. e, Quantification of 18F-FDG uptake in indicated tissues. Inguinal WAT, Control, n=10; Myod-DTR+, n=8. In skeletal muscle, Control, n=9; Myod-DTR+, n=7. In liver, Control, n=6; Myod-DTR+, n=5. Data are expressed as mean ± SEM of biologically independent samples, and analyzed by two-sided unpaired Student’s t-test. f, OCR in inguinal WAT. n=5. g, ECAR in inguinal WAT. n=5. h, Glucose stress test in inguinal WAT of PpargMyoD KO and control mice. Glucose (25 mM) and 2-DG were added at indicated points. n=6. Data are mean ± SEM, and analyzed by ANOVA followed by Tukey’s test. i, Changes in rectal temperature during cold acclimation. Control and PpargMyoD KO mice were pre-treated with β-blocker for 5 days and acclimated to 15°C. WT mice did not receive pre-β-blocker-treatment. Acute β-blocker at the indicated arrow. Data are mean ± SD of biologically independent mice. n=6 for control mice, n=4 for PpargMyoD KO mice, and n=7 for WT mice. The inset graph: core-body temperature at 15°C. j, Glucose tolerance test in mice treated with β-blocker and acclimated to 15°C. n=7 for control, n=5 for PpargMyoD KO mice. Data are expressed as mean ± SEM of biologically independent mice. k, A mechanism of g-beige adipocyte development. see text in detail. (b,c,d) The images represent three independent experiments. (f,g) Data are mean ± SEM of biologically independent samples, and analyzed by two-sided unpaired Student’s t-test. (i,j) Data are analyzed by two-way ANOVA followed by Bonferroni’s test.
Lastly, we examined the role of g-beige fat in adaptive thermogenesis and systemic glucose homeostasis. Since no difference was seen in muscle shivering between PpargMyoD KO mice and littermate controls (Extended Data Fig. 10e), the contribution of shivering thermogenesis appears negligible in this model. Upon acute β-blocker treatment followed by 10°C cold exposure, WT mice without β-blocker pre-treatment quickly developed hypothermia because of the paucity of iBAT thermogenesis and g-beige fat biogenesis. On the other hand, mice with β-blocker pre-treatment were able to maintain their core body temperature up to 4 hr at 10°C even after acute β-blocker treatment. PpargMyoD KO mice exhibited slightly lower core-body temperature than control mice at 15°C and developed severe hypothermia shortly after cold exposure at 10 °C (Fig. 5f). Consistent with the observation, PpargMyoD KO mice exhibited modestly but significantly lower whole-body energy expenditure (VO2) than control mice following β-blocker treatment at 15°C (Extended Data Fig. 10f-h). Furthermore, PpargMyoD KO mice were glucose intolerant relative to body weight-matched control mice (Fig. 5g and Extended Data Fig. 10i). These data suggest that g-beige fat is required for cold-induced adaptive thermogenesis and systemic glucose homeostasis when β-AR signaling is inhibited.
Discussion
The present study identifies a previously uncharacterized developmental pathway through which an adaptive response promotes an alternative thermogenic program via g-beige fat biogenesis. In response to cold acclimation, progenitors expressing Sma1, Pax3, Pdgfra, or Pdfgrb in the SVFs of WAT give rise to beige adipocytes through β1/3-AR signaling pathway16,17,25–27. However, under the condition in which β-AR signaling is impaired or prolonged severe cold conditions, a subset of PDGFRα+:CD34+:CD29+ progenitors in subcutaneous WAT expresses MyoD, yet retaining the cellular plasticity to undergo beige adipogenesis following cold acclimation. Myod-derived beige adipocytes are distinct from the canonical beige adipocytes in their molecular signature, developmental origin/regulation, and cellular metabolism, with enhanced glucose utilization (Fig. 5h).
Two forms of thermogenic adipocytes, brown and beige adipocytes, have been described in mammals28. Since brown adipocytes in iBAT express substantially higher levels of UCP1 than beige adipocytes, beige fat was considered to play a marginal role in whole-body energy expenditure29. However, recent studies demonstrated the crucial roles of beige fat in the regulation of whole-body energy homeostasis through UCP1-independent thermogenic mechanisms3,30 as well as non-thermogenic mechanisms (e.g., anti-inflammatory and anti-fibrosis)31. These studies indicate the multifaced roles of beige fat beyond heat-generation28. Here we identified a new population of beige adipocytes that controls thermogenesis and glucose homeostasis in the absence of β-AR signaling. It is conceivable that multiple sub-types of thermogenic adipocytes with distinct cellular origins exist, and that each sub-type has unique biological roles depending on the nature of external stimuli, such as cold acclimation, caloric restriction/manipulation, exercise, cachexia, bariatric surgery, and injury. A better understanding of adipose cell heterogeneity under such environmental changes will provide new insights into the molecular basis of metabolic adaptation in physiology and disease.
Methods
Animals.
All animal experiments were performed following the guidelines established by the UCSF Institutional Animal Care and Use Committee. All the mice were 12–16 weeks old male, had free access to food and water, 12 hr light cycles, and were caged at 23 °C. Rosa26-mTmG mice (Stock No. 007576), Myod-CreERT2 mice (Stock No. 025667), Pdgfra-CreERT (Stock No. 018280), Rosa26-iDTR mice (Stock No. 007900), Ppargflox/flox (Stock No. 004584), and Rosa26-tdTomato (Stock No.007905) were obtained from the Jackson Laboratory. Pax7-CreERT mice32 and Gabpaflox/flox mice24 were generous gifts from Dr. Keller and Dr. Burden, respectively. Myogenin-Cre mice were obtained from Dr. Haldar’s lab at Gladstone Institutes. Mice were randomly assigned at the time of purchase or weaning to minimize any potential bias. For cold exposure experiments, mice were singly caged and exposed to mild cold temperature at 15 °C, 10 °C, or 6 °C. Mice were treated intraperitoneally with β-blocker (propranolol) at a dose of 25 mg kg BW−1 day−1, with saline as a vehicle control at room temperature for 5 days. Subsequently, the treated mice were acclimated to a mild cold condition for additional 5 days. Metabolic cage analyses were performed by a staff scientist who was blinded to the experimental groups. Other experiments were not blinded.
Chemicals and antibodies.
All the chemicals were obtained from Sigma-Aldrich unless otherwise specified. Following antibodies were used in this study: GFP antibody (GFP-1020, Aves), UCP1 antibody (ab-10983, Abcam), ENO1 antibody (ab-155102, Abcam), Myosin (Skeletal) antibody (M7523-.2ML, Sigma-Aldrich), MyoD antibody (sc-760, Santa Cruz Biotech); Alexa Fluor 488 goat anti-chicken (A-11039, Life Technologies), Alexa Fluor 546 goat anti-rabbit (A-11035, Life Technologies), Alexa Fluor 647 goat anti-rabbit (A-21244, Life Technologies), and Biotinylated goat anti-rabbit (BA-1000, Vector), CD31-PE/Cy7 antibody (BD Biosciences), CD45-PE/Cy7 antibody (BD Biosciences), CD34-APC antibody (Biolegend), and CD29-APC/Cy7 antibody (Biolegend).
Genotyping, Tamoxifen and diphtheria toxin (DT) injection.
Genotyping of all Cre-transgenic mice was performed by PCR using primers detecting the Cre sequence, according to the protocol provided by the Jackson Laboratory. Genotyping of the Rosa locus was performed according to the Jackson laboratory protocol. To induce Cre expression in Myod-CREERT2 mice, Pax7-CreERT mice, or Pdgfra-CREERT mice, tamoxifen at 3 mg in 100 μl of corn oil per dose were administered via i.p. for 5 days. To ablate systemic Myod-derived cells in Myod-CREERT2;Rosa26-iDTR mice, DT was injected intraperitoneally for two to three consecutive days at a dose of 4 ng g−1 per injection33,34. All mice controls were sex and age-matched.
Cell culture.
Stromal vascular fraction (SVF) cells were isolated from the inguinal WAT of reporter mice according to our protocol35. MyoD+ progenitors isolated from Myod-CREERT2 reporter mice were immortalized by using the SV40 Large T antigen according to the cell immortalization protocol8. HEK293T, C2C12 cell lines were purchased from ATCC. No commonly misidentified cell line was used. All the cell lines used in this study were routinely tested negative for mycoplasma contamination. The cells were pretreated with 3.3 nM human recombinant BMP7 (PHC9544, Thermo Fisher Scientific) for two days prior to inducing adipogenesis in MyoD+ progenitors and C2C12 cells. Adipogenesis was induced by culturing 100% confluent cells in DMEM containing 10% FBS, 0.5 mM isobutylmethylxanthine, 125 nM indomethacin, 2 μg ml−1 dexamethasone, 850 nM insulin, and 1 nM T3, and 0.5 μM rosiglitazone. Three days after inducing adipogenesis, cell medium was replaced with the maintenance medium containing 10% FBS, 850 nM insulin, 1 nM T3, and 0.5 μM rosiglitazone36. Differentiated cells were treated with or without 10 μM forskolin (cAMP) for 4 hr before harvesting cells for analyses. To stimulate α- and β-ARs, we used agonists for α1-AR (phenylephrine, 10 μM), α2-AR (clonidine, 10 μM), β1-AR (denopamine, 10 μM), β2-AR agonist (formoterol, 2.5 μM), and β3-AR (CL316,243, 0.1 μM). The myoblast cell line C2C12 cells were purchased from ATCC. Lipid droplets were visualized by Oil-red-O staining or Nile Red staining (N1142, Thermo Fisher Scientific).
Fluorescence-activated cell sorting (FACS).
To obtain highly purified GFP+, TOMATO+ cells, the SVF cells were isolated from the inguinal WAT of tamoxifen-treated Myod-CREERT2; Rosa26-mTmG reporter mice, and subsequently sorted into sorting media (PBS containing 2% FBS). 7-Aminoactinomycin D (7-AAD) was used for viable cell gating. CD31-PE/Cy7 (BD Biosciences), CD45-PE/Cy7 (BD Biosciences), CD34-APC (Biolegend), and CD29-APC/Cy7 (Biolegend) antibodies or MACSR MicroBeads (Miltenyi Biotec Inc.) were used to remove lineage+ (Lin+) cells from tissue samples. Flow cytometric analysis and sorting were performed using FACS-Aria II (BD Biosciences).
Isolation of myogenic cells.
To obtain highly purified myogenic cells, mononucleated cells were isolated from uninjured muscles. Cells in sorting medium (10% HS, in Ham’s F-10) were incubated with VCAM-1-PE (Invitrogen), integrin-α7–649 (AbLab), CD31-PE/Cy7 (BD Biosciences), CD45-PE/Cy7 (BD Biosciences), and Sca1-APC/Cy7 (BD Biosciences) antibodies. Propidium iodide (PI) was used for viable cell gating. Myogenic cells had the following profile: VCAM1+/ integrin-α7+/CD31-/CD45-/Sca1-/PI-. For culture and derivation of myoblasts, myogenic cells were plated onto 1:1000 ECM (Extra Cellular Matrix) coated plates in Growth media (20% FBS, 5 ng/ml FGF-2 (R&D systems) in Ham’s F10).
RNA preparation and quantitative RT-PCR.
Total RNA was extracted from tissue or cells according to the RNeasy mini-kit (Qiagen) protocol. cDNA was synthesized using iScript cDNA Synthesis kit (BioRad) according to the provided protocol. qRT-PCR was performed using an ABI ViiA™7 PCR cycler. The primer sequences are listed in Supplementary Table 1.
Gene overexpression and specific gene knock-down by lentivirus.
Lentiviral vectors for overexpression constructs were purchased from GeneCopoeia. These constructs include Gabpα (EX-Mm02614-Lv120), Errα (EX-Mm24340-Lv121-GS), and Errγ (EX-Mm06385-Lv122). Lentiviral shRNA clones for Gabpα were also obtained from GeneCopoeia (MSH027139-LVRU6GH for mouse Gabpα and CSHCTR001-LVRU6GH for a scrambled control). For lentivirus production, HEK293T packaging cells were transfected with 10 μg lentiviral vectors using calcium phosphate method. After 48 hr of incubation, the viral supernatant was collected and filtered. C2C12 cells, inguinal WAT-derived stromal cells, or primary myoblast cells were incubated overnight with the viral supernatant and supplemented with 10 μg/ml polybrene. Puromycin at a dose of 2 μg/ml or Hygromycin at a dose of 200 μg/ml were used for selecting the stable-expressing cell line.
Lipid staining by Oil O Red or Bodipy.
Before staining, culture medium of the differentiated adipocytes was discarded. Cells were washed once with PBS, fixed in 4% paraformaldehyde for 20 min, and then stained with Oil Red O solution or for 20 min at ambient temperature or with 20 nM Bodipy in PBS for 15 min at 37 °C. Subsequently, cells were washed with PBS before imaging.
Laser micro-dissection.
The inguinal WAT of Myod-CREERT2;Rosa26-mTmG reporter mice were washed with PBS, and then embedded in Optimal Cutting Temperature (O.C.T.) compound on dry ice. Slides were pretreated with Poly-L-Lysin and subsequently dried overnight under UV light. Adipose tissue was sectioned (thickness of 50 μm), washed with PBS, followed by dehydration in 70%, 95%, and 100% Ethanol. GFP-positive and GFP-negative tissues were carefully dissected by laser microdissection (LMD) under a microscope (Leica LMD 7000). Total RNAs from the dissected tissues were extracted using RNeasy Micro Kit and MinElute Cleanup Kit (QIAGEN). RNA quality was assessed by using BioAnalyzer 2100.
RNA-sequencing and bioinformatics.
Sequencing libraries were constructed from total RNA as previously described 8. High-throughput sequencing was performed using a HiSeq 2500 instrument (Illumina) at Technology Center for Genomics & Bioinformatics in UCLA. After sequences were mapped using TopHat version 2.0.8 against the mouse (mm10) genome, the reads for each library were converted to FPKM (fragments per kilobase of exon per million fragments mapped) by running Cuffdiff 2.1.137. Transcriptome of FAPs was obtained from the published dataset (GSE86073). Biological pathway analysis was performed using Metascape38.
Tissue histology and Immunohistochemistry.
For Hematoxylin and eosin (H&E) staining, adipose tissue was fixed in 4% paraformaldehyde overnight at 4°C, followed by dehydration in 50% and 70% ethanol. The fixed tissues were stored in 70% ethanol until processing. After the dehydration procedure, adipose tissue was embedded in paraffin, sectioned at a thickness of 5 μm, and stained with Hematoxylin and eosin, following the standard protocol. Images were acquired with a DM2000 digital camera (Leica). For immunostaining, paraffin-embedded tissues were deparaffinized twice in xylene and subsequently rehydrated. After incubating the slides for 20 min in boiling water, the tissues were blocked in PBS containing 2% BSA for 60 min, followed by incubation with primary antibodies against ENO1(1:200) or UCP1 (1: 200) overnight at 4°C. The slides were then stained with secondary antibodies (1:200) for one hour at ambient temperature, then developed using the DAB regent. The color development time was optimized by monitoring the signal under the microscope. Development was terminated by washing the slides in water. Slides were mounted with mounting medium (Cytoseal™ 60, Thermo-Scientific), and images were captured using the Inverted Microscope Leica DMi8.
Immunohistofluorescence.
Stromal cells or differentiated beige adipocytes were fixed with 4% paraformaldehyde for 20 min at ambient temperature and then permeabilized in 0.1% Triton X-100 in PBS for 10 min, followed by blocking with 10% goat serum in PBS for 30 min. Cells or tissue slides were incubated with primary antibodies against MYHC (1:500), MyoD (1:75), UCP1 (1:200), ENO1 (1:200), or GFP (1:500) overnight at 4°C. Subsequently, the slides were stained with secondary antibodies (1:500) for one hour at ambient temperature. The slides were also counterstained with DAPI, then mounted in Vector shield mounting medium (Vector Labs). Imaging was obtained using the Leica confocal Microscope DMi8 with the software Leica TCS-SP8. For quantification of glycolytic beige adipocytes, we randomly chose 10 slides from each mouse and counted the number of GFP+ and UCP1+ or ENO1+ adipocytes. Because glycolytic beige adipocytes were enriched in the central part of the inguinal WAT near lymph node, all the image-based analyses were performed using histology sections in the central part of inguinal WAT containing the lymph node.
Oxygen consumption and glucose stress assays.
Oxygen consumption rate (OCR) and Extracellular acidification rate (ECAR) were measured in isolated tissues or cultured adipocytes using the Seahorse XFe Extracellular Flux Analyzer (Agilent). For tissue respiration assays, 1.0 mg adipose tissue were dissected from inguinal WAT depots by using a surgical biopsy instrument (Integra™ Miltex™ Standard Biopsy Punches, Thermo Fisher) and placed into XF24 Islet Capture Microplates and pre-incubated with XF assay media with pH value at 7.4. XF assay medium supplemented with 1 mM sodium pyruvate, 2 mM GlutaMaxTM-I, and 25 mM glucose. Tissue or cells were subjected to a mitochondrial stress test by adding oligomycin (5 μM) followed by carbonyl cyanide 4-(trifluoromethoxy), phenylhydrazone (FCCP, 5 μM), and antimycin (5 μM). For glucose stress assay and ECAR measurement, XF assay medium supplemented only with 2mM GlutaMaxTM-I. Tissue or cells were subjected to a glucose stress test by adding highly concentrated glucose (for tissue, 25 mM; for cells, 10 mM), followed by adding oligomycin (5 μM), carbonyl cyanide 4-(trifluoromethoxy) phenylhydrazone (FCCP, 5 μM), and 2-DG (50 mM).
Temperature recording.
Tissue temperature in the interscapular BAT and the skeletal muscle was recorded using the type T thermocouple probes and recorded by using the TC-2000 Meter (Sable Systems International), according to our protocol3. Core body temperature was monitored using a TH-5 thermometer (Physitemp) by recording the rectal temperature of the mice. For core-body temperature recording experiment in Fig. 5i, both control (Ppargflox/flox) and PpargMyoD KO (Myod-CreERT2;Ppargflox/flox) mice were pre-treated with β-blocker and tamoxifen at room temperature for 5 days and acclimated to 15°C for additional 5 days. Wild-type mice did not receive pre-β-blocker-treatment. Subsequently, all the mice were acutely treated with β-blocker and exposed to 10°C.
Glucose and fatty acid oxidation assays.
Differentiated cells cultured in 6-well plates were incubated with DMEM containing 2% FBS for 2 hr and 4 hr for glucose oxidation assays and fatty acid oxidation assays, respectively. Cells were subsequently incubated with KRB/HEPES buffer that contained 2% BSA and 5 mM glucose in the presence of 0.5 μCi/mL [1-14C] glucose or [1-14C] oleic acid and 1 mM carnitine. After 1 hr incubation at 37°C, 30% hydrogen peroxide (350 μL) was added into each well; then the plates were sealed with wipe smears supplemented with 300 μL 1M benzethonium hydroxide solution. Radioactivity trapped in the wipe smears was determined by a liquid scintillation counter (PerkinElmer).
Glucose uptake assay.
Differentiated immortalized beige adipocytes or cells expressing an empty vector or GABPα were plated in a 6-well plate and incubated in the medium containing 2% FBS for 2 h. Subsequently, the cells were incubated with PBS containing 100 nM insulin, washed in PBS, and incubated with 0.1 mM 2-deoxyglucose and 1 μCi/ml 2-deoxy-D-[3H] glucose for 10 min. After washed in cold PBS, cells were harvested in 1% SDS. [3H] glucose uptake was detected by scintillation counter. Values were normalized by total protein concentrations measured by the bicinchoninic acid (BCA) method.
Metabolic studies.
Twelve-week-old animals (Control, Ppargflox/flox and PpargMyoD KO, Myod-CreERT2;Ppargflox/flox) were chronically pre-treated with β-blocker for 5 days, and then the animals were transferred from room temperature to mild cold at 15°C for additional 5 days. Whole-body energy expenditure (VO2, VCO2), food intake, and locomotor activity (beam break counts) were monitored using the Comprehensive Lab Animal Monitoring System (CLAMS, Columbus Instruments) at 15°C. For glucose tolerance test, mice were pre-treated with β-blocker and mild cold at 15°C, and then the mice were acutely treated β-blocker. After 6-hours fasting, the mice were injected intraperitoneally with glucose (2.0 g/kg). Blood samples were collected at several time points, and glucose levels were measured using blood glucose test strips (Abbott).
Electromyography (EMG).
To perform electromyography, twenty nine-gauge needle electrodes were placed close to the back muscles near the back leg under anesthesia. The recorded signal was processed (low-pass filter, 3 kHz; high-pass filter, 10 Hz; notch filter, 60 Hz) and amplified 1,000 x with Bio Amp (ADInstruments, Colorado Springs, CO). EMG data were collected at a sampling rate of 2 kHz using LabChart 8 Pro Software (ADInstruments). Before the data analysis, the raw signal was converted to root mean square (RMS) activity, which was ultimately analyzed for shivering bursts in 5s windows.
18F-FDG-PET/CT scan.
Following the treatment with β-blocker or vehicle, mice were administered 100 μCi of 18F-FDG via a tail vein injection under 2% isoflurane anesthesia. The micro-PET/CT imaging system was applied to scan the whole mouse at the UCSF PET/CT Imaging Core Facility. Subsequently, mice were euthanized, and their iBAT, inguinal WAT, liver, and skeletal muscle were collected. The radioactivity in the tissues was measured against known activity standards using a gamma-counter (Wizard 3; PerkinElmer) at the UCSF Imaging Facility.
Statistics.
Statistical analyses were performed using GraphPad Prism 5.0 or 7.0 (GraphPad Software, Inc., La Jolla, CA), and Office Excel (Microsoft, Inc.). All the data were represented as mean ± s.e.m. A two-sample unpaired Student’s t-test was used for two-group comparisons. One-way ANOVA followed by Tukey’s test was used for multiple group comparisons, two-way ANOVA followed by Bonferroni’s test was used for seahorse measurement from multiple groups or core body temperature measurement of animals from two groups. P values below 0.05 were considered significant throughout the study.
Data availability.
RNA-sequencing dataset generated in this study are available at ArrayExpress (https://www.ebi.ac.uk/arrayexpress) with the following accession code: E-MTAB-4526 (adipose tissues in β-less mice), E-MTAB-4528 (skeletal muscle in β-less mice), E-MTAB-6392 (MyoD-derived beige fat), E-MTAB-7175 (BAT, WAT, and skeletal muscle), and E-MTAB-6441 (MyoD-derived progenitors), and E-MTAB-7164 (Myoblasts). The data sets in the present study are available from the corresponding author upon request.
Extended Data
Extended Data Fig.1. Animal models with defects in β-AR signaling.
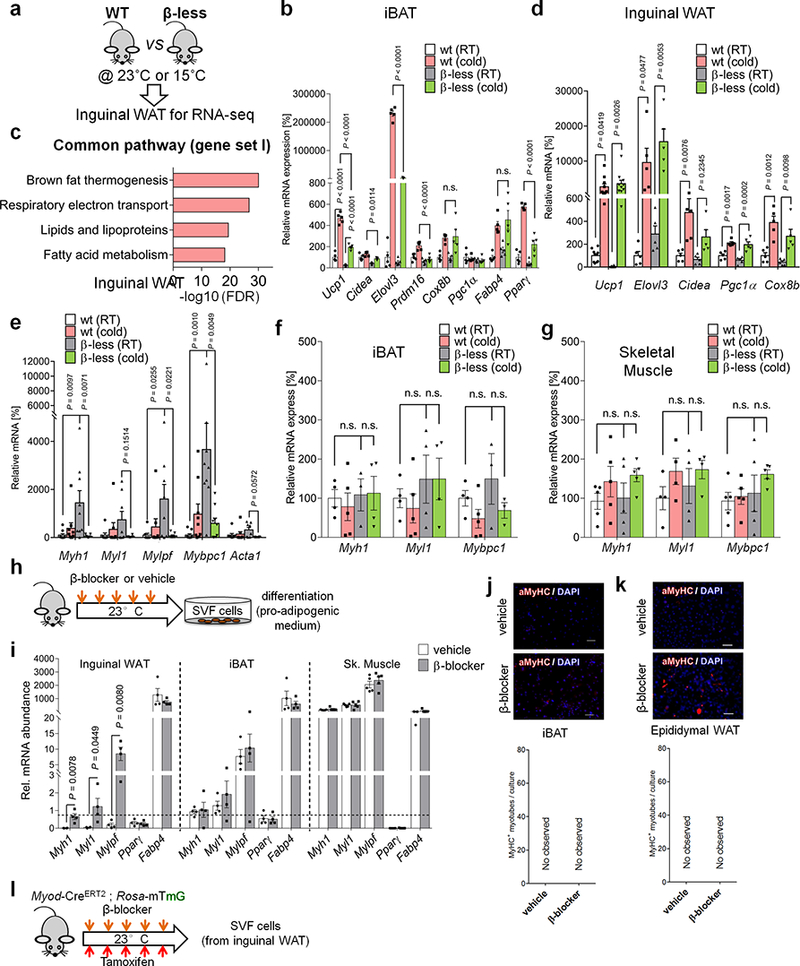
a, Schematic of the experiment. The inguinal WAT from WT and β-less mice at 23°C or 15ºC was harvested and analyzed by RNA-seq. b, mRNA expression of indicated genes in interscapular BAT (iBAT) of mice in Fig. 1a. n.s., not significant. n=5. c, GO analysis of Gene Set I in Fig. 1a. P values (−log10) by delta method–based test. d, mRNA expression of Gene Set I: Ucp1 (n=10); Elovl3 (n=5); Cidea (n=5); Pgc1α (n=5); Cox8b (n=5). e, mRNA expression of skeletal muscle related genes in inguinal WAT. Myh1 (n=9); Myl1 (n=8); Mylpf (n=8); Mybpc1 (n=9); Acta1 (n=8). f, mRNA expression of myogenesis-related genes in the iBAT of mice in (a). n.s., not significant. n=5. g, mRNA expression of indicated genes in the skeletal muscle of mice in (a). n.s., not significant. n=5. h, Schematic of the experiment. WT mice were treated with β-blocker or vehicle (saline) at 23°C for 5 days. i, mRNA expression of indicated genes in inguinal WAT (left), iBAT (middle), and skeletal muscle (right) of mice treated with β-blocker or vehicle. *P < 0.05. n=4. Data are mean ± SEM of biologically independent samples, and analyzed by unpaired two-sided Student’s t-test. j, Immuno-fluorescent staining of MyHC in differentiated SVFs from the iBAT of mice in (h). k, Immuno-fluorescent staining of MyHC in differentiated SVF cells from the epididymal WAT of mice (h). l, Schematic of the experiment. SVFs from β-blocker-treated Myod-CreERT2 reporter mice were cultured. (b,d-g) Data are mean ± SEM of biologically independent samples, and analyzed by one-way ANOVA followed by Tukey’s test. (j,k) DAPI for counter staining. The images represent three independent replicates. Scale bar=50 μm.
Extended Data Fig.2. Myod-derived beige adipocytes in adipose tissue.
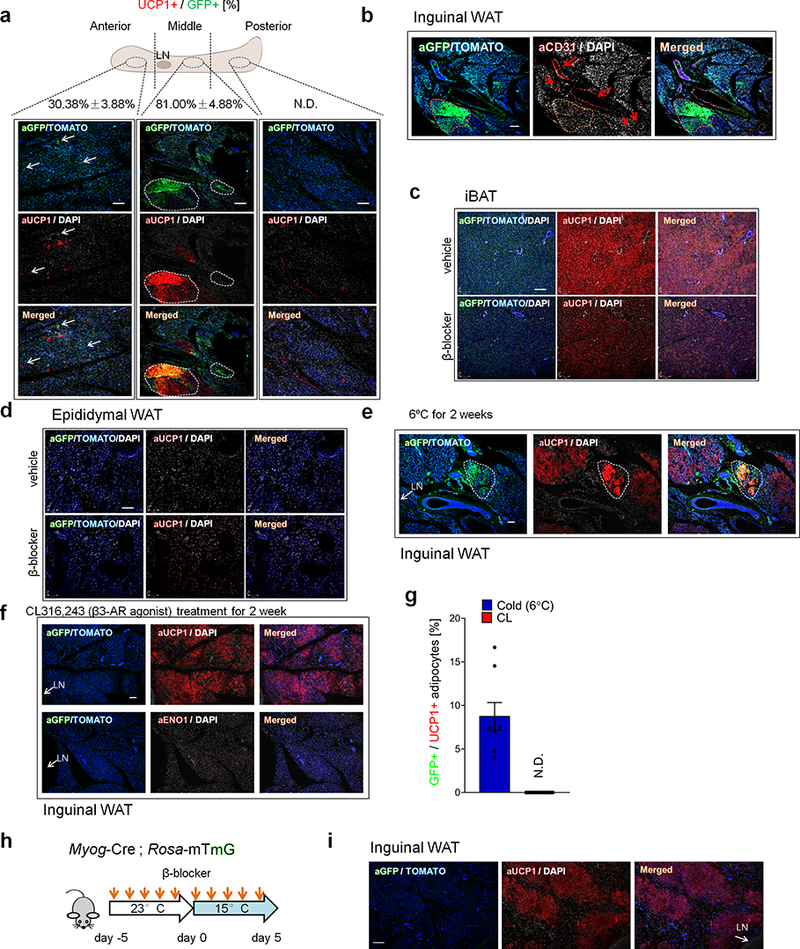
a, Immuno-fluorescent staining of GFP and UCP1 in the anterior, middle, and posterior regions of inguinal WAT of Myod-CreERT2 reporter mice. Mice were pre-treated with β-blocker and acclimated to 15°C. Scale bar=100 μm. Note that GFP+ adipocytes were enriched in the middle part of inguinal WAT near the lymph node (LN). The ratio (%) of UCP1+ cells among total GFP+ cells are shown on the top. N.D., not detected. b, Immuno-fluorescent staining of GFP and CD31 in the middle part of inguinal WAT. Myod-CreERT2 reporter mice treated with β-blocker. Scale bar=100 μm. Note that GFP+ adipocytes are localized near the CD31+ microvasculature. c, Immuno-fluorescent staining of GFP and UCP1 in the iBAT of Myod-CreERT2 reporter mice treated with β-blocker or vehicle. Scale bar=100 μm. d, Immuno-fluorescent staining of GFP and UCP1 in the epididymal WAT of mice in (c). Scale bar=100 μm. e, Immuno-fluorescent staining of GFP and UCP1 in the inguinal WAT of Myod-CreERT2 reporter mice that were acclimated to 6ºC for 2 weeks without β-blocker treatment. Scale bar=100 μm. f, Immuno-fluorescent staining of GFP and UCP1 in the inguinal WAT of Myod-CreERT2 reporter mice treated with CL316,243 (1mg kg−1 day−1) for 2 weeks. Scale bar=100 μm. g, Quantification of GFP+ beige adipocytes among total UCP1+ beige adipocytes in (e) and (f). N.D., not detected. n=8. Data are expressed as mean ± SEM of biologically independent experiments. h, Schematic of the experiment. Myog-Cre;Rosa26-mTmG reporter mice were treated with β-blocker at room temperature for 5 days and subsequently acclimated at 15° C for 5 days. i, Immuno-fluorescent staining of GFP and UCP1 in the inguinal WAT of mice in (h). Scale bar=100 μm. (a-f,i) tdTomato or DAPI for counter-stain. The images represent three independent replicates.
Extended Data Fig.3. Molecular analyses of Myod-derived beige adipocytes.
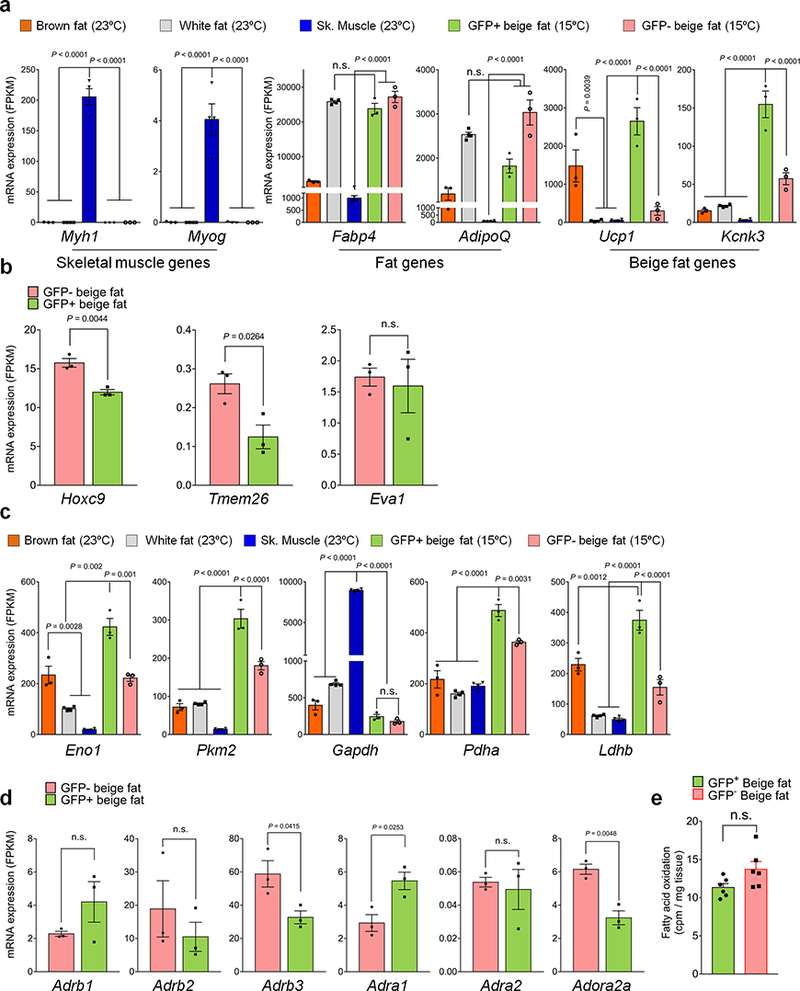
a, mRNA expression (FPKM) of Myh1, Myog, Fabp4, Adiponectin, Ucp1, and Kcnk3 in indicated tissues. n.s., not significant. n=3 biologically independent experiments. Data are mean ± SEM, and analyzed by ANOVA followed by Tukey’s test. b, mRNA expression of beige fat markers in GFP+ and GFP- beige fat from Myod-CreERT2 reporter mice. n.s., not significant. n=3 biologically independent experiments. Data are mean ± SEM, and analyzed by unpaired Student’s t-test. c, mRNA expression of glucose metabolism genes in indicated tissues. n=3 biologically independent samples. Data are mean ± SEM, and analyzed by ANOVA followed by Tukey’s test. d, mRNA expression of adrenergic receptors in GFP+ and GFP- beige fat. n=3 biologically independent samples. Data are mean ± SEM, and analyzed by unpaired two-sided Student’s t-test. e, Fatty acid oxidation in GFP+ and GFP- beige fat. n.s., not significant. n=6 biologically independent samples. Data are mean ± SEM, and analyzed by unpaired two-sided Student’s t-test.
Extended Data Fig.4. MyoD+ progenitors in inguinal WAT.
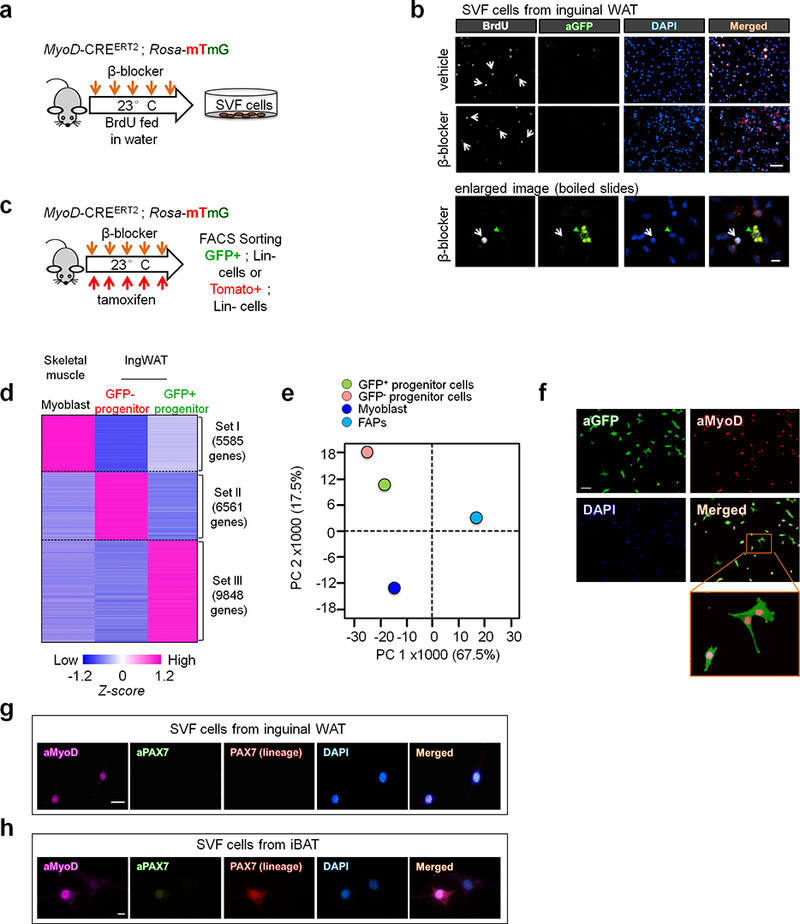
a, Schematic of the experiment. BrdU was administered in Myod-CreERT2 reporter mice during β-blocker treatment. b, Immuno-fluorescent staining of BrdU and GFP in the inguinal WAT-derived SVFs from Myod-CreERT2 reporter mice. Scale bar=50 μm. Enlarged image, scale bar=10 μm. c, Schematic of the experiment. GFP+ and GFP- progenitors were isolated from lineage-negative (Lin-) stromal cells in the inguinal WAT of Myod-CreERT2 reporter mice by FACS. d, Transcriptome analysis in (c). Each type of progenitors was pooled from 3 mice. Cut-off values was P < 0.05 by the delta-method-based hypothesis test. e, PCA of transcriptome dataset from indicated cells. Transcriptome of FAPs (GSE86073) is included in the analysis. f, Immuno-fluorescent staining of MyoD in isolated GFP+ progenitors in (c). Note that all the GFP+ cells express MyoD protein. Scale bar=100 μm. g, Immuno-fluorescent staining of MyoD and PAX7 in the SVFs from the inguinal WAT of Pax7-CreERT2;Rosa26-tdTomato reporter mice. Pax7 lineage cells were marked with Tomato. Scale bar=20 μm. h, Immuno-fluorescent staining of MyoD and PAX7 in the SVFs from iBAT of Pax7-CreERT2; Rosa26-tdTomato reporter mice in (g). Scale bar=10 μm. (b,f-h) DAPI was used as counter-stain. The images represent three independent experiments.
Extended Data Fig.5. Isolation of MyoD+ progenitors from inguinal WAT.
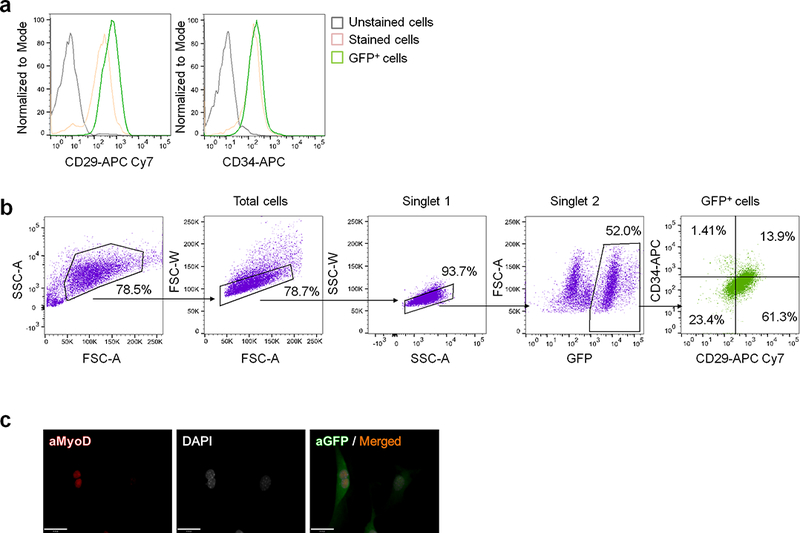
a, Expression of CD29 and CD34 in the SVFs from Pdgfra-CreERT reporter mice. b, Sequential gating to isolate GFP+(PDGFRα+):CD34+:CD29+ cells in the SVFs from the inguinal WAT of Pdgfra-CreERT reporter mice treated with β-blocker. c, Immuno-fluorescent staining of MyoD in GFP+:CD34+:CD29+ cells isolated from the SVFs in (b). DAPI was used as counter-stain. Scale bar=25 μm. (a-c) represent three independent experiments.
Extended Data Fig.6. Developmental regulation of MyoD+ progenitors in the inguinal WAT.
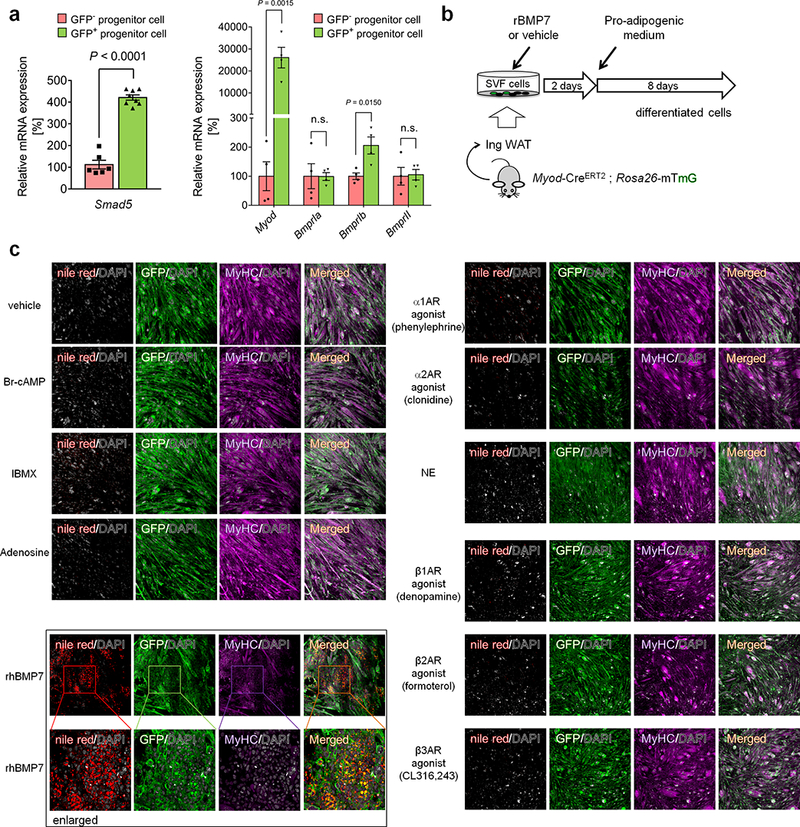
a, mRNA expression of indicated genes in isolated GFP+ and GFP- progenitors from the inguinal WAT of Myod-CreERT2 reporter mice treated with β-blocker. Smad5 (n=6 in GFP- group and n=8 in GFP+ group), Myod, Bmpr1a, Bmpr1b, and Bmpr2 (n=4). Data are mean ± SEM of biologically independent samples, and analyzed by unpaired two-sided Student’s t-test. b, Schematic of the experiment. The inguinal WAT-derived SVF cells from Myod-CreERT2 reporter mice were pre-treated with recombinant BMP7 (rBMP7) or vehicle for 2 days. Cells were subsequently differentiated under pro-adipogenic conditions for 8 days. c, Immuno-fluorescent staining of GFP and lipid droplets stained by Nile red staining in differentiated MyoD+ cells in (b). Cells were treated with indicated compounds, including Br-cAMP (200 μM), IBMX (0.5 μM), Adenosine (100 nM), agonists for α1-AR (phenylephrine, 10 μM), α2-AR (clonidine, 10 μM), β1-AR (denopamine, 10 μM), β2-AR agonist (formoterol, 2.5 μM), β3-AR (CL316,243, 0.1 μM), norepinephrine (1μM), and recombinant human BMP7 (rhBMP7, 3.3 nM), or vehicle control. DAPI was used as counter staining. The images represent three independent experiments. Scale bar=100μm.
Extended Data Fig.7. Transcriptional regulation of g-beige adipocyte differentiation.
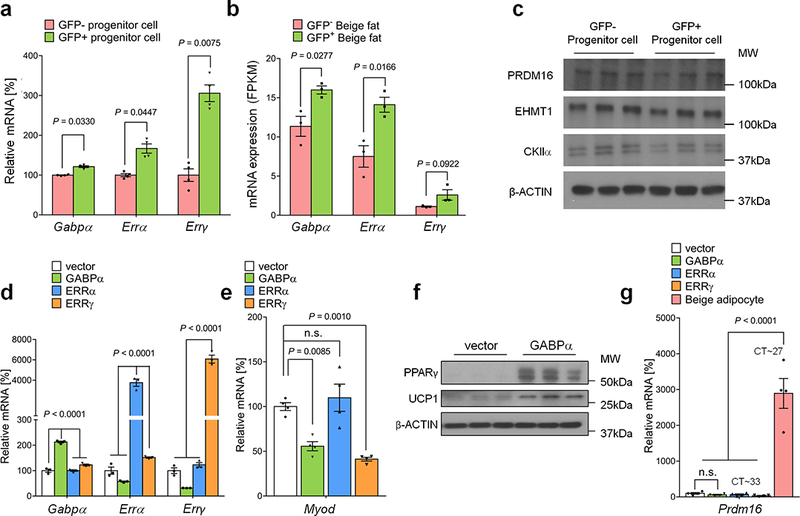
a, mRNA expression of Gabpα, Errα, and Errγ in GFP+ and GFP- progenitors in the inguinal WAT of Myod-CreERT2 reporter mice treated with β-blocker. n=4. b, mRNA expression of indicated genes in GFP+ and GFP- beige fat from Myod-CreERT2 reporter mice. n=3. c, Protein expression of PRDM16, EHMT1, and CKIIα in GFP+ and GFP- progenitors in the inguinal WAT of Myod-CreERT2 reporter mice. β-actin was used as a loading control. Molecular weight (kDa) is shown on the right. d, mRNA expression of indicated genes in C2C12 myoblasts expressing an empty vector, GABPα, ERRα, or ERRγ by lentivirus. n=3. e, mRNA expression of Myod in C2C12 myoblasts expressing an empty vector, GABPα, ERRα, or ERRγ by lentivirus. n.s., not significant. n=4. f, Protein expression of PPARγ and UCP1 in differentiated C2C12 cells expressing an empty vector or GABPα under pro-adipogenic conditions. β-actin was used as a loading control. Molecular weight (kDa) is shown on the right. The blots represent five independent samples. g, mRNA expression of Prdm16 in C2C12 myoblasts expressing an empty vector, GABPα, ERRα, or ERRγ by lentivirus. Differentiated immortalized beige adipocytes are included as a reference. n=4. (a,b) Data are mean ± SEM of biologically independent replicates, and analyzed by unpaired two-sided Student’s t-test. (d,e,g) Data are mean ± SEM of biologically independent replicates, and analyzed by ANOVA followed by Tukey’s test.
Extended Data Fig.8. GABPα controls g-beige fat development.
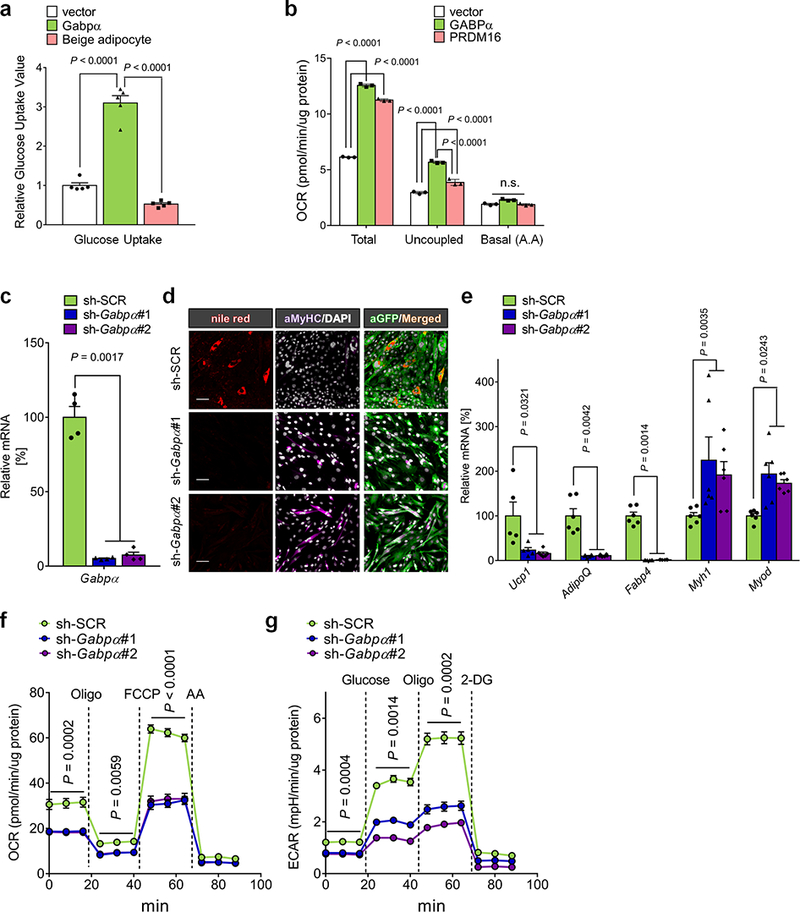
a, Glucose uptake in differentiated cells expressing an empty vector or GABPα, and immortalized beige adipocytes. The values were normalized by total protein concentration. n=5. b, OCR of differentiated C2C12 cells expressing an empty vector, GABPα, or PRDM16. n.s., not significant. n=3. c, mRNA expression of Gabpα in differentiated cells expressing a scramble control (sh-SCR) or shRNAs targeting Gabpα (sh-Gabpα#1 and sh-Gabpα#2). n=4. d, Immuno-fluorescent staining of lipid droplets, MyHC, and GFP in differentiated C2C12 cells expressing sh-SCR or sh-Gabpα. Scale bar=50 μm. DAPI was used as counter staining. The images represent three independent experiments. e, mRNA expression of indicated genes in differentiated cells expressing sh-SCR or sh-Gabpα. Ucp1 (n=5); AdipoQ, Fabp4, Myh1, Myod (n=6). f, OCR in differentiated cells in (c). n=14. g, ECAR in differentiated cells in (c). n=14. (a-c,e) Data are mean ± SEM of biologically independent samples, and analyzed by one-way ANOVA followed by Tukey’s test. (f,g) Data are mean ± SEM of biologically independent samples, and analyzed by two-way ANOVA followed by Bonferroni’s test.
Extended Data Figure 9. A mouse model of g-beige fat depletion.
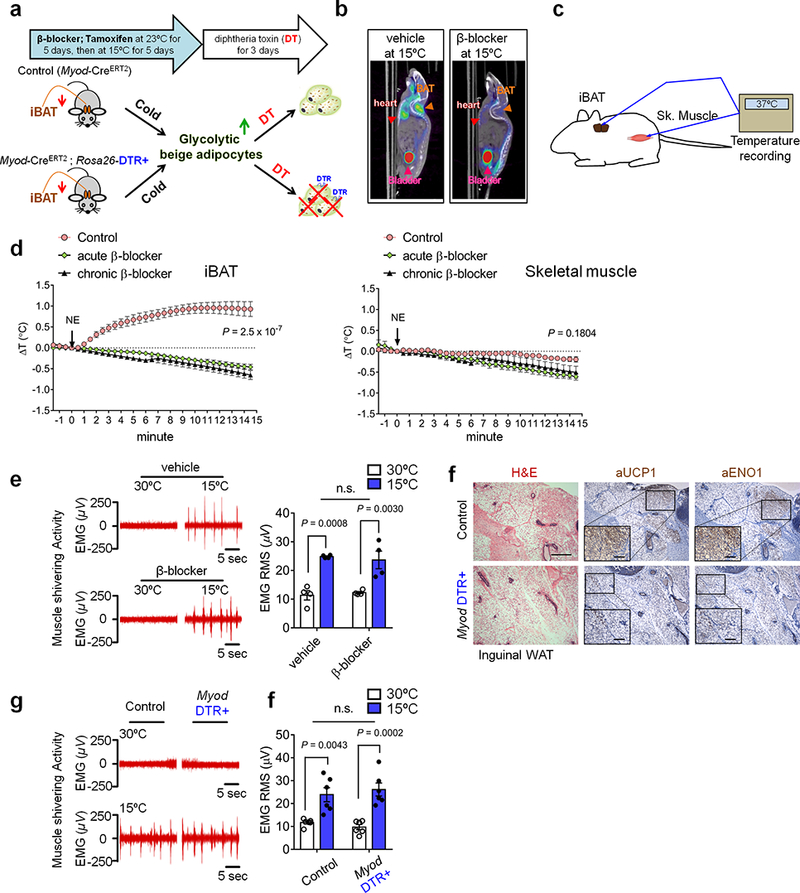
a, Schematic of the experiment. Myod-DTR+ and control mice were pre-treated with β-blocker and tamoxifen, and subsequently acclimated to 15ºC for 5 days. DT was administered to deplete cold-induced Myod-derived g-beige fat. b,18F-FDG PET/CT images of vehicle- or β-blocker-treated mice at 15ºC. c, Schematic of tissue temperature recording in iBAT and skeletal muscle of mice. d, Changes in tissue temperature (ΔT) in iBAT and skeletal muscle. Mice were treated with saline (control) or β-blocker for 5 days (chronic β-blocker). A subset of the saline-treated mice was acutely treated with β-blocker (acute β-blocker). To stimulate thermogenesis, norepinephrine (NE) was administered at the indicated time point (black arrow). n=4 for control, n=6 for acute β-blocker treatment and n=6 for chronic β-blocker treatment. Data are expressed as mean ± SEM of biologically independent mice. P value by two-way ANOVA followed by Bonferroni’s test. e, Electromyography (EMG) measurement of skeletal muscle shivering in wild-type mice treated with β-blocker or vehicle (saline) at 30ºC or 15ºC. The shivering data were converted to the root mean square (RMS, μV). n.s., not significant. n=4 biologically independent mice. Data are expressed as mean ± SEM, and analyzed by ANOVA followed by Tukey’s test. f, H&E staining (left) and immuno-staining of UCP1 (middle) or ENO1 (right) in the inguinal WAT of control and Myod-DTR+ mice. Scale bar=100 μm; enlarged image scale bar=20 μm. The images represent five independent animals. g, EMG measurement of skeletal muscle shivering in control mice and Myod-DTR+ mice at 30ºC or 15ºC. h, Quantification of data in (g) converted to RMS (μV). n.s., not significant. n=6 biologically independent mice. Data are expressed as mean ± SEM, and analyzed by ANOVA followed by Tukey’s test.
Extended Data Fig.10. Requirement of g-beige fat for adaptive thermogenesis in the absence of β-AR signaling.
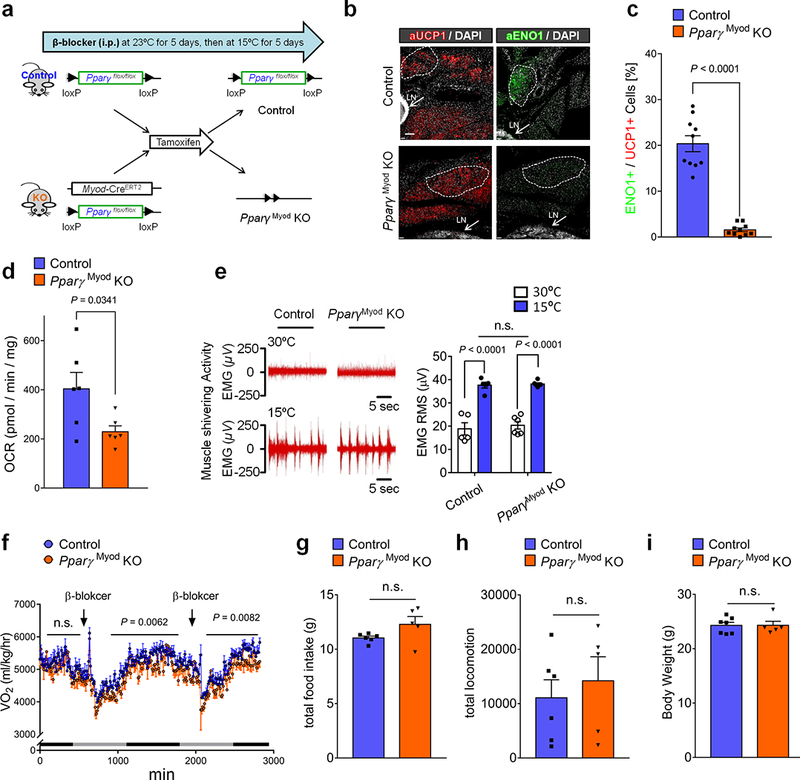
a, Schematic of the experiment. PpargMyoD KO mice (Myod-CreERT2;Ppargflox/flox) and littermate control mice (Ppargflox/flox) were pretreated with β-blocker and tamoxifen. Subsequently, these mice were acclimated to 15°C for 5 days. b, Immuno-fluorescent staining of UCP1 and ENO1 in the inguinal WAT of PpargMyoD KO mice and controls. Scale bar=100 μm. The images represent three independent experiments. c, Quantification of glycolytic beige fat in (b). n=10. d, OCR in the inguinal WAT of PpargMyoD KO mice and littermate controls. n=6. e, EMG measurement of skeletal muscle shivering in PpargMyoD KO (n=6) and littermate control mice (n=5) at 30ºC or 15ºC. The shivering data were converted to RMS (μV). n.s., not significant. Data are mean ± SEM of biologically independent mice, and analyzed by ANOVA followed by Tukey’s test. f, Whole-body oxygen consumption (VO2) in PpargMyoD KO mice and littermate controls. Mice were treated with β-blocker treatment at indicated time points at 15°C. n=5 for PpargMyoD KO mice, n=6 for control. Data are expressed as mean ± SEM of biologically independent mice, and analyzed by two-way ANOVA followed by Bonferroni’s test. g, Total food intake in (f). h, Locomotor activity in (f). i, Body weight of PpargMyoD KO mice and littermate controls on a regular chow diet. Mice were treated with β-blocker and acclimated to 15°C for 5 days. n=5 for PpargMyoD KO mice, n=7 for littermate control mice. (c,d,g-i) Data are mean ± SEM of biologically independent samples, and analyzed by unpaired two-sided Student’s t-test.
Supplementary Material
Acknowledgements
We thank Drs. Y. Seo, S. Haldar, C. Keller for sharing their regents and technical advice. This work was supported by the NIH (DK97441, DK112268, and DK108822) and the Edward Mallinckrodt, Jr. Foundation to S.K., and AR060868 and AR061002 to A.B.
Footnotes
Author information The authors declare no competing interests.
Supplementary Information is available in the online version of the paper.
Reference
- 1.Collins S beta-Adrenoceptor Signaling Networks in Adipocytes for Recruiting Stored Fat and Energy Expenditure. Frontiers in endocrinology 2, 102, doi: 10.3389/fendo.2011.00102 (2011). [DOI] [PMC free article] [PubMed] [Google Scholar]
- 2.Seale P et al. Prdm16 determines the thermogenic program of subcutaneous white adipose tissue in mice. The Journal of clinical investigation 121, 96–105 (2011). [DOI] [PMC free article] [PubMed] [Google Scholar]
- 3.Ikeda K et al. UCP1-independent signaling involving SERCA2b-mediated calcium cycling regulates beige fat thermogenesis and systemic glucose homeostasis. Nature medicine 23, 1454–1465, doi: 10.1038/nm.4429 (2017). [DOI] [PMC free article] [PubMed] [Google Scholar]
- 4.Cohen P et al. Ablation of PRDM16 and Beige Adipose Causes Metabolic Dysfunction and a Subcutaneous to Visceral Fat Switch. Cell 156, 304–316, doi: 10.1016/j.cell.2013.12.021 (2014). [DOI] [PMC free article] [PubMed] [Google Scholar]
- 5.Sharp LZ et al. Human BAT possesses molecular signatures that resemble beige/brite cells. PloS one 7, e49452 (2012). [DOI] [PMC free article] [PubMed] [Google Scholar]
- 6.Wu J et al. Beige adipocytes are a distinct type of thermogenic fat cell in mouse and human. Cell 150, 366–376, doi: 10.1016/j.cell.2012.05.016 (2012). [DOI] [PMC free article] [PubMed] [Google Scholar]
- 7.Lidell ME et al. Evidence for two types of brown adipose tissue in humans. Nature medicine 19, 631–634, doi: 10.1038/nm.3017 (2013). [DOI] [PubMed] [Google Scholar]
- 8.Shinoda K et al. Genetic and functional characterization of clonally derived adult human brown adipocytes. Nature medicine 21, 389–394, doi: 10.1038/nm.3819 (2015). [DOI] [PMC free article] [PubMed] [Google Scholar]
- 9.Yoneshiro T et al. Recruited brown adipose tissue as an antiobesity agent in humans. The Journal of clinical investigation 123, 3404–3408, doi: 10.1172/JCI67803 (2013). [DOI] [PMC free article] [PubMed] [Google Scholar]
- 10.van der Lans AA et al. Cold acclimation recruits human brown fat and increases nonshivering thermogenesis. The Journal of clinical investigation 123, 3395–3403, doi: 10.1172/JCI68993 (2013). [DOI] [PMC free article] [PubMed] [Google Scholar]
- 11.Hanssen MJ et al. Short-term cold acclimation improves insulin sensitivity in patients with type 2 diabetes mellitus. Nature medicine 21, 863–865, doi: 10.1038/nm.3891 (2015). [DOI] [PubMed] [Google Scholar]
- 12.Arch JR Challenges in beta(3)-Adrenoceptor Agonist Drug Development. Ther Adv Endocrinol Metab 2, 59–64, doi: 10.1177/2042018811398517 (2011). [DOI] [PMC free article] [PubMed] [Google Scholar]
- 13.Bachman ES et al. betaAR signaling required for diet-induced thermogenesis and obesity resistance. Science (New York, N.Y 297, 843–845 (2002). [DOI] [PubMed] [Google Scholar]
- 14.Ye L et al. Fat cells directly sense temperature to activate thermogenesis. Proceedings of the National Academy of Sciences of the United States of America 110, 12480–12485, doi: 10.1073/pnas.1310261110 (2013). [DOI] [PMC free article] [PubMed] [Google Scholar]
- 15.Razzoli M et al. Stress-induced activation of brown adipose tissue prevents obesity in conditions of low adaptive thermogenesis. Molecular metabolism 5, 19–33, doi: 10.1016/j.molmet.2015.10.005 (2016). [DOI] [PMC free article] [PubMed] [Google Scholar]
- 16.Sanchez-Gurmaches J & Guertin DA Adipocytes arise from multiple lineages that are heterogeneously and dynamically distributed. Nature communications 5, 4099, doi: 10.1038/ncomms5099 (2014). [DOI] [PMC free article] [PubMed] [Google Scholar]
- 17.Berry DC, Jiang Y & Graff JM Mouse strains to study cold-inducible beige progenitors and beige adipocyte formation and function. Nature communications 7, 10184, doi: 10.1038/ncomms10184 (2016). [DOI] [PMC free article] [PubMed] [Google Scholar]
- 18.Rodeheffer MS, Birsoy K & Friedman JM Identification of white adipocyte progenitor cells in vivo. Cell 135, 240–249 (2008). [DOI] [PubMed] [Google Scholar]
- 19.Tseng YH et al. New role of bone morphogenetic protein 7 in brown adipogenesis and energy expenditure. Nature 454, 1000–1004 (2008). [DOI] [PMC free article] [PubMed] [Google Scholar]
- 20.Heinz S et al. Simple combinations of lineage-determining transcription factors prime cis-regulatory elements required for macrophage and B cell identities. Molecular cell 38, 576–589, doi: 10.1016/j.molcel.2010.05.004 (2010). [DOI] [PMC free article] [PubMed] [Google Scholar]
- 21.Yang ZF, Drumea K, Mott S, Wang J & Rosmarin AG GABP transcription factor (nuclear respiratory factor 2) is required for mitochondrial biogenesis. Molecular and cellular biology 34, 3194–3201, doi: 10.1128/MCB.00492-12 (2014). [DOI] [PMC free article] [PubMed] [Google Scholar]
- 22.Mootha VK et al. Erralpha and Gabpa/b specify PGC-1alpha-dependent oxidative phosphorylation gene expression that is altered in diabetic muscle. Proceedings of the National Academy of Sciences of the United States of America 101, 6570–6575, doi: 10.1073/pnas.0401401101 (2004). [DOI] [PMC free article] [PubMed] [Google Scholar]
- 23.Gantner ML, Hazen BC, Eury E, Brown EL & Kralli A Complementary Roles of Estrogen-Related Receptors in Brown Adipocyte Thermogenic Function. Endocrinology 157, 4770–4781, doi: 10.1210/en.2016-1767 (2016). [DOI] [PMC free article] [PubMed] [Google Scholar]
- 24.Jaworski A, Smith CL & Burden SJ GA-binding protein is dispensable for neuromuscular synapse formation and synapse-specific gene expression. Molecular and cellular biology 27, 5040–5046, doi: 10.1128/MCB.02228-06 (2007). [DOI] [PMC free article] [PubMed] [Google Scholar]
- 25.Lee YH, Petkova AP, Mottillo EP & Granneman JG In vivo identification of bipotential adipocyte progenitors recruited by beta3-adrenoceptor activation and high-fat feeding. Cell metabolism 15, 480–491 (2012). [DOI] [PMC free article] [PubMed] [Google Scholar]
- 26.Vishvanath L et al. Pdgfrbeta+ Mural Preadipocytes Contribute to Adipocyte Hyperplasia Induced by High-Fat-Diet Feeding and Prolonged Cold Exposure in Adult Mice. Cell metabolism 23, 350–359, doi: 10.1016/j.cmet.2015.10.018 (2016). [DOI] [PMC free article] [PubMed] [Google Scholar]
- 27.Long JZ et al. A smooth muscle-like origin for beige adipocytes. Cell metabolism 19, 810–820, doi: 10.1016/j.cmet.2014.03.025 (2014). [DOI] [PMC free article] [PubMed] [Google Scholar]
- 28.Kajimura S, Spiegelman BM & Seale P Brown and Beige Fat: Physiological Roles beyond Heat Generation. Cell metabolism 22, 546–559, doi: 10.1016/j.cmet.2015.09.007 (2015). [DOI] [PMC free article] [PubMed] [Google Scholar]
- 29.Nedergaard J & Cannon B UCP1 mRNA does not produce heat. Biochimica et biophysica acta 1831, 943–949, doi: 10.1016/j.bbalip.2013.01.009 (2013). [DOI] [PubMed] [Google Scholar]
- 30.Kazak L et al. A Creatine-Driven Substrate Cycle Enhances Energy Expenditure and Thermogenesis in Beige Fat. Cell 163, 643–655, doi: 10.1016/j.cell.2015.09.035 (2015). [DOI] [PMC free article] [PubMed] [Google Scholar]
- 31.Hasegawa Y et al. Repression of Adipose Tissue Fibrosis through a PRDM16-GTF2IRD1 Complex Improves Systemic Glucose Homeostasis. Cell metabolism 27, 180–194 e186, doi: 10.1016/j.cmet.2017.12.005 (2018). [DOI] [PMC free article] [PubMed] [Google Scholar]
- 32.Nishijo K et al. Biomarker system for studying muscle, stem cells, and cancer in vivo. FASEB J 23, 2681–2690, doi: 10.1096/fj.08-128116 (2009). [DOI] [PMC free article] [PubMed] [Google Scholar]
- 33.Jung S et al. In vivo depletion of CD11c+ dendritic cells abrogates priming of CD8+ T cells by exogenous cell-associated antigens. Immunity 17, 211–220 (2002). [DOI] [PMC free article] [PubMed] [Google Scholar]
- 34.Buch T et al. A Cre-inducible diphtheria toxin receptor mediates cell lineage ablation after toxin administration. Nature methods 2, 419–426, doi: 10.1038/nmeth762 (2005). [DOI] [PubMed] [Google Scholar]
- 35.Liisberg Aune U, Ruiz L & Kajimura S Isolation and differentiation of stromal vascular cells to beige/brite cells. Journal of visualized experiments : JoVE, doi: 10.3791/50191 (2013). [DOI] [PMC free article] [PubMed] [Google Scholar]
- 36.Ohno H, Shinoda K, Spiegelman BM & Kajimura S PPARgamma agonists Induce a White-to-Brown Fat Conversion through Stabilization of PRDM16 Protein. Cell metabolism 15, 395–404 (2012). [DOI] [PMC free article] [PubMed] [Google Scholar]
- 37.Trapnell C et al. Differential analysis of gene regulation at transcript resolution with RNA-seq. Nature biotechnology 31, 46–53, doi: 10.1038/nbt.2450 (2013). [DOI] [PMC free article] [PubMed] [Google Scholar]
- 38.Tripathi S et al. Meta- and Orthogonal Integration of Influenza “OMICs” Data Defines a Role for UBR4 in Virus Budding. Cell host & microbe 18, 723–735, doi: 10.1016/j.chom.2015.11.002 (2015). [DOI] [PMC free article] [PubMed] [Google Scholar]
Associated Data
This section collects any data citations, data availability statements, or supplementary materials included in this article.
Supplementary Materials
Data Availability Statement
RNA-sequencing dataset generated in this study are available at ArrayExpress (https://www.ebi.ac.uk/arrayexpress) with the following accession code: E-MTAB-4526 (adipose tissues in β-less mice), E-MTAB-4528 (skeletal muscle in β-less mice), E-MTAB-6392 (MyoD-derived beige fat), E-MTAB-7175 (BAT, WAT, and skeletal muscle), and E-MTAB-6441 (MyoD-derived progenitors), and E-MTAB-7164 (Myoblasts). The data sets in the present study are available from the corresponding author upon request.


