Abstract
Silver has been widely used for disinfection. The cellular accumulation of silver ions (Ag+) is critical in these antibacterial effects. The direct cellular measurement of Ag+ is useful for the study of disinfection mechanisms. Herein, we reported a novel genetically encoded RNA-based sensor to image Ag+ in live bacterial cells. The sensor is designed by introducing a cytosine-Ag+-cytosine metallo base pair into a fluorogenic RNA aptamer, Broccoli. The binding of Ag+ induces the folding of Broccoli and activates a fluorescence signal. This sensor can be genetically encoded to measure the cellular flux and antibacterial effect of Ag+.
TOC
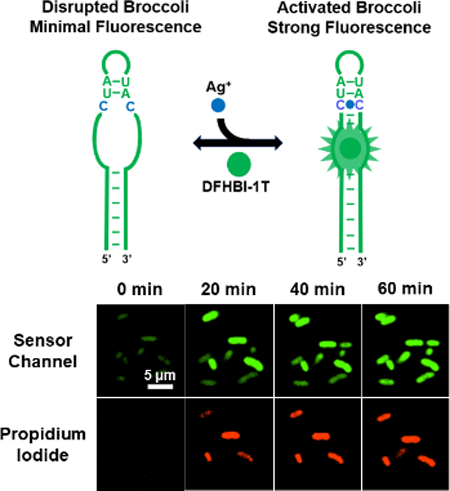
A genetically encoded RNA-based sensor to measure the flux and antibacterial effect of silver ions in living cells.
Graphical Abstract
Silver has been applied for disinfection since the 1st century BC and is still widely used nowadays.1 Compared with antibiotics that can always cause resistant pathogenic strains, silver is promising for the prevention and broad-spectrum treatment of infections.2 Silver nanoparticles (AgNPs) are a popular type of nanomaterial in consumer products, with various applications in medical devices, surgical coating, textiles, dietary supplement, and water disinfection.3 However, concerns have been raised over the toxicity of AgNPs on human health and environment.4,5 It is critical to prepare AgNPs within proper therapeutic windows to improve both antibacterial efficiency and specificity.
The antibacterial effect of AgNPs is known to be largely correlated with the cellular accumulation of Ag+.1,6 Silver ions can interact with the thiol groups in proteins and interfere with DNA replication to stop bacterial proliferation.7 Several strategies have been developed for the in vitro measurement of Ag+ using atomic spectroscopy,8 inductively coupled plasma mass spectrometry,9 potentiometry,10,11 and fluorescence spectroscopy.12-14 However, these in vitro assays cannot be used to measure the cellular concentrations of Ag+. Inside cells, Ag+ can bind with proteins and nucleic acids, form precipitation or colloidal dispersion with halides and sulfides, and be actively pushed out by the efflux pumps.15 Thus, intracellular level of Ag+ could be quite different from that in the extracellular solution.
Herein, we report a genetically encoded RNA-based sensor to selectively image Ag+ in live bacterial cells. Our sensor is developed based on a fluorogenic RNA aptamer, named Broccoli. Broccoli can specifically bind and activate a small molecule dye, (Z)-4-(3,5-difluoro-4-hydroxybbenzylidene)-1,2-dimethyl-1H-imidazol-5(4H)-one (DFHBI-1T).16 Together with Spinach,17 these fluorogenic aptamers have been widely used for RNA imaging in living systems.18 Recently, we and others have engineered Spinach/Broccoli into selective sensors for imaging metabolites19-22 and proteins.23 These RNA-based sensors normally comprise three parts: Spinach/Broccoli, a target-binding aptamer, and a transducer (Fig. S1a, ESI†). The target-binding aptamer is linked via transducer into a structurally critical H1 helix of Broccoli (Fig. S1b, ESI†). The binding of target induces aptamer folding, which further recovers Broccoli to activate the fluorescence of DFHBI-1T.
Here, without introducing the target-binding aptamer or the transducer region, we describe a new fluorogenic RNA sensor platform to detect metal ions. Our sensor is designed based on a specific cytosine-Ag+-cytosine (C-Ag+-C) metallo base pair. C-Ag+-C is structurally similar with the canonical Watson-Crick base pair and adopt a standard A-form RNA conformation.24 We propose that selective Ag+ sensor can be developed by introducing C-C mismatches into the structurally critical H1 helix of Broccoli (Fig. 1a). The DFHBI-1T-binding pocket of Broccoli is formed by a coaxial helical stack of two A-form helices separated by a G-quadruplex.25,26 The formation of an upper H1 helix is required to stabilize the DFHBI-1T-binding pocket. In the absence of Ag+, C-C mismatches prevent Broccoli from folding and fluorescence. While in the presence of Ag+, the formation of C-Ag+-C enables the refolding of H1 helix and the overall structure of Broccoli, which leads to DFHBI-1T fluorescence for the measurement of Ag+ concentrations.
Fig. 1.
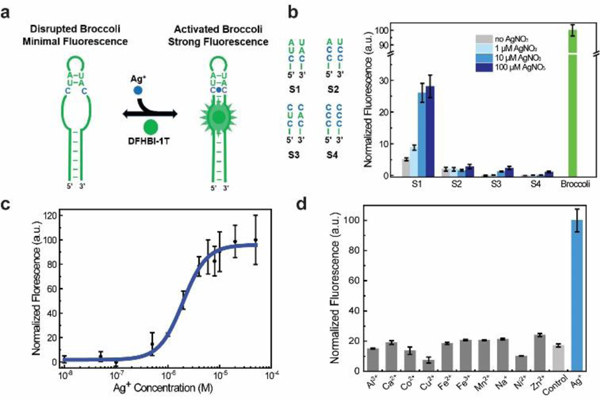
Design and in vitro characterization of RNA-based Ag+ sensors. (a) Schematic illustration of modified Broccoli. The green region indicates sequences from the original Broccoli and C-C mismatch is highlighted in blue. (b) Sequence design of the Ag+-binding H1 helix in S1-S4 (left) and the corresponding fluorescence response at 2 h after adding various amounts of AgNO3 (right). All spectra were measured in a solution containing 1 μM RNA and 20 μM DFHBI-1T. (c) Dose response curve of the S1 sensor. (d) Selectivity of S1 against different ions. All the ions were tested at 10 μM in a solution containing 1 μM S1, 20 μM DFHBI-1T, 100 mM K+ and 1 mM Mg2+ at pH 7.5. Control was measured in this solution without adding other cations. Shown are the mean and S.E.M. values from three independent replicates.
To test this idea, we first used a NUPACK software to predict the RNA folding after replacing 1-3 base pairs in the H1 helix of Broccoli with C-C mismatches. Interestingly, by replacing only one A-U base pair with C-C, the overall secondary structure of Broccoli was dramatically disrupted (Fig. S2, ESI†). Guided by these simulation results, we designed four Ag+ sensors, S1 to S4, which are different from each other in the number and position of C-C mismatches in the H1 helix (Fig. 1b).
We next tested the in vitro performance of these sensors. The fluorescence spectrum of S1-S4 was collected with a mixture of 20 μM DFHBI-1T and 1 μM RNA after in vitro transcription (Fig. 1b). An optimal Ag+ sensor was obtained using S1 RNA, with a 4.9-fold fluorescence increase upon adding 100 μM AgNO3. There is only a single C-C mismatch in S1, which is adjacent to the DFHBI-1T-binding pocket of Broccoli. A 3.7-fold increase in fluorescence was observed with S3 under this condition. However, considering the overall low fluorescence intensity of S3, we chose to use S1 for further studies.
To examine if S1 can be used to detect Ag+ within its antibacterial concentration range (1-20 μM),1 a dose-response curve was measured after adding various amounts of Ag+ (Fig. 1c). Indeed, S1 can be potentially useful by detecting Ag+ levels within the antibacterial therapeutic window, with 10% fluorescence shown after adding 610 nM Ag+ and 90% signal with 6.2 μM Ag+. Half-maximal fluorescence was reached in the presence of 2.0 μM Ag+. This detection range is not influenced by the concentration of DFHBI-1T, while the increase of S1 concentration from 1 μM to 10 μM shifts the half-maximal fluorescence to 4.6 μM Ag+ (Fig. S3, ESI†). As a control, the Broccoli fluorescence will not be influenced by adding Ag+ (Fig. S4, ESI†). The moderate detection range of S1 can be potentially used to measure Ag+ levels at which antibacterial effects exhibit.
We next asked if S1 can selectively recognize only Ag+. Here, the Ag+ selectivity stems from the unique C-Ag+-C metallo base pair. Other cations will not bind in between two cytosines and/or maintain a standard A-form RNA conformation. Indeed, our results indicates that none of Al3+, Ca2+, Co2+, Cu2+, Fe2+, Fe3+, Mn2+, Na+, Ni2+ or Zn2+ could enhance the fluorescence signal of S1 (Fig. 1d). In addition, most of these ions, except Cu2+ and Ni2+, when added together with Ag+, will not influence the fluorescence detection of Ag+ (Fig. S5, ESI†). While at the low nanomolar physiological level,27 Cu2+ and Ni2+ will not influence the S1 performance. It is worth to mention that Mg2+ and K+ are essential for Broccoli folding and fluorescence activation. Both ions are used at a constant physiological concentration in these tests. Overall, S1 can detect Ag+ with good selectivity.
We next cloned S1 into a pET28c vector and transformed it into a BL21 (DE3)* E. coli for live cell imaging of Ag+. Cellular fluorescence was first measured at 2 h after the addition of various concentrations of AgNO3 (1-100 μM). Indeed, Ag+-dependent cellular fluorescence was clearly observed (Fig. 2a and Fig. S6, ESI†). After analyzing the fluorescence intensity of 450 individual E. coli cells, our data indicated that on average a 2.2-fold, 3.8-fold, and 7.1-fold fluorescence increase was observed after adding 10, 20, and 100 μM AgNO3, respectively (Fig. 2b). Interestingly, there is a substantial difference between the in vitro (0.61-6.2 μM) and intracellular (6.8-127 μM) dynamic range of S1 (Fig. 2c), in addition to the effect of cellular environment on S1 properties, it also indicates that the cellular free Ag+ level may be indeed much lower than that in the extracellular solution.
Fig. 2.
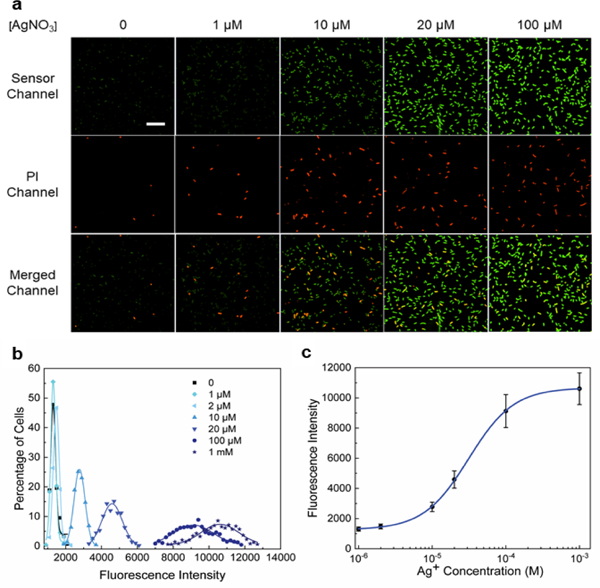
Imaging of Ag+ in live E. coli cells. (a) Confocal fluorescence imaging of S1 sensor-expressing BL21 (DE3)* cells after 2 h incubation with 0-100 μM AgNO3. The S1 sensor channel (green), propidium iodide channel (red) and merged images are shown. Scale bar: 20 μm. (b) Cellular distribution of Ag+ as indicated from S1 fluorescence intensities. Each individual cell was binned according to the brightness. The percentage of cells in each bin was plotted and fitted with Gaussian distribution curves. A total of 450 cells were measured in each case from three experimental replicates. (c) Cellular dose response curve of the S1 sensor based on the mean and S.E.M. fluorescence intensities from the Gaussian fitting.
Our next goal is to study the correlations between the cellular Ag+ levels and their antibacterial efficiencies. Antibacterial efficiency can be measured based on the viability of bacterial cells after various silver treatment, as indicated by the propidium iodide (PI) staining. PI has been widely used for staining the dying/dead cells, which exhibit significantly increased membrane permeability.28 By imaging cellular Ag+ levels (S1 channel) and cell viability (PI channel) simultaneously, our results indicated that the vast majority of the dying/dead cells indeed also contained relatively high levels of Ag+ (Fig. 2a). The percentage of PI-stained cells increased from 2.3% in the absence of Ag+ to 6.0%, 14.4%, and 17.4% after 2 h incubation with 1, 10, and 100 μM AgNO3, respectively. This result is consistent with previously identified antibacterial Ag+ concentrations of 1-20 μM.1 The overall low percentage of PI-stained cells may be due to the relatively short incubation time. There is indeed a direct correlation between Ag+ concentrations and their antibacterial efficiency (Fig. 4b).
Fig. 4.
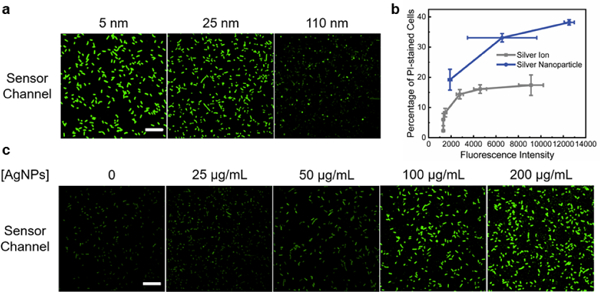
Cellular Ag+ accumulation from silver nanoparticles. (a) Confocal microscopy imaging of S1 sensor-expressing cells at 2 h after adding 200 μg/mL of 5, 25, and 110 nm PVP-AgNPs. (b) The correlation between S1 fluorescence and percentage of PI-stained cells after adding AgNO3 (grey line) or 200 μg/mL AgNPs of various sizes (blue line). Shown are the mean and S.E.M. fluorescence. (c) S1 sensor fluorescence imaged at 2 h after adding different concentrations of 25 nm PVP-AgNPs. Scale bar: 20 μm.
We also wondered if it is possible to monitor the dynamic variations of cellular Ag+ levels using S1. After adding 100 μM AgNO3, the cellular fluorescence was imaged every 10 min over 1 h. About 2/3 of cells started to light up within 30 min, and most majority of cells displayed stable bright fluorescence after 1 h (Fig. 3a and Fig. S7, ESI†). 14.6% of cells exhibited high cellular Ag+ levels with fast response, i.e., emitted more than 80% S1 fluorescence within 30 min. 44.6% and 40.8% of cells displayed moderate and slow response, respectively. There are some cell-to-cell variations in the accumulation rate of Ag+.
Fig. 3.
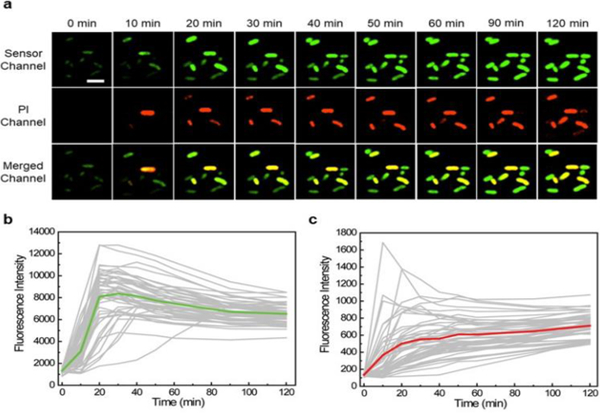
Monitoring Ag+ accumulation and cell viability changes. (a) Confocal microscopy images of live BL21 (DE3)* cells at different time points after adding 100 μM AgNO3. Scale bar: 5 μm. (b) Tracking of the S1 fluorescence from 50 individual cells that exhibited high PI signal at 2 h. The fluorescence of each cell was plotted in a gray line. The averaged signal of these 50 cells was plotted in green. (c) Tracking of the PI fluorescence from the same 50 cells. The PI signal of each individual cell was plotted in a gray line. The averaged signal of 50 cells was plotted in red.
We further tracked the fluorescence signal of 50 individual cells with high PI signals (Fig. 3b). Interestingly, the maximum S1 fluorescence of these cells was observed after 20-30 min, with continually fluorescence decrease after 30 min. To study if this reduced signal was due to the cellular degradation of RNAs, we measured the time-dependent cellular fluorescence of Broccoli. The Broccoli fluorescence remained constant during the 2 h imaging time (Fig. S9, ESI†). Thus, the decreased S1 fluorescence after 30 min may be explained by the reduced free Ag+ levels, due to their binding with cellular proteins/nucleic acids or removal through membrane efflux pumps. While indeed, S1 can be used to monitor the cellular dynamics of Ag+.
In the above-mentioned kinetic measurement, we have also simultaneously monitored the changes in cell viability via PI staining (Fig. 3a and Fig. S7, ESI†). PI signal continuously increased over the 2 h detection period. The large majority of PI-stained cells (95%) at 2 h also exhibited high S1 fluorescence before 30 min. The same experiment was also tested with 10 μM AgNO3. Indeed, a lower S1 fluorescence but similar correlation with the PI signal was observed (Fig. S10, ESI†).
We have further examined the kinetics of both S1 and PI channels at the single-cell level (Fig. 3b, 3c and Fig. S11, ESI†). Within the 50 cells we analysed, 30 cells exhibited PI signal at least 10 min later than that of S1. The rest 20 cells exhibited both green and red fluorescence almost at the same time. Considering the fast PI staining kinetics once cell membrane is permeable, together with the relatively slower kinetics of S1 response (Fig. S12, ESI†), these results suggested a ~10-20 min delay time for Ag+ to disrupt the E. coli membrane permeability. This knowledge can be potentially useful in studying the mechanism of Ag+-induced antibacterial effects.
As a first step in understanding the antibacterial mechanisms of silver nanoparticles, we next applied S1 to study the cellular Ag+ accumulation after its release from AgNPs. It is known that the particle size and concentration play critical roles in the antibacterial efficiency of AgNPs.29 First, to study the effect of particle size on the cellular Ag+ levels, polyvinylpyrrolidone-coated AgNPs (PVP-AgNPs) with diameters of 5, 25, and 110 nm were incubated at 200 μg/mL concentration with S1-expressing BL21 (DE3)* cells. This concentration is chosen based on the reported 30-180 μg/mL minimum bactericidal concentration of AgNPs for E. coli stains.29 As expected from the large surface-area-to-volume ratio of small nanoparticles, 5 nm AgNPs induced the highest S1 sensor fluorescence, followed by 25 nm AgNPs (Fig. 4a and Fig. S13, ESI†). Using the above-mentioned AgNO3 solution as a reference, a cellular Ag+ level equivalent to >1 mM, 35.5 μM, and 5.1 μM AgNO3 was observed after adding these 5, 25, and 110 nm PVP-AgNPs, respectively (Fig. S14, ESI†).
Lastly, we asked if the amount of cellular Ag+ accumulation is directly correlated with the antibacterial effect of AgNPs. As shown with the PI staining, all three sizes of PVP-AgNPs exhibited larger percentage of PI-stained cells (~2.0-fold) than corresponding AgNO3 of the same S1 fluorescence (Fig. 4b). This result indicated that the cellular release of Ag+ may count for ~50% of the antibacterial effect of PVP-AgNPs. Other mechanisms should also make large contributions. We have further studied the effect of AgNP concentrations on the Ag+ release and cell viability. 25-200 μg/mL of 5 nm and 25 nm PVP-AgNPs were incubated with S1-expressing E. coli cells for 2 h. For both sizes of AgNPs, an increasing level of S1 and PI fluorescence was observed as a function of AgNP concentrations (Fig. 4c and Fig. S15, S16, ESI†). Indeed, there is a direct correlation between cellular Ag+ accumulation and the antibacterial effect of AgNPs (Fig. S17 and S18, ESI†).
Ag+ has been widely used for disinfection. However, due to the lack of tools for the direct intracellular measurement of Ag+, the detailed correlation between the Ag+ accumulation and its antibacterial effect is still unclear. In this study, we reported the first Ag+ sensor that can be genetically encoded to image Ag+ levels at the single-cell level. Single cell studies are critical in understanding cell-to-cell variations in the dynamics of Ag+ accumulation and the corresponding antibacterial effects. Small molecule- and DNA-based sensors could be powerful in vitro tools for Ag+ detection. However, their intracellular applications are still hindered by challenges in cell delivery, degradation, and interference with biological functions. In contrast, RNA-based sensors, which can be genetically encoded and transcribed within living systems, hold great potential for the intracellular applications.
Our results indicated that there is a direct correlation between cellular Ag+ level and the antibacterial efficiency of AgNPs. While in addition to the Ag+ release, some other mechanisms can also result in the AgNPs-induced disinfection. We can now directly monitor the accumulations and antibacterial effects of Ag+ in each individual cell. These knowledge are important in improving the specificity and efficiency of silver-based antibacterial consumer products, as well as in studying the mechanism of antibacterial resistance. This new fluorescent RNA sensor is developed based on a specific C-Ag+-C metallo base pair. Similar design principle may be applied for the cellular imaging of several other metal ions.30
Supplementary Material
Acknowledgments
This work is supported by the start-up grant from UMass Amherst, NIH R01AI136789, and NIH T32GM008515. The authors are grateful to Dr. Craig Martin for valuable comments and Dr. James Chambers of IALS Light Microscopy Core for the assistance in fluorescence imaging. The authors also thank other members in the You and Martin lab for useful discussions.
Footnotes
Electronic Supplementary Information (ESI) available. Details of the materials and methods and other figures. See DOI: 10.1039/x0xx00000x
Conflicts of interest
There are no conflicts to declare
Notes and references
- 1.Chernousova S and Epple M, Angew. Chemie Int. Ed., 2013, 52, 1636–1653. [DOI] [PubMed] [Google Scholar]
- 2.Russell AD and Hugo WB, Prog. Med. Chem., 1994, 31, 351–370. [DOI] [PubMed] [Google Scholar]
- 3.Vance ME, Kuiken T, Vejerano EP, McGinnis SP, Hochella MF, Rejeski D, Hull MS and Hull MS, Beilstein J. Nanotechnol, 2015, 6, 1769–80. [DOI] [PMC free article] [PubMed] [Google Scholar]
- 4.Liu W, Wu Y, Wang C, Li HC, Wang T, Liao CY, Cui L, Zhou QF, Yan B and Jiang GB, Nanotoxicology, 2010, 4, 319–330. [DOI] [PubMed] [Google Scholar]
- 5.Yu S, Yin Y and Liu J, Environ. Sci. Process. Impacts, 2013, 15, 78–92. [DOI] [PubMed] [Google Scholar]
- 6.Reidy B, Haase A, Luch A, Dawson KA and Lynch I, Mater. (Basel, Switzerland), 2013, 6, 2295–2350. [DOI] [PMC free article] [PubMed] [Google Scholar]
- 7.Cao H and Liu X, Wiley Interdiscip. Rev. Nanomedicine Nanobiotechnology, 2010, 2, 670–684. [DOI] [PubMed] [Google Scholar]
- 8.Pohl P, TrAC Trends Anal. Chem., 2009, 28, 117–128. [Google Scholar]
- 9.Laborda F, Jiménez-Lamana J, Bolea E and Castillo JR, J. Anal. At. Spectrom., 2011, 26, 1362. [DOI] [PubMed] [Google Scholar]
- 10.Zhou Y, Tang L, Zeng G, Zhu J, Dong H, Zhang Y, Xie X, Wang J and Deng Y, RSC Adv., 2015, 5, 69738–69744. [Google Scholar]
- 11.Saidur MR, Aziz ARA and Basirun WJ, Biosens. Bioelectron., 2017, 90, 125–139. [DOI] [PubMed] [Google Scholar]
- 12.Ono A, Cao S, Togashi H, Tashiro M, Fujimoto T, Machinami T, Oda S, Miyake Y, Okamoto I and Tanaka Y, Chem. Commun, 2008, 0, 4825. [DOI] [PubMed] [Google Scholar]
- 13.Li H, Zhai J and Sun X, Langmuir, 2011, 27, 4305–4308. [DOI] [PubMed] [Google Scholar]
- 14.Bian L, Ji X and Hu W, J. Agric. Food Chem, 2014, 62, 4870–4877. [DOI] [PubMed] [Google Scholar]
- 15.Hobman JL and Crossman LC, J. Med. Microbiol, 2015, 64, 471–497. [DOI] [PubMed] [Google Scholar]
- 16.Filonov GS, Moon JD, Svensen N and Jaffrey SR, J. Am. Chem. Soc, 2014, 136, 16299–16308. [DOI] [PMC free article] [PubMed] [Google Scholar]
- 17.Paige JS, Wu KY and Jaffrey SR, Science, 2011, 333, 642–646. [DOI] [PMC free article] [PubMed] [Google Scholar]
- 18.Karunanayake Mudiyanselage APKK, Yu Q, Leon-Duque MA, Zhao B, Wu R and You M, J. Am. Chem. Soc, 2018, 140, 8739–8745. [DOI] [PMC free article] [PubMed] [Google Scholar]
- 19.You M, Litke JL and Jaffrey SR, Proc. Natl. Acad. Sci. U. S. A, 2015, 112, E2756–65. [DOI] [PMC free article] [PubMed] [Google Scholar]
- 20.Paige JS, Nguyen-Duc T, Song W and Jaffrey SR, Science, 2012, 335, 1194–1194. [DOI] [PMC free article] [PubMed] [Google Scholar]
- 21.Kellenberger CA, Wilson SC, Sales-Lee J and Hammond MC, J. Am. Chem. Soc, 2013, 135, 4906–4909. [DOI] [PMC free article] [PubMed] [Google Scholar]
- 22.Sharma S, Zaveri A, Visweswariah SS and Krishnan Y, Small, 2014, 10, 4276–4280. [DOI] [PubMed] [Google Scholar]
- 23.Song W, Strack RL and Jaffrey SR, Nat. Methods, 2013, 10, 873–875. [DOI] [PMC free article] [PubMed] [Google Scholar]
- 24.Kondo J, Tada Y, Dairaku T, Saneyoshi H, Okamoto I, Tanaka Y and Ono A, Angew. Chemie Int. Ed, 2015, 54, 13323–13326. [DOI] [PubMed] [Google Scholar]
- 25.Warner KD, Chen MC, Song W, Strack RL, Thorn A, Jaffrey SR and Ferré-D’Amaré AR, Nat. Struct. Mol. Biol, 2014, 21, 658–663. [DOI] [PMC free article] [PubMed] [Google Scholar]
- 26.Huang H, Suslov NB, Li N-S, Shelke SA, Evans ME, Koldobskaya Y, Rice PA and Piccirilli JA, Nat. Chem. Biol, 2014, 10, 686–691. [DOI] [PMC free article] [PubMed] [Google Scholar]
- 27.Ladomersky E and Petris MJ, Metallomics, 2015, 7, 957–64. [DOI] [PMC free article] [PubMed] [Google Scholar]
- 28.Riccardi C and Nicoletti I, Nat. Protoc, 2006, 1, 1458–1461. [DOI] [PubMed] [Google Scholar]
- 29.Agnihotri S, Mukherji S and Mukherji S, RSC Adv, 2014, 4, 3974–3983. [Google Scholar]
- 30.Takezawa Y and Shionoya M, Acc. Chem. Res, 2012, 45, 2066–2076. [DOI] [PubMed] [Google Scholar]
Associated Data
This section collects any data citations, data availability statements, or supplementary materials included in this article.


