

Abstract
Junctional membrane complexes facilitate excitation-contraction coupling in skeletal and cardiac muscle cells by forming subcellular invaginations that maintain close (≤20 nm) proximity of ryanodine receptors (RyRs) on the sarcoplasmic reticulum (SR) with voltage-dependent Ca2+ channels in the plasma membrane. In fully differentiated smooth muscle cells, junctional membrane complexes occur as distributed sites of peripheral coupling. We investigated the role of the cytoskeleton in maintaining peripheral coupling and associated Ca2+ signaling networks within native smooth muscle cells of mouse and rat cerebral arteries. Using live-cell confocal and superresolution microscopy, we found that the tight interactions between the SR and the plasma membrane in these cells relied on arching microtubule structures present at the periphery of smooth muscle cells and were independent of the actin cytoskeleton. Loss of peripheral coupling associated with microtubule depolymerization altered the spatiotemporal properties of localized Ca2+ sparks generated by the release of Ca2+ through type 2 RyRs (RyR2s) on the SR and decreased the number of sites of colocalization between RyR2s and large-conductance Ca2+-activated K+ (BK) channels. The reduced BK channel activity associated with the loss of SR-plasma membrane interactions was accompanied by increased pressure–induced constriction of cerebral resistance arteries. We conclude that microtubule structures maintain peripheral coupling in contractile smooth muscle cells, which is crucial for the regulation of contractility and cerebral vascular tone.
INTRODUCTION
Structures that maintain close (≤20 nm) interactions between the plasma membrane and the sarcoplasmic reticulum (SR) within transverse (T) tubules are critically important for the excitability and contractility of skeletal and cardiac muscle (1, 2). The architecture of these extensively characterized junctional membrane complexes (JMCs) is formed by cytoskeletal elements and specialized proteins, including members of the junctophilin (3) and triadin (4, 5) families. In contrast, smooth muscle cells in the walls of the vasculature, gastrointestinal tract, and other organs lack T tubules and the uniform rectilinear structure characteristic of skeletal and cardiac muscle cells and do not have well-defined JMCs. However, electron microscopy studies have shown that regions of the peripheral SR and the plasma membrane of vascular smooth muscle cells are separated by about 20 nm but do not come into physical contact (6). These close interactions between the plasma membrane and SR that occur outside of JMCs are called peripheral coupling sites. Little is currently known about how these sites are formed or maintained in fully differentiated contractile arterial myocytes. Furthermore, although defects in JMC structure are associated with skeletal and cardiac muscle disease, it is not known whether impaired peripheral coupling contributes to smooth muscle dysfunction. Accordingly, we sought to identify structural components of peripheral coupling sites in vascular smooth muscle cells and elucidate how these elements affect regulation of the contractility of cerebral resistance arteries, with a focus on the role of the cytoskeleton in these processes.
Force development in vascular smooth muscle is independent of action potentials and is primarily governed by graded changes in resting membrane potential (7). Membrane depolarization stimulates Ca2+ influx through voltage-gated CaV1.2 channels, causing vasoconstriction (7), whereas activation of outward (hyperpolarizing) K+ currents has the opposite effect (8). Resting vascular tone reflects a balance of these two processes. In smooth muscle cells from cerebral arteries, large-conductance Ca2+-activated K+ (BK) channels provide a major hyper-polarizing influence (9) that acts as a negative feedback mechanism opposing pressure-induced membrane depolarization and myocyte contraction (10). Under physiological conditions, the activity of plasma membrane–localized BK channels is stimulated by transient high-amplitude Ca2+ signals known as Ca2+ sparks that reflect the release of Ca2+ ions from the SR through type 2 ryanodine receptors (RyR2s) (9, 11, 12). Ca2+ sparks are generated within defined subcellular microdomains that compartmentalize Ca2+ ions and dictate the spatial spread and kinetics of these signals (13, 14). Juxtaposition of RyR2s and BK channels is obligatory for functional coupling of these two elements (15). We propose that peripheral coupling sites maintain these properties, which are critical for regulation of contraction.
Using a combination of live-cell confocal and superresolution microscopy, high-speed, high-resolution Ca2+ imaging, patch-clamp electrophysiology, and cerebral resistance artery pressure myography, we describe the architecture and functional relevance of peripheral coupling in contractile vascular myocytes acutely isolated from cerebral resistance arteries. Our findings indicated that a dense network of arching microtubule structures at the outer edges of smooth muscle cells provided underlying support for the peripheral SR and was necessary for the formation of close contacts between the SR and the plasma membrane. We also determined that these contact sites defined the duration and spatial spread of Ca2+ sparks and maintained spatial proximity and functional coupling between RyR2s on the SR and BK channels in the plasma membrane. Notably, disruption of close interactions between the SR and the plasma membrane impaired endogenous BK channel activity and autoregulation of cerebral artery tone. Together, our findings demonstrate a previously unrecognized role for arching microtubule structures in the formation of peripheral coupling sites that are critical for the function of Ca2+ signaling pathways that are involved in regulating the excitability and contractility of arterial myocytes and important autoregulatory functions of the cerebral vasculature.
RESULTS
Microtubules maintain proximity of the peripheral SR and the plasma membrane in contractile smooth muscle cells
We initially sought to identify regions of peripheral coupling in contractile smooth muscle cells using confocal imaging and to develop an analysis method that enabled semiquantitative estimates of the distance between the SR and the plasma membrane in live cells. To accomplish this, we costained cerebral myocytes with SR- and plasma membrane–specific dyes (16) and generated cross-sectional images of z-stack reconstructions. These images revealed areas where small projections of the peripheral SR membrane radiated outward (relative to the nucleus) to form circumscribing plate-like structures proximal to the plasma membrane (Fig. 1A). We defined these structures as sites of peripheral coupling between the two membranes. To establish a measure of the relative separation distance between the two membranes, we constructed intensity profiles by plotting changes in fluorescence along 10 evenly spaced line segments drawn perpendicular to the long axis of the cell, generating a series of peaks corresponding to label density (fig. S1). The relative location of the plasma membrane juxtaposed to the peripheral SR could be visualized as distinct fluorescence peaks in intensity profiles (fig. S1). To estimate the relative distance between the peripheral SR and the plasma membrane, we measured the peak-to-peak distance between the SR and the plasma membrane of all line segments and plotted the distribution as a histogram (fig. S1). Using these procedures, we determined that the mean separation distance under these conditions was 4.4 ± 0.2 pixels.
Fig. 1. Intact microtubules maintain close proximity of the peripheral SR and the plasma membrane.
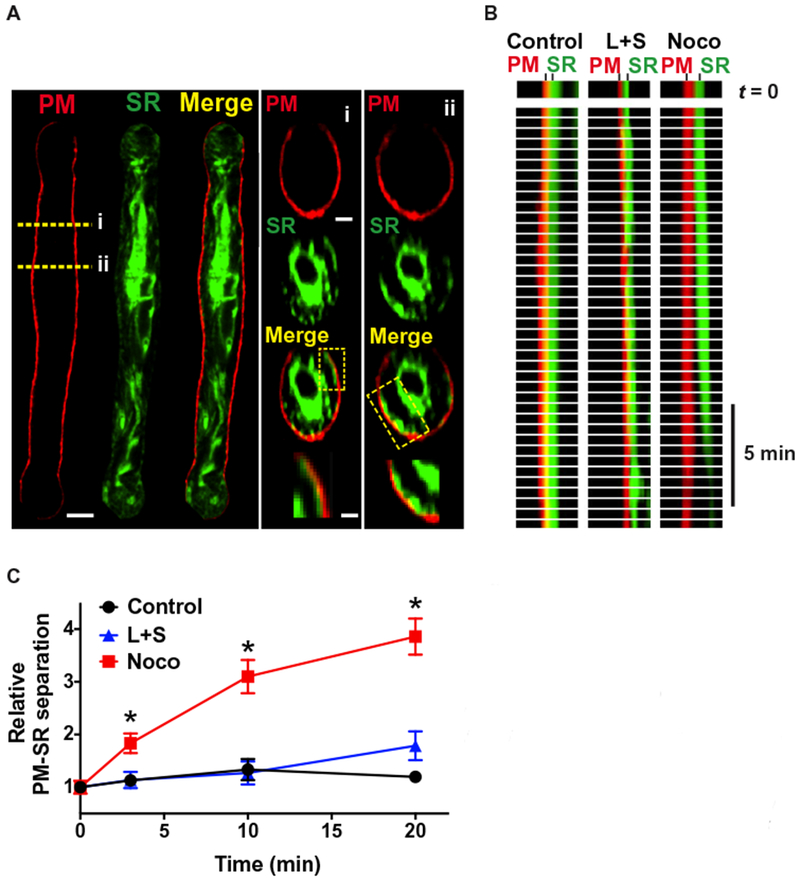
(A) Representative image of an isolated smooth muscle cell loaded with ER-Tracker (green) to stain the SR membrane, a cell loaded with CellMask Deep Red (red) to stain the plasma membrane (PM), and a merged image (yellow). Scale bar, 5 μm. Right: Cross-section (i and ii) images of SR (green) and plasma membrane (red) staining. Scale bar, 1 μm (middle). The regions of interest (ROIs) (box) show putative peripheral coupling sites. Enlarged images are shown below. Scale bar, 0.3 μm (bottom). (B) Line scan images showing plasma membrane–SR separation distance as a function of time in untreated control cells (n = 7 cells, n = 3 animals), cells treated with swinholide A and latrunculin B (L+S) to depolymerize actin (n = 6 cells, n = 3 animals), and cells treated with nocodazole (Noco) to depolymerize microtubules (n = 7 cells, n = 3 animals). (C) Summary data showing the relative separation distance between the SR and the plasma membrane over time. *P ≤ 0.05 compared to control and L+S.
To determine whether specific elements of the cytoskeleton were necessary to maintain close proximity of the SR and plasma membrane, we evaluated the effects of pharmacological agents that selectively depolymerize actin fibers or microtubules on separation distance. Cells costained for the SR and plasma membrane were continuously imaged after treatment with these agents, and the effects of these treatments on the proximity of the plasma membrane and SR as a function of time were evaluated by line scan analysis (Fig. 1B). The separation distance between the peripheral SR and the plasma membrane was stable for at least 20 min under control conditions and was not significantly affected by depolymerization of actin filaments using a combination of latrunculin B and swinholide A (Fig. 1, B and C). In contrast, the microtubule depolymerizing agent nocodazole significantly increased the separation distance between the peripheral SR and the plasma membrane; after a 3-min incubation, this distance had increased by about twofold and further expanded over time, reaching an about fourfold increase after 20 min (Fig. 1, B and C, and movie S1). These data suggest that intact microtubules are necessary for maintaining close contact between the peripheral SR and the plasma membrane, whereas the actin cytoskeleton is not.
Microtubules underlie the peripheral SR
Our data showed that microtubules were critically important for the formation of peripheral coupling sites. To better understand this process, we attempted to visualize the three-dimensional (3D) structure of these networks in contractile cerebral arterial myocytes. To this end, live cells were loaded with a membrane-permeant fluorescent dye that stabilizes and labels polymerized tubulin (17) and imaged by confocal microscopy. Reconstructed confocal z-stack images revealed a dense tubulin network surrounding the nucleus and showed filaments circumscribing the periphery of the cell (Fig. 2A and movie S2). Individual filaments could be seen emerging away from the nucleus, bending outward to form arch-like structures with apexes arranged in a crosshatched pattern, similar to the intersecting threads on the surface of a ball of yarn (Fig. 2A).
Fig. 2. Arching microtubule structures underlie the peripheral SR.
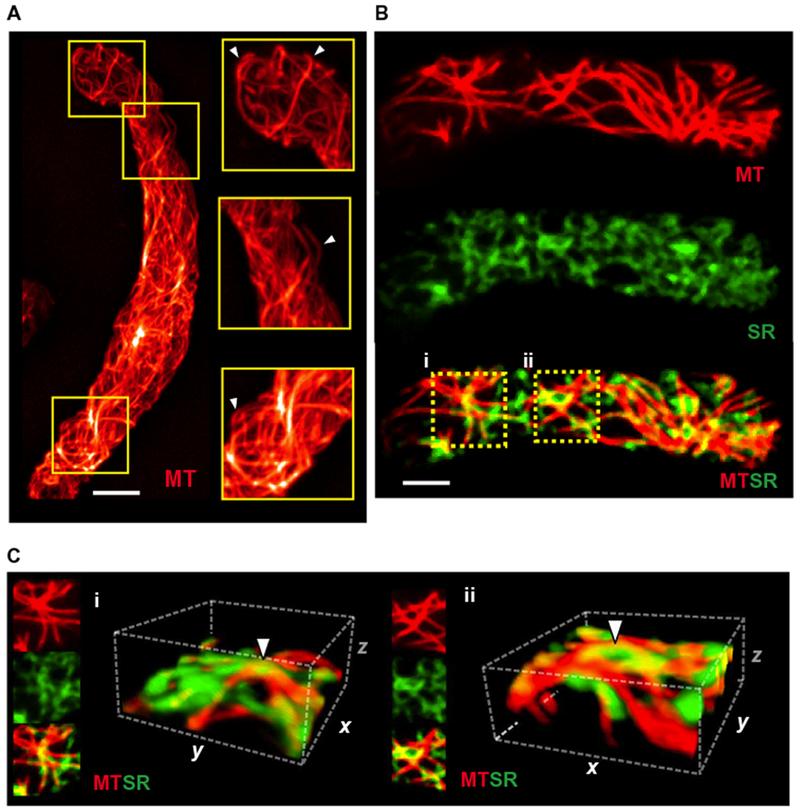
(A) 3D reconstruction of the microtubule (MT) cytoskeleton in an isolated cerebral arterial myocyte loaded with Tubulin Tracker (red) (n = 8 cells, n = 3 animals). Scale bar, 5 μm. Examples of arching microtubule structures are indicated by white arrowheads. (B) Representative compressed z-stack images (0.25 μm per slice) of isolated smooth muscle cells loaded with Tubulin Tracker (red) and ER-Tracker (green) (n = 8 cells, n = 3 animals). Scale bar, 5 μm. (C) A 3D reconstruction analysis was performed on ROIs (i) and (ii) (9.2 μm × 9.2 μm × 4.75 μm). White arrowheads indicate microtubule arches underlying the SR proximal to the plasma membrane.
To investigate the possibility that the arching microtubule structures present at the cell periphery physically interacted with the SR to support the formation of peripheral coupling sites, we costained arterial myocytes for tubulin and SR membranes (using an SR-selective fluorescent dye) (16, 18) and then collected confocal z-stack images throughout the entire width of the cell. When viewed starting from the bottom of the cell in contact with the glass coverslip, these images consistently exhibited isolated patches of the peripheral SR membrane before encountering stained tubulin filaments, suggesting that the SR was positioned on top of the microtubule network (fig. S2, A and B, and movie S3). Compressed z-stack images of the cell bottom revealed considerable areas of overlap (fig. S3) between microtubule and SR staining (Fig. 2B). 3D reconstructions of ROIs in colabeled cells provided further evidence that patches of the peripheral SR membrane sit atop arching microtubule filaments (Fig. 2C), suggesting that these structures provide an underlying support platform that promotes close interactions between the SR and the plasma membrane.
RyR2 clusters associate with microtubules
To develop additional structural insights, we imaged the microtubule network within contractile vascular smooth muscle cells at maximal resolution using superresolution microscopy. Freshly isolated smooth muscle cells were fixed, immunolabeled for α-tubulin, and imaged using a GSDIM (ground state depletion followed by individual molecule return) system (Fig. 3A). Individual tubulin filaments, including arching microtubule structures, were clearly distinguishable at this resolution (Fig. 3A). To gauge interactions between microtubules and functionally important proteins located in the SR, we coimmunolabeled cells for α-tubulin and RyR2s (Fig. 3B). These experiments showed that RyR2s were organized into discrete protein clusters of various sizes (mean, 1843 ± 47 nm2). To establish whether RyR2 channel clusters and tubulin filaments overlapped, we measured the percentage of the area of tubulin immunoreactivity that contained overlapping RyR2 immunoreactivity and vice versa. This analysis showed that 5.3 ± 0.5% (range, 4 to 7%) of tubulin immunoreactivity overlapped with RyR2 immunoreactivity; conversely, the percentage of the RyR2 immunoreactive area that overlapped with tubulin immunoreactivity was 29.7 ± 6.2% (range, 16 to 54%). To determine whether the degree of overlap between RyR2s and tubulin was greater than could be accounted for by chance alone, we randomized the position of each RyR2 cluster within a radius of 285 nm of its real position (creating 1000 random images) and measured the degree of overlap. In all cells, the real overlap was greater than or equal to +1 SD (+1σ) of the randomly positioned overlap distribution; in three of the five cells examined, the real overlap was greater than or equal to +3 SDs (+3σ) (fig. S4). This analysis demonstrates that RyR2 channel clusters overlap with tubulin to a much greater degree than would be predicted by a random distribution.
Fig. 3. RyR2 protein clusters selectively align with microtubules.
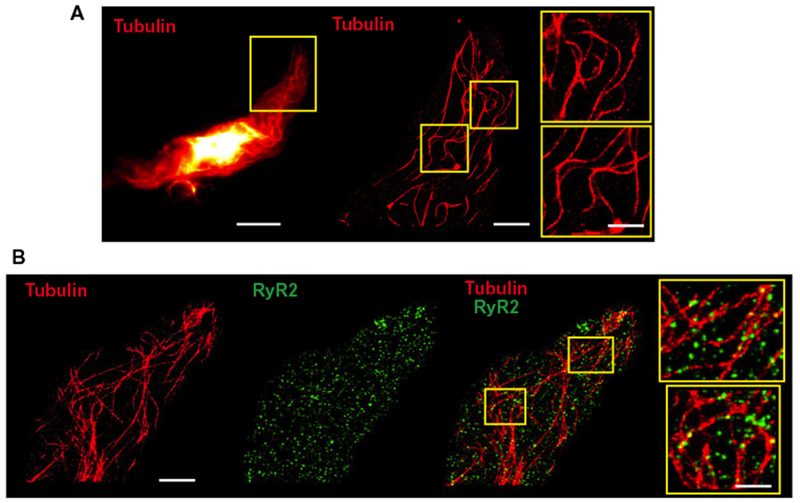
(A) Representative images (offive cells from n = 3 animals) of an isolated native cerebral arterial myocyte immunolabeled with anti-α-tubulin (red). The image on the left is a wide-field image. The ROI in the yellow box was imaged using GSDIM. Scale bar, 10 μm. Center: Superresolution image of the ROI. Scale bar, 3 μm. Magnified views of the indicated ROIs depicting arching microtubule structures are shown on the right. Scale bar, 0.2 μm. (B) Representative superresolution images (of five cells from n = 3 animals) of an isolated native cerebral arterial myocyte immunolabeled with anti-α-tubulin antibody (red), anti-RyR2 antibody (green), and the overlay. Scale bar, 3 μm. ROIs (yellow boxes) are shown at the right. Scale bar, 0.2 μm.
Loss of peripheral coupling alters the spatial and temporal properties of Ca2+ sparks
We then sought to elucidate the functional importance of microtubule-maintained peripheral coupling sites. In cerebral arterial myocytes, release of SR Ca2+ from clusters of RyR2s into tight subcellular spaces immediately below the plasma membrane generates localized high-amplitude Ca2+ sparks, which regulate membrane potential and contractility through activation of juxtaposed BK channels (9). The amplitude, duration, and spatial spread of Ca2+ sparks are determined by the Ca2+ conductance and open time of RyR2s, the concentration gradient of Ca2+ ions between the SR and cytosol, the rate of Ca2+ re-uptake and/or buffering, and the volume of the microdomain formed by the SR and plasma membrane that encloses the signal (9, 19, 20). We predicted that disruptions in peripheral coupling would increase the volume of the Ca2+ spark microdomain and alter the spatial and kinetic properties of these signals. To test this hypothesis, we recorded spontaneous Ca2+ sparks from freshly isolated cerebral arterial myocytes before and after depolymerization of microtubules using nocodazole. Control experiments indicated that nocodazole treatment did not alter the overall SR Ca2+ store load (fig. S5A), and spontaneous Ca2+ spark frequency was not significantly altered by this treatment (fig. S5B). Microtubule depolymerization substantially increased Ca2+ spark event duration, measured as signal half-width (253 ± 21 ms), compared with that observed under control conditions (154 ± 17 ms) (Fig. 4, A and B). This increase in event duration was primarily due to prolonged decay time because rise time was not significantly increased (65 ± 21 ms compared to 81 ± 23 ms) (Fig. 4B). Ca2+ spark amplitude (F/F0) was not changed by microtubule depolymerization (Fig. 4C). However, the spatial spread of Ca2+ sparks was significantly increased after microtubule depolymerization (29.4 ± 3.1 μm2) compared with controls (20.7 ± 3.6 μm2) (Fig. 4D). We propose that increases in the event duration and spatial spread of Ca2+ sparks after depolymerization of microtubules are a consequence of the loss of physical barriers that enclose Ca2+ spark microdomains.
Fig. 4. Depolymerization of microtubules alters the spatial and temporal properties of Ca2+ sparks.
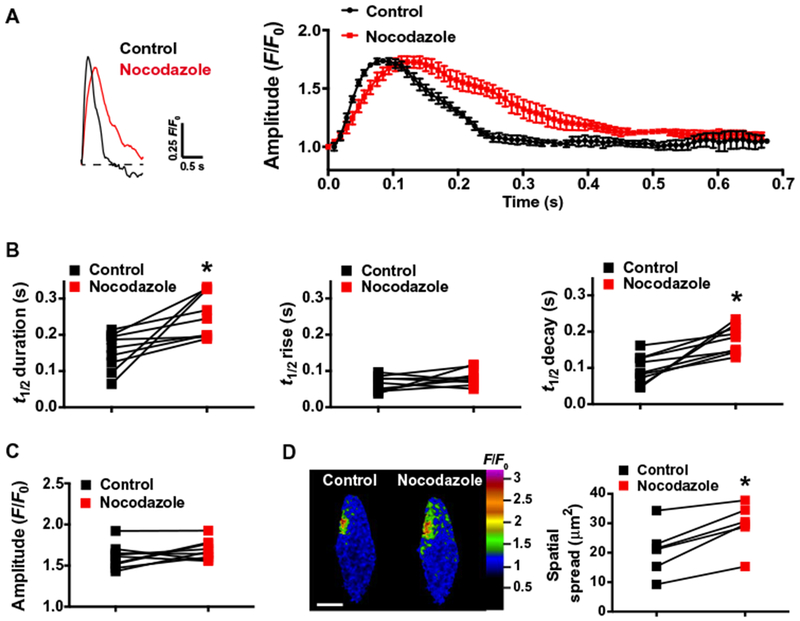
(A) Representative traces of the fractional increase in fluorescence (F/F0) as a function of time recorded from a Ca2+ spark site within a Fluo-4AM–loaded smooth muscle cell before and after treatment with nocodazole (10 μM). The average time course of Ca2+ spark F/F0 before and after treatment with nocodazole is shown on the right (n = 5 events per group, n = 3 animals). (B) Summary data showing event half-duration [half-time (t1/2), s], rise time (t1/2, s), and decay time (t1/2, s) of Ca2+ sparks recorded before and after treatment with nocodazole. *P ≤ 0.05 compared to control (n = 9 cells, n = 3 animals). (C) Summary data showing Ca2+ spark amplitude (F/F0) before and after treatment with nocodazole (n = 9 cells, n = 3 animals). (D) Representative pseudocolored confocal images of Ca2+ sparks occurring at the same site before and after treatment with nocodazole, illustrating increased spread. Scale bar, 10 μm. Summary data showing spatial spread of Ca2+ sparks before and after treatment with nocodazole are presented on the right. *P < 0.05 compared to control (n = 6 cells, n = 3 animals).
Disruption of peripheral coupling impairs selective colocalization of BKα and RyR2
Modeling studies indicate that BK channels in the plasma membrane must be located within ~30 to 40 nm of RyR2s on the SR to be activated by Ca2+ sparks (15). Structures of this size cannot be resolved using confocal microscopy. Therefore, we coimmunolabeled contractile smooth muscle cells for the α (pore-forming) subunit of BK (BKα) and RyR2s and imaged these cells using GSDIM (Fig. 5, A and B). Analyses of the resulting superresolution localization maps indicated that the distribution of these proteins was not homogeneous; instead, BKα and RyR2 are present in clusters with mean areas of 1782 ± 30 and 2219 ± 35 nm2, respectively (Fig. 5C). The densities of these BKα and RyR2 clusters on the cellular surface were 3.1 ± 0.3/μm2 and 3.5 ± 0.4/μm2, respectively.
Fig. 5. Depolymerization of microtubules decreases the number of BKα and RyR2 colocalization sites.
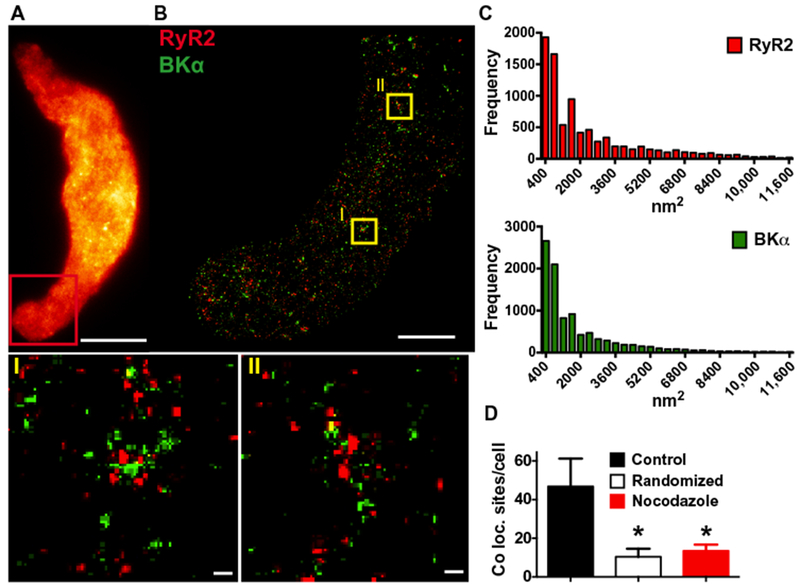
(A) Wide-field image of a freshly isolated arterial myocyte immunolabeled for BKα (n = 12 cells, n = 3 animals). Red box indicates the area where superresolution images were obtained. Scale bar, 10 μm. (B) Superresolution localization map obtained after immunolabeling with anti-BKμ (green) and anti-RyR2 (red) antibodies (n = 12 cells, n = 3 animals). Scale bar, 3 μm. ROIs (yellow boxes) are shown in magnified view (I) and (II) below. Scale bars, 0.2 μm. (C) Cluster size distribution histograms of RyR2 and BKα (n = 11,005 or n = 11,940 particles for RyR2 and BKα, respectively; 12 cells, n = 3 animals). (D) Summary of object-based analysis to determine the number of BKα protein cluster centroids per cell that overlay with RyR2 protein clusters in control cells, cells in which a random BKα distribution has been simulated, and cells treated with nocodazole (10 μM). *P ≤ 0.05 compared to control (n =12 cells per group, 3 animals). Coloc., colocalization.
Using a nearest neighbor analysis to determine how microtubules influenced the proximity of BKα and RyR2, we found that depolymerization of microtubules using nocodazole increased both the mean (167.0 ± 6.0 nm compared to 221.1 ± 11.9 nm) and median (137.2 ± 5.1 nm compared to 180.7 ± 11.2 nm) distances between these two proteins (fig. S6). This effect was further investigated using object-based analysis (21), which revealed 47 ± 14 sites per cell, where BKα clusters colocalized with RyR2 clusters at the resolution limit of the GSDIM microscope (~20 to 30 nm). Such sites can form active Ca2+ signaling complexes. By comparison, a random distribution of BKα clusters, simulated using the Costes method (21), predicted only 10 ± 4 colocalization sites per cell (Fig. 5D). These data provide evidence that BKα and RyR2 selectively colocalize in cerebral arterial myocytes. To test the hypothesis that microtubule-dependent peripheral coupling was necessary for the formation of these complexes, we treated cerebral arterial myocytes with nocodazole before fixation, coimmunolabeling for BKα and RyR2, and GSDIM analysis. Superresolution localization maps indicated that this treatment reduced the number of BKα and RyR2 colocalization sites to 13 ± 3 per cell, a value similar to that predicted by random distribution simulations (Fig. 5D). These data demonstrate that intact microtubule networks are required to maintain selective colocalization of BKα and RyR2 in cerebral arterial myocytes.
Peripheral coupling sites support endogenous BK channel activity and regulation of cerebral artery tone
Our data showed that microtubule depolymerization expanded the separation distance between the SR and the plasma membrane, increased the duration and spatial spread of Ca2+ sparks, and reduced the number of close contacts between BKα and RyR2. We next examined the functional consequences of these changes in endogenous BK channel regulation using patch-clamp electrophysiology. Spontaneous transient outward K+ currents (STOCs), which arise through activation of clusters of BK channels in the plasma membrane by Ca2+ sparks (9), were recorded from freshly isolated, voltage-clamped (−30 mV) cerebral artery smooth muscle cells in the amphotericin B–perforated, whole-cell configuration. These endogenously generated macroscopic currents were essentially abolished by depolymerization of microtubules with nocodazole (Fig. 6A). However, nocodazole had no direct effect on single-channel BK activity recorded from inside-out membrane patches (Fig. 6B). These data indicate that microtubule depolymerization disrupts spontaneous Ca2+ spark–dependent BK channel activity in these cells, suggesting that loss of peripheral coupling impairs functional coupling between RyR2s and BK channels.
Fig. 6. Microtubule-dependent peripheral coupling supports endogenous BK channel activity and regulation of cerebral artery tone by intraluminal pressure.
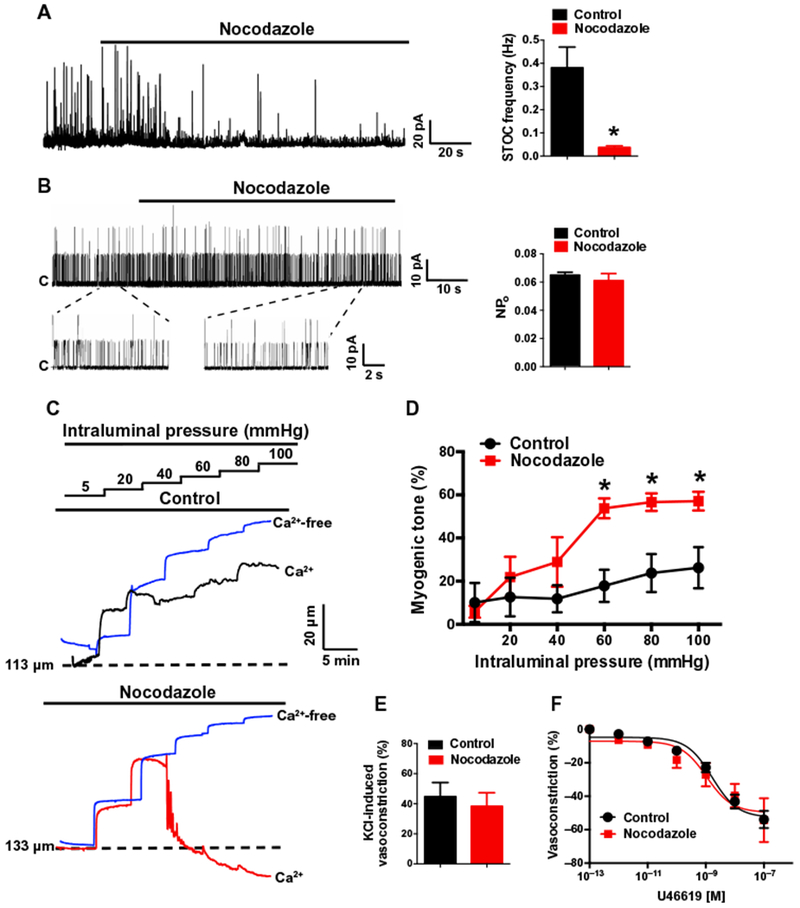
(A) Representative perforated voltage-clamp (VH = −30 mV) recording and summary data demonstrating the effects of nocodazole (10 μM) on STOC frequency (n = 5 cells, n = 3 animals; *P ≤ 0.05 compared to control). (B) Representative recordings and summary data demonstrating the effects of nocodazole (10 μM) on single BK channel activity. BK channel activity in inside-out membrane patches was evoked by 3 μM free Ca2+ in the bath solution and was recorded at +40 mV. Nocodazole had no effect on single-channel open probability (NPo) (n = 5 cells, n = 3 animals). (C) Representative recordings of pressure-induced constriction of control- and nocodazole-treated cerebral resistance arteries. Traces show inner luminal diameter at intraluminal pressures between 5 and 100 mmHg for arteries superfused with a Ca2+-containing (black or red traces) or Ca2+-free (blue trace) bathing solution. (D) Summary data showing the effects of nocodazole on myogenic tone as a function of intraluminal pressure (n = 5 arteries, n = 3 animals; *P ≤ 0.05 compared to control). (E) Summary of constriction of control- or nocodazole-treated arteries in response to increased (60 mM) extracellular [K+] (n = 4 arteries, n = 3 animals). (F) Summary concentration-response curves demonstrating that nocodazole treatment does not alter sensitivity to the vasoconstricting thromboxane receptor agonist U46619 (n = 4 arteries, n = 3 animals).
Although our data showed that disruption of the actin cytoskeleton did not alter the separation distance between the SR and the plasma membrane, it has been shown previously that actin can directly interact with the BKα subunit to restrict movement of the channel within the plasma membrane (22, 23). In patch-clamp electrophysiology experiments, we found that depolymerization of actin fibers with latrunculin B and swinholide A had no significant effect on STOC frequency (fig. S7, A and B), suggesting that the actin cytoskeleton is not necessary for functional coupling of RyR2s and BK channels.
Vascular smooth muscle cells in the walls of resistance arteries intrinsically contract or relax in response to changes in intraluminal pressure. This autoregulatory mechanism, known as the vascular myogenic response, adjusts vascular resistance to maintain nearly constant rates of blood flow, protecting the delicate microcirculation against transient increases in perfusion pressure (24). Increases in intraluminal pressure activate inward cation currents through TRPC6 (transient receptor potential cation subfamily C member 6) and TRPM4 channels to depolarize the plasma membrane of smooth muscle cells, stimulating Ca2+ influx through voltage-dependent Ca2+ channels and vasoconstriction (25–27). BK channels are also activated in response to pressure-induced membrane depolarization and increases in global [Ca2+], providing a critical negative feedback mechanism that repolarizes the membrane to limit the extent of constriction (9, 10, 28). We confirmed the findings of these previous studies by using the selective BK channel inhibitor paxilline, which increased myogenic tone over a physiologically relevant range of intraluminal pressures (fig. S8). To investigate the effects of disrupted peripheral coupling on this pathway, we studied the contractility of isolated cerebral resistance arteries (~100 to 200 μm in diameter) using pressure myography. Spontaneous myogenic tone was recorded over a range of intraluminal pressures between before and after treatment with nocodazole to depolymerize microtubules. Microtubule disruption greatly increased the development of myogenic tone over a physiologically relevant range of intraluminal pressure (60 to 100 mmHg) (Fig. 6, C and D). Nocodazole treatment had no effect on depolarization-induced constriction, caused by increasing extracellular [K+] to 60 mM (Fig. 6E), or constriction induced by the thromboxane receptor agonist U46619 (Fig. 6F), indicating that basic contractile mechanisms activated by voltage-dependent Ca2+ influx and Gq protein–coupled signaling cascades are not directly affected by depolymerization of microtubules. Furthermore, nocodazole did not alter the maximal passive diameter of cerebral vessels (at 100 mmHg), indicating that this treatment does not affect vascular distention (fig. S9). Together, our data demonstrate that loss of close interactions between the peripheral SR and the plasma membrane diminishes the negative feedback influence of BK channel activity in pressurized blood vessels, resulting in massively increased myogenic tone and cerebral arterial dysfunction.
DISCUSSION
Our results provide important new insights into the architecture and functional importance of peripheral coupling sites in contractile vascular smooth muscle cells. Although the molecular composition of JMCs in skeletal and cardiac muscle cells has been extensively characterized (3, 29, 30), we investigated structure-function relationships of peripheral coupling sites in native arterial myocytes, a poorly understood area. We showed that defined, arch-like microtubule structures near the cell border formed an underlying support system that maintained close interactions between the peripheral SR and the plasma membrane. Loss of microtubule-dependent peripheral coupling between these membranes increased the duration and spatial spread of Ca2+ sparks and significantly decreased the colocalization of BKα and RyR2 protein clusters. At a functional level, these structural alterations manifested as decreased Ca2+ spark–activated BK channel activity and significant increases in the magnitude of vasoconstriction in response to physiological amounts of intraluminal pressure. Thus, our data provide new insights into the role of the cytoskeleton in the formation of peripheral coupling sites in vascular smooth muscle cells and demonstrate that these structures are critically important for a fundamental autoregulatory process of the cerebral vasculature.
Stable JMCs within T tubules of skeletal and cardiac muscle cells support myocyte contractility by functionally and physically coupling voltage-dependent Ca2+ channels in the plasma membrane with RyRs on the SR. The organization of these complexes is maintained by cyto-skeletal elements and specialized proteins, such as junctophilins (3) and triadin (4, 31). In addition, transient JMCs occur as peripheral coupling sites in many types of cells to allow store-operated Ca2+ entry in response to depletion of SR/endoplasmic reticulum (ER) Ca2+ stores (32). These structures are primarily organized by STIM1 (stromal interaction molecule 1), a transmembrane protein predominantly localized to the ER, and Ca2+-permeable Orai channels in the plasma membrane (33–35). In contrast, although stable peripheral coupling is present in contractile smooth muscle cells, little has been previously reported about the molecular interactions that maintain these structures. Here, we showed that intact microtubule networks were vitally important to maintain peripheral coupling, whereas the actin cytoskeleton was dispensable for this function. High-resolution confocal images and superresolution microscopy showed that peripheral SR elements at the periphery sat atop an extensive molecular framework composed of microtubule networks with a sinusoidal morphology. These arching structures are reminiscent of “microtubule buckles” described in cardiomyocytes under load (36). This apparent buckling of microtubules in smooth muscle cells suggests that these structures exert force that directs the SR outward toward the plasma membrane. Thus, our findings provide evidence that mechanical force conserved by microtubules contributes to the maintenance of peripheral coupling in vascular smooth muscle cells.
We investigated the importance of peripheral coupling in smooth muscle cells using a loss-of-function approach, in which the separation distance between the SR and the plasma membrane was increased by depolymerizing microtubules. These studies demonstrated that the duration and spatial spread of Ca2+ sparks were increased by disruption of peripheral coupling. The increase in Ca2+ spark event duration after disruption of peripheral coupling was solely attributable to longer decay times, indicating that microtubule depolymerization decreased the efficiency of Ca2+ reuptake and/or buffering mechanisms, possibly reflecting expansion of Ca2+ spark microdomains associated with the loss of peripheral coupling. The amplitude of Ca2+ sparks (correlated to the amount of Ca2+ released from the SR) was not altered by depolymerization of microtubules, suggesting that increases in spatial spread are due to enlargement of the physical microdomains enclosing Ca2+ spark sites. Disruption of peripheral coupling also impaired the formation of a critical Ca2+ signaling complex in smooth muscle cells composed of BK channels on the plasma membrane and RyR2s on the SR. Using superresolution microscopy, we found that depolymerization of microtubules reduced the number of sites of BKα and RyR2 colocalization at the resolution limit of our GSDIM system (~20 to 30 nm) from ~50 per cell to ~10 per cell, the latter of which is essentially the same number predicted by a simulation of randomly distributed BK channel proteins. These protein clusters were not distributed uniformly on the plasma membrane, consistent with predictions of the “oasis” model of RyR2-BK microdomain (37). Robust activation of BK channels at membrane potentials in the physiological range for vascular smooth muscle cells (−50 to −35 mV) requires that local [Ca2+]i (intracellular calcium concentration) reaches ≥10 μM (37, 38). A modeling analysis that considers physiological SR-to-cytosol Ca2+ gradients and the activities of mobile and stationary Ca2+ buffers indicates that a tight linkage of the Ca2+ source (RyR2) and sensor (BK) is necessary to achieve these conditions, with a separation of ~30 to 40 nm, estimated to be the outer limit for efficient Ca2+-dependent BK channel activation (15). Therefore, a reduction in the number of BKα-RyR2 colocalization sites after depolymerization of microtubules should reduce the population of channels available for Ca2+ spark–dependent activation. This prediction was confirmed by patch-clamp electrophysiology studies, which showed that depolymerization of microtubules nearly abolished Ca2+ signal-activated macroscopic BK currents, an outcome that is expected to have deleterious effects on membrane potential regulation. Thus, our data indicate that peripheral coupling defines fundamental properties of Ca2+ sparks and maintains the functional coupling of BK channels and RyR2s necessary for endogenous Ca2+-dependent regulation of the BK channel.
In cerebral resistance arteries, Ca2+ sparks and BK channel activity are stimulated by membrane depolarization and increases in global [Ca2+]i (10, 28). This mechanism provides a critical negative feedback that limits the extent of smooth muscle cell membrane depolarization and vasoconstriction in response to increases in intraluminal pressure (7). Here, we found that, as expected, disruption of peripheral coupling greatly increased pressure-induced vasoconstriction, reflecting the loss of endogenous BK channel activity. Pharmacological block of BK channels (10) or genetic deletion of either the poreforming α subunit (39) or the regulatory β1 subunit (40) of BK also increases myogenic tone. Our findings partially agree with previous studies showing that no-codazole treatment increases the contractility of cremaster arterioles (41, 42) and aortic rings (43, 44). However, these earlier studies, which did not investigate changes in membrane potential or ion channel activity, suggested Rho kinase–dependent Ca2+ sensitization, rather than increased voltage-dependent Ca2+ influx, as the primary mechanism underlying the enhanced contractility. In contrast, our findings showed that nocodazole treatment did not alter vasoconstriction induced by increased extracellular K+ or a Gαq protein receptor agonist, suggesting that this treatment did not affect Ca2+ sensitization. These apparent discrepancies could be attributable to heterogeneity in the influence of Ca2+-activated ion channel activity among vascular beds, such that BK channels have a higher open probability and a larger effect on contractile responses in cerebral arteries than in skeletal muscle arteries (45). Regardless, our studies indicated that impaired Ca2+ spark and BK channel activity were responsible for the cerebral artery dysfunction caused by microtubule dysregulation. Microtubules participate in mechanosensitive activation of RyR2-mediated Ca2+ release in cardiomyocytes by controlling NADPH (nicotinamide adenine dinucleotide phosphate) oxidase (NOX)–dependent generation of reactive oxygen species (X-ROS) (46–51). If present in smooth muscle cells, the X-ROS pathway could effectively contribute to Ca2+ spark and BK channel activity during contraction to provide negative feedback regulation.
In summary, our study demonstrated that sites of intimate contact between the peripheral SR and the plasma membrane in native vascular smooth muscle were supported by outward tension generated by arching microtubule structures at the margin of the cell. Disruption of peripheral coupling sites impaired endogenous Ca2+-dependent regulation of BK channel activity and disturbed the regulation of cerebral arterial tone, highlighting the functional importance of these structures. Impaired BK channel activity may contribute to the increased cerebral artery contractility associated with hypertension, diabetes, and obesity (52–54). An important direction for continuing studies will be to determine whether disruption of peripheral coupling and associated Ca2+ signaling networks contributes to the pathogenesis of these diseases. A complete description of the structure-function relationships of peripheral coupling complexes in vascular smooth muscle cells will undoubtedly shed new light on vascular function in health and disease, as has been the case for cardiac (55) and skeletal (56) muscle.
MATERIALS AND METHODS
Smooth muscle cell isolation
Adult male Sprague-Dawley rats and C57/B16 mice were euthanized by cervical dislocation under isoflurane anesthesia according to a protocol approved by the Institutional Animal Care and Use Committee of the University of Nevada, Reno. The brain was isolated into a solution of ice-cold 3-(N-morpholino)propanesulfonic acid (Mops)–buffered saline [3 mM Mops (pH 7.4), 145 mM NaCl, 5 mM KCl, 1 mM MgSO4, 2.5 mM CaCl2,1 mM KH2PO4, 0.02 mM EDTA, 2 mM pyruvate, 5 mM glucose, and 1% bovine serum albumin]. Cerebral pial resistance arteries were dissected from the brain and stored in this solution on ice. Individual smooth muscle cells were isolated from rat cerebral arteries in a Ca2+-free, Mg2+-based physiological saline solution (Mg-PSS) containing 5 mM KCl, 140 mM NaCl, 2 mM MgCl2, 10 mM Hepes, and 10 mM glucose (pH 7.4). Arteries were initially digested in papain (0.6 mg/ml) (Worthington) and dithioerythritol (1 mg/ml) for 15 min at 37°C, followed by a 15-min incubation at 37°C in type II collagenase (1.0 mg/ml) (Worthington). The digested arterial segments were washed three times in an ice-cold Mg-PSS solution and incubated on ice for 30 min. The tissue was then triturated to liberate smooth muscle cells and stored in ice-cold Mg-PSS. Smooth muscle cells were studied within 6 hours of isolation.
Confocal imaging of microtubules, the SR, and the plasma membrane
Contractile smooth muscle cells were enzymatically dissociated from cerebral vessels, as described above, and allowed to adhere to glass slides for 20 min at 4°C. Tubulin- or membrane-specific fluorescence staining was performed using Tubulin Tracker Green (5 μg/ml), ER-Tracker Green (5 μg/ml), ER-Tracker Red (5 μg/ml), or CellMask Deep Red (5 μg/ml) (all from Invitrogen). To stain microtubules, arterial myocytes were incubated with Tubulin Tracker in Mg-PSS for 20 min at 37°C. To specifically stain the plasma membrane, cells were incubated in CellMask Deep Red in Mg-PSS for 5 min at 37°C. To specifically stain the SR membrane, cells were incubated in ER-Tracker Green or ER-Tracker Red in Mg-PSS for 30 min at 37°C. For dual membrane staining, cells were incubated in ER membrane stain, washed, and incubated in plasma membrane stain. Cells were then treated with either nocodazole (10 μM), latrunculin B (1 μM), and swinholide A (0.1 μM) or vehicle control during imaging. Separation of the plasma membrane and SR labeling was measured as a shift in fluorescence intensity plots of line scans through the cell and reported as difference in pixels [(D) pixels].
Fluorescence images were obtained using a spinning disk confocal microscope (Olympus IX71 equipped with a Yokogawa CSU22 confocal scanning unit) and coupled to an iXon camera (Andor Technology). Images were obtained using a 100× oil immersion objective [numerical aperture (NA), 1.45]. Z-stacks were acquired at 0.10 to 0.25 μm using a high-speed, piezo-driven microscope objective nanofocusing/scanning device (P-721, PIFOC). Texas Red and fluorescein isothiocyanate were excited by illumination with 543- and 488-nm laser lines, respectively. All images were acquired at 1024 pixels × 1024 pixels and were analyzed using the NIH ImageJ software package (57).
Immunocytochemistry and superresolution microscopy
A GSDIM system (Leica) built around an inverted microscope (DMI6000 B, Leica) was used to generate superresolution images of polymerized α-tubulin, BKα, and RyR2 in arterial myocytes. Images were obtained using a 160× HCX Plan Apochromat (NA, 1.47) oil immersion lens and an electron-multiplying charge-coupled device camera (iXon3 897, Andor Technology). Cells were fixed with 3.2% formaldehyde/0.1% glutaraldehyde–phosphate-buffered saline (PBS), permeabilized and blocked with 0.2% saponin/5% horse serum–PBS, and incubated with primary antibodies against α-tubulin (1:100; MA1-80017, Life Technologies), BKα (1:100; APC-021, Alomone Labs), and RyR2 (1:100; ab2868, Abcam). Alexa Fluor 555– or Alexa Fluor 647–conjugated secondary antibodies were used for detection, and cells were postfixed with 0.25% glutaraldehyde. During imaging, cells were kept in a thiol-based imaging solution consisting of 100 mM tris buffer (pH 8), 10% glucose, 1 mM mercaptoethylamine, and 1% GLOX mixture. The GLOX mixture consisted of glucose oxidase (0.056 mg/ml) and 20% catalase in PBS (pH 7.4). Fluorophores were excited with 500-mW 532- and 642-nm lasers.
LASAF software (Leica) was used to localize fluorescence particles. Briefly, this software fits single-molecule fluorescence signals acquired during GSDIM with a 2D Gaussian distribution. Images were rendered to a pixel size of 20 nm. For analysis, we set an event threshold of 100 events per pixel. High-resolution localization images were reconstructed using the coordinates of centroids of these fluorescent particles obtained from >26,000 images. The number of events detected in cells exposed to primary and secondary antibodies ranged from 13,974 to 94,714 for RyR2 and BKα and from 105,568 to 899,144 for α-tubulin. Only 226 to 3396 events were detected in cells exposed to secondary antibodies alone, demonstrating the specificity of the immunolabeling procedures.
Cluster sizes were analyzed using CellProfiler software (58). Briefly, 50 rectangular ROIs (50 pixels × 50 pixels) were generated for each cell in ImageJ and uploaded into CellProfiler. These subimages were thresholded, and the size of each protein cluster was calculated. Object-based analysis was used to measure the distance between BKα channels and RyR2s in superresolution localization images using ImageJ software with the JACoP colocalization analysis plugin, which applies a connexity analysis for image segmentation (21, 59). Briefly, this process involves the systematic inspection of the neighborhood (8 pixels in 2D) of a pixel (reference pixel). All adjacent pixels with intensities above a set threshold limit are considered to be part of the same structure as the reference pixel and represent individualized particles (individualized structures). After segmentation, centroids—the geometric centers of the particle including the global shape of the particle/structure—are determined from each particle/structure, and the distance between centroids is measured in the red and far-red channel. Control experiments examined the distance between Alexa Fluor 555– and Alexa Fluor 647–conjugated secondary antibodies.
Quantifying the proximity of RyR2 channel clusters to tubulin
GSDIM images of RyR2 channel clusters and tubulin filaments were captured as described. We constrained the analysis to examine only the degree of vertical overlap between the two structures because the precise depth (“focal plane”) in which signals were detected was uncertain (range, 20 to 100 nm) and could lead to increasingly erroneous measurements if a proximity approach was used. As such, the conservative approach of using vertical overlap likely underestimates the overall association between the two structures by a significant amount. Images were scaled to twice their size (Lanczos 3, GraphicConverter 8, Lemke Software GmbH), imported into custom-written software, and spatially calibrated (Volumetry G8d; G. W. Hennig). A mask of each cell area was made by manually outlining the edge and filling the cytoplasmic area from a combined image of RyR2 and tubulin. Individual images of RyR2- and tubulin-immunostained cells were thresholded using the same intensity (8-bit grayscale: RyR2, 10 to 255; tubulin, 20 to 255), and individual structures (edge separation between structures > 1 pixel) were converted to a coordinate-based particle format. Next, the position of each RyR2 channel cluster particle was randomized within a certain radius of its original position (randomized angle between 0° and 360° and randomized radius between 0 and 285 nm). This procedure did not change the rotation angle of the RyR2 channel cluster particles. Each repositioned particle was confirmed to be completely contained within the cell area using the cell area mask constructed earlier. The degree of overlap (number of image coordinates that contained both RyR2 and tubulin) was calculated and expressed as a percentage of the total tubulin area that overlapped with RyR2 channel clusters or vice versa. This routine was repeated 1000 times. The actual degree of overlap could then be directly compared to the degree of overlap when RyR2 channel clusters were randomly repositioned (within a radius constraint).
Ca2+ sparks
Dissociated cerebral artery smooth muscle cells were placed in a recording chamber (Warner Instruments) and allowed to adhere to glass coverslips for 20 min at room temperature. Cells were then loaded with the Ca2+ indicator dye Fluo-4AM (10 μM) (Molecular Probes) in the dark for 30 min in Ca2+-free Mg-PSS solution, washed with Ca2+-containing PSS, and incubated in the dark for 15 min at room temperature. Images were acquired using a spinning disk confocal microscope (Andor Technology) with a 100× oil immersion objective (NA, 1.45) at a frame rate of 40 to 60 frames/s. Analyses of Ca2+ sparks were aided by the use of custom software provided by M. T. Nelson and A. D. Bonev (University of Vermont).
Patch-clamp electrophysiology
Freshly isolated cerebral artery smooth muscle cells were transferred to a recording chamber (Warner Instruments) and allowed to adhere to glass coverslips for 20 min at room temperature. Recording electrodes (1 to 3 megohm) were pulled, polished, and coated with wax to reduce capacitance. Cells were patched, and gigohm seals were obtained using Mg-PSS as the bathing solution. STOCs were recorded in bathing solution containing 134 mM NaCl, 6 mM KCl, 1 mM MgCl2, 2 mM CaCl2, 10 mM Hepes, and 10 mM glucose (pH 7.4) (NaOH). The pipette solution contained 110 mM K-aspartate, 1 mM MgCl2, 30 mM KCl, 10 mM NaCl, 10 mM Hepes, and 5 μM EGTA (pH 7.2) (NaOH). For perforated-patch, whole-cell recordings, amphotericin B (40 μM) was included in the pipette solution. Perforation was deemed acceptable if the series resistance was less than 50 megohm. Single-channel BK currents were recorded in excised inside-out membrane patches using a bath and pipette solution containing 140 mM KCl, 1 mM MgCl2, 1.9 mM CaCl2, 5 mM EGTA, and 10 mM Hepes (pH 7.2) (3 μM free Ca2+). For all experiments, currents were recorded using an Axopatch 200B amplifier equipped with an Axon CV 203BU headstage (Molecular Devices). Currents were filtered at 1 kHz, digitized at 40 kHz, and stored for subsequent analysis. Clampex and Clampfit (version 10.2; Molecular Devices) were used for data acquisition and analysis, respectively. All recordings were performed at room temperature (22°C). To record STOCs, myocytes were clamped at a membrane potential of −30 mV. STOCs were defined as transient events of >10 pA (>1 BK channel), and the frequency was calculated by dividing the number of events by the time between the first and last event.
Pressure myography
Intact cerebral resistance arteries (diameter, 100 to 200 μm) were isolated from mouse brains, transferred to a pressure myography chamber (Living Systems) containing physiological saline solution (119 mM NaCl, 4.7 mM KCl, 1.8 mM CaCl2,1.2 mM MgSO4,24 mM NaHCO3,0.2 mM KH2PO4, 10.6 mM glucose, and 1.1 mM EDTA), and pressurized to 10 mmHg. Pressurized vessels were superfused (5 ml/min) with warmed (37°C) PSS aerated with a normoxic gas mixture (21% O2/6% CO2, balance N2). After a 15-min equilibration period, intraluminal pressure was slowly increased to 60 mmHg, and vessels were allowed to develop spontaneous myogenic tone. All vessels used for this study developed spontaneous myogenic tone. Inner diameter was continuously monitored using video microscopy and edge detection software (IonOptix). Vasoreactivity to a high concentration of extracellular KCl (60 mM; equimolar replacement of NaCl) was determined using vessels pressurized to 60 mmHg. U46619-induced vasoconstriction was evaluated using arteries pressurized to 60 mmHg. Vessels were incubated in nocodazole for 30 min to allow for microtubule depolymerization. Maximum (passive) diameter was determined by superfusing vessels with Ca2+-free PSS (119 mM NaCl, 4.7 mM KCl, 1.2 mM MgSO4,24 mM NaHCO3, 0.2 mM KH2PO4, 10.6 mM glucose, 1.1 mM EDTA, 3 mM EGTA, and 0.01 mM diltiazem).
Calculations and statistics
All data are presented as means ± SE. Values of n refer to the number of cells for patch-clamp and cell staining experiments. Data were compared as indicated using paired t tests or two-way repeated measures ANOVA (analysis of variance). A P value of ≤0.05 was accepted as statistically significant for all experiments.
Supplementary Material
Fig. S1. Method used to estimate SR-PM separation distance.
Fig. S2. Z-stack analysis of interactions between the SR and microtubule arches.
Fig. S3. Microtubules underlie the peripheral SR.
Fig. S4. Overlap of RyR2 channel clusters with tubulin.
Fig. S5. Nocodazole treatment has no effect on total SR Ca2+ store load or Ca2+ spark frequency.
Fig. S6. BKα and RyR2 nearest neighbor analysis.
Fig. S7. Actin disruption does not alter STOC frequency.
Fig. S8. Inhibition of BK channels increases myogenic tone.
Fig. S9. Effects of nocodazole on passive luminal diameter.
Movie S1. Microtubule depolymerization increases the separation distance between the SR and the plasma membrane.
Movie S2. Microtubule structure in freshly isolated smooth muscle cells.
Movie S3. SR structure in freshly isolated smooth muscle cells.
Acknowledgments:
We thank M. T. Nelson and A. D. Bonev (University of Vermont) for providing custom software for analyzing Ca2+ sparks.
Funding: This work was supported by grants from the National Heart, Lung, and Blood Institute (R01HL091905 to S.E.), the American Heart Association (15POST24720002 to P.W.P.), the National Institute of Diabetes and Digestive and Kidney Disease (P01DK41315 and R01DK091336 to K.M.S.), and the Nevada Women’s Health Research Fund.
Footnotes
Competing interests: The authors declare that they have no competing interests.
SUPPLEMENTARY MATERIALS
www.sciencesignaling.org/cgi/content/full/10/497/eaan2694/DC1
REFERENCES AND NOTES
- 1.Takeshima H, Hoshijima M, Song L-S, Ca2+ microdomains organized by junctophilins. Cell Calcium 58, 349–356 (2015). [DOI] [PMC free article] [PubMed] [Google Scholar]
- 2.Barone V, Randazzo D, Del Re V, Sorrentino V, Rossi D, Organization of junctional sarcoplasmic reticulum proteins in skeletal muscle fibers. J. Muscle Res. Cell Motil 36, 501–515 (2015). [DOI] [PubMed] [Google Scholar]
- 3.Takeshima H, Komazaki S, Nishi M, Iino M, Kangawa K, Junctophilins: A novel family of junctional membrane complex proteins. Mol. Cell 6, 11–22 (2000). [DOI] [PubMed] [Google Scholar]
- 4.Knudson CM, Stang KK, Moomaw CR, Slaughter CA, Campbell KP, Primary structure and topological analysis of a skeletal muscle-specific junctional sarcoplasmic reticulum glycoprotein (triadin). J. Biol. Chem 268, 12646–12654 (1993). [PubMed] [Google Scholar]
- 5.Marty I, Triadin regulation of the ryanodine receptor complex. J. Physiol 593, 3261–3266 (2015). [DOI] [PMC free article] [PubMed] [Google Scholar]
- 6.Popescu LM, Gherghiceanu M, Mandache E, Cretoiu D, Caveolae in smooth muscles: Nanocontacts. J. Cell. Mol. Med 10, 960–990 (2006). [DOI] [PMC free article] [PubMed] [Google Scholar]
- 7.Knot HJ, Nelson MT, Regulation of membrane potential and diameter by voltage-dependent K+ channels in rabbit myogenic cerebral arteries. Am. J. Physiol 269, H348–H355 (1995). [DOI] [PubMed] [Google Scholar]
- 8.Nelson MT, Quayle JM, Physiological roles and properties of potassium channels in arterial smooth muscle. Am. J. Physiol 268, C799–C822 (1995). [DOI] [PubMed] [Google Scholar]
- 9.Nelson MT, Cheng H, Rubart M, Santana LF, Bonev AD, Knot HJ, Lederer WJ, Relaxation of arterial smooth muscle by calcium sparks. Science 270, 633–637 (1995). [DOI] [PubMed] [Google Scholar]
- 10.Knot HJ, Standen NB, Nelson MT, Ryanodine receptors regulate arterial diameter and wall [Ca2+] in cerebral arteries of rat via Ca2+-dependent K+ channels. J. Physiol 508 (Pt. 1), 211–221 (1998). [DOI] [PMC free article] [PubMed] [Google Scholar]
- 11.Ji G, Feldman ME, Greene KS, Sorrentino V, Xin H-B, Kotlikoff MI, RYR2 proteins contribute to the formation of Ca2+ sparks in smooth muscle. J. Gen. Physiol 123, 377–386 (2004). [DOI] [PMC free article] [PubMed] [Google Scholar]
- 12.Jaggar JH, Porter VA, Lederer WJ, Nelson MT, Calcium sparks in smooth muscle. Am. J. Physiol. Cell Physiol 278, C235–C256 (2000). [DOI] [PubMed] [Google Scholar]
- 13.Pérez GJ, Bonev AD, Patlak JB, Nelson MT, Functional coupling of ryanodine receptors to KCa channels in smooth muscle cells from rat cerebral arteries. J. Gen. Physiol 113, 229–238 (1999). [DOI] [PMC free article] [PubMed] [Google Scholar]
- 14.Wellman GC, Nelson MT, Signaling between SR and plasmalemma in smooth muscle: Sparks and the activation of Ca2+-sensitive ion channels. Cell Calcium 34, 211–229 (2003). [DOI] [PubMed] [Google Scholar]
- 15.Fakler B, Adelman JP, Control of KCa channels by calcium nano/microdomains. Neuron 59, 873–881 (2008). [DOI] [PubMed] [Google Scholar]
- 16.Gonzales AL, Earley S, Endogenous cytosolic Ca2+ buffering is necessary for TRPM4 activity in cerebral artery smooth muscle cells. Cell Calcium 51, 82–93 (2012). [DOI] [PMC free article] [PubMed] [Google Scholar]
- 17.Díaz JF, Barasoain I, Andreu JM, Fast kinetics of Taxol binding to microtubules. Effects of solution variables and microtubule-associated proteins. J. Biol. Chem 278, 8407–8419 (2003). [DOI] [PubMed] [Google Scholar]
- 18.Cole L, Davies D, Hyde GJ, Ashford AE, ER-Tracker dye and BODIPY-brefeldin A differentiate the endoplasmic reticulum and Golgi bodies from the tubular-vacuole system in living hyphae of Pisolithus tinctorius. J. Microsc 197, 239–249 (2000). [DOI] [PubMed] [Google Scholar]
- 19.Cheng H, Lederer WJ, Calcium sparks. Physiol. Rev 88, 1491–1545 (2008). [DOI] [PubMed] [Google Scholar]
- 20.van Breemen C, Fameli N, Evans AM, Pan-junctional sarcoplasmic reticulum in vascular smooth muscle: Nanospace Ca2+ transport for site- and function-specific Ca2+ signalling. J. Physiol 591, 2043–2054 (2013). [DOI] [PMC free article] [PubMed] [Google Scholar]
- 21.Bolte S, Cordelières FP, A guided tour into subcellular colocalization analysis in light microscopy. J. Microsc 224, 213–232 (2006). [DOI] [PubMed] [Google Scholar]
- 22.Tian L, Chen L, McClafferty H, Sailer CA, Ruth P, Knaus HG, Shipston MJ, A noncanonical SH3 domain binding motif links BK channels to the actin cytoskeleton via the SH3 adapter cortactin. FASEB J. 20, 2588–2590 (2006). [DOI] [PubMed] [Google Scholar]
- 23.Yamamura H, Ikeda C, Suzuki Y, Ohya S, Imaizumi Y, Molecular assembly and dynamics of fluorescent protein-tagged single KCa1.1 channel in expression system and vascular smooth muscle cells. Am. J. Physiol. Cell Physiol 302, C1257–C1268 (2012). [DOI] [PubMed] [Google Scholar]
- 24.Bayliss WM, On the local reactions of the arterial wall to changes of internal pressure. J. Physiol 28, 220–231 (1902). [DOI] [PMC free article] [PubMed] [Google Scholar]
- 25.Gonzales AL, Yang Y, Sullivan MN, Sanders L, Dabertrand F, Hill-Eubanks DC, Nelson MT, Earley S, A PLCα1-dependent, force-sensitive signaling network in the myogenic constriction of cerebral arteries. Sci. Signal 7, ra49 (2014). [DOI] [PMC free article] [PubMed] [Google Scholar]
- 26.Earley S, Waldron BJ, Brayden JE, Critical role for transient receptor potential channel TRPM4 in myogenic constriction of cerebral arteries. Circ. Res 95, 922–929 (2004). [DOI] [PubMed] [Google Scholar]
- 27.Welsh DG, Morielli AD, Nelson MT, Brayden JE, Transient receptor potential channels regulate myogenic tone of resistance arteries. Circ. Res 90, 248–250 (2002). [DOI] [PubMed] [Google Scholar]
- 28.Jaggar JH, Stevenson AS, Nelson MT, Voltage dependence of Ca2+ sparks in intact cerebral arteries. Am. J. Physiol 274, C1755–C1761 (1998). [DOI] [PubMed] [Google Scholar]
- 29.Marty I, Robert M, Villaz M, De Jongh K, Lai Y, Catterall WA, Ronjat M, Biochemical evidence for a complex involving dihydropyridine receptor and ryanodine receptor in triad junctions of skeletal muscle. Proc. Natl. Acad. Sci. U.S.A 91, 2270–2274 (1994). [DOI] [PMC free article] [PubMed] [Google Scholar]
- 30.Nishi M, Komazaki S, Kurebayashi N, Ogawa Y, Noda T, Iino M, Takeshima H, Abnormal features in skeletalmuscle from mice lacking mitsugumin29. J. Cell Biol 147, 1473–1480 (1999). [DOI] [PMC free article] [PubMed] [Google Scholar]
- 31.Brandt NR, Caswell AH, Carl SA, Ferguson DG, Brandt T, Brunschwig J-P, Bassett AL, Detection and localization of triadin in rat ventricular muscle. J. Membr. Biol 131, 219–228 (1993). [DOI] [PubMed] [Google Scholar]
- 32.Irvine RF, “Quantal” Ca2+ release and the control of Ca2+ entry by inositol phosphates—A possible mechanism. FEBS Lett. 263, 5–9 (1990). [DOI] [PubMed] [Google Scholar]
- 33.Roos J, DiGregorio PJ, Yeromin AV, Ohlsen K, Lioudyno M, Zhang S, Safrina O, Kozak JA, Wagner SL, Cahalan MD, Veliçelebi G, Stauderman KA, STIM1, an essential and conserved component of store-operated Ca2+ channel function. J. Cell Biol 169, 435–445 (2005). [DOI] [PMC free article] [PubMed] [Google Scholar]
- 34.Zhang SL, Yu Y, Roos J, Kozak JA, Deerinck TJ, Ellisman MH, Stauderman KA, Cahalan MD, STIM1 is a Ca2+ sensor that activates CRAC channels and migrates from the Ca2+ store to the plasma membrane. Nature 437, 902–905 (2005). [DOI] [PMC free article] [PubMed] [Google Scholar]
- 35.Soboloff J, Spassova MA, Tang XD, Hewavitharana T, Xu W, Gill DL, Orai1 and STIM reconstitute store-operated calcium channel function. J. Biol. Chem 281, 20661–20665 (2006). [DOI] [PubMed] [Google Scholar]
- 36.Robison P, Caporizzo MA, Ahmadzadeh H, Bogush AI, Chen CY, Margulies KB, Shenoy VB, Prosser BL, Detyrosinated microtubules buckle and bear load in contracting cardiomyocytes. Science 352, aaf0659 (2016). [DOI] [PMC free article] [PubMed] [Google Scholar]
- 37.Zhuge R, Fogarty KE, Tuft RA, Walsh JV Jr., Spontaneous transient outward currents arise from microdomains where BK channels are exposed to a mean Ca2+ concentration on the order of 10 mM during a Ca2+ spark. J. Gen. Physiol 120, 15–27 (2002). [DOI] [PMC free article] [PubMed] [Google Scholar]
- 38.Brenner R, Jegla TJ, Wickenden A, Liu Y, Aldrich RW, Cloning and functional characterization of novel large conductance calcium-activated potassium channel α subunits, hKCNMB3 and hKCNMB4. J. Biol. Chem 275, 6453–6461 (2000). [DOI] [PubMed] [Google Scholar]
- 39.Sausbier M, Arntz C, Bucurenciu I, Zhao H, Zhou X-B, Sausbier U, Feil S, Kamm S, Essin K, Sailer CA, Abdullah U, Krippeit-Drews P, Feil R, Hofmann F, Knaus H-G, Kenyon C, Shipston MJ, Storm JF, Neuhuber W, Korth M, Schubert R, Gollasch M, Ruth P, Elevated blood pressure linked to primary hyperaldosteronism and impaired vasodilation in BK channel–deficient mice. Circulation 112, 60–68 (2005). [DOI] [PubMed] [Google Scholar]
- 40.Brenner R, Peréz GJ, Bonev AD, Eckman DM, Kosek JC, Wiler SW, Patterson AJ, Nelson MT, Aldrich RW, Vasoregulation by the b1 subunit of the calcium-activated potassium channel. Nature 407, 870–876 (2000). [DOI] [PubMed] [Google Scholar]
- 41.Platts SH, Falcone JC, Holton WT, Hill MA, Meininger GA, Alteration of microtubule polymerization modulates arteriolar vasomotor tone. Am. J. Physiol 277, H100–H106 (1999). [DOI] [PubMed] [Google Scholar]
- 42.Platts SH, Martinez-Lemus LA, Meininger GA, Microtubule-dependent regulation of vasomotor tone requires Rho-kinase. J. Vasc. Res 39, 173–182 (2002). [DOI] [PubMed] [Google Scholar]
- 43.Chitaley K, Webb RC, Microtubule depolymerization facilitates contraction of rat aorta via activation of Rho-kinase. Vascul. Pharmacol 38, 157–161 (2002). [DOI] [PubMed] [Google Scholar]
- 44.Zhang D, Jin N, Rhoades RA, Yancey KW, Swartz DR, Influence of microtubules on vascular smooth muscle contraction. J. Muscle Res. Cell Motil 21, 293–300 (2000). [DOI] [PubMed] [Google Scholar]
- 45.Yang Y, Sohma Y, Nourian Z, Ella SR, Li M, Stupica A, Korthuis RJ, Davis MJ, Braun AP, Hill MA, Mechanisms underlying regional differences in the Ca2+ sensitivity of BKCa current in arteriolar smooth muscle. J. Physiol 591, 1277–1293 (2013). [DOI] [PMC free article] [PubMed] [Google Scholar]
- 46.Limbu S, Hoang-Trong TM, Prosser BL, Lederer WJ, Jafri MS, Modeling local X-ROS and calcium signaling in the heart. Biophys. J 109, 2037–2050 (2015). [DOI] [PMC free article] [PubMed] [Google Scholar]
- 47.Kerr JP, Robison P, Shi G, Bogush AI, Kempema AM, Hexum JK, Becerra N, Harki DA, Martin SS, Raiteri R, Prosser BL, Ward CW, Detyrosinated microtubules modulate mechanotransduction in heart and skeletal muscle. Nat. Commun 6, 8526 (2015). [DOI] [PMC free article] [PubMed] [Google Scholar]
- 48.Prosser BL, Ward CW, Lederer WJ, X-ROS signalling is enhanced and graded by cyclic cardiomyocyte stretch. Cardiovasc. Res 98, 307–314 (2013). [DOI] [PMC free article] [PubMed] [Google Scholar]
- 49.Prosser BL, Khairallah RJ, Ziman AP, Ward CW, Lederer WJ, X-ROS signaling in the heart and skeletal muscle: Stretch-dependent local ROS regulates [Ca2+]i. J. Mol. Cell. Cardiol 58, 172–181 (2013). [DOI] [PMC free article] [PubMed] [Google Scholar]
- 50.Khairallah RJ, Shi G, Sbrana F, Prosser BL, Borroto C, Mazaitis MJ, Hoffman EP, Mahurkar A, Sachs F, Sun Y, Chen Y-W, Raiteri R, Lederer WJ, Dorsey SG, Ward CW, Microtubules underlie dysfunction in duchenne muscular dystrophy. Sci. Signal 5, ra56 (2012). [DOI] [PMC free article] [PubMed] [Google Scholar]
- 51.Prosser BL, Ward CW, Lederer WJ, X-ROS signaling: Rapid mechano-chemo transduction in heart. Science 333, 1440–1445 (2011). [DOI] [PubMed] [Google Scholar]
- 52.Amberg GC, Santana LF, Downregulation of the BK channel α1 subunit in genetic hypertension. Circ. Res 93, 965–971 (2003). [DOI] [PubMed] [Google Scholar]
- 53.Amberg GC, Bonev AD, Rossow CF, Nelson MT, Santana LF, Modulation of the molecular composition of large conductance, Ca2+ activated K+ channels in vascular smooth muscle during hypertension. J. Clin. Invest 112, 717–724 (2003). [DOI] [PMC free article] [PubMed] [Google Scholar]
- 54.Rueda A, Fernandez-Velasco M, Benitah J-P, Gomez AM, Abnormal Ca2+ spark/STOC coupling in cerebral artery smooth muscle cells of obese type 2 diabetic mice. PLOS ONE 8, e53321 (2013). [DOI] [PMC free article] [PubMed] [Google Scholar]
- 55.Beavers DL, Landstrom AP, Chiang DY, Wehrens XHT, Emerging roles of junctophilin-2 in the heart and implications for cardiac diseases. Cardiovasc. Res 103, 198–205 (2014). [DOI] [PMC free article] [PubMed] [Google Scholar]
- 56.Corona BT, Balog EM, Doyle JA, Rupp JC, Luke RC, Ingalls CP, Junctophilin damage contributes to early strength deficits and EC coupling failure after eccentric contractions. Am. J. Physiol. Cell Physiol 298, C365–C376 (2010). [DOI] [PubMed] [Google Scholar]
- 57.Schneider CA, Rasband WS, Eliceiri KW, NIH Image to ImageJ: 25 years of image analysis. Nat. Methods 9, 671–675 (2012). [DOI] [PMC free article] [PubMed] [Google Scholar]
- 58.Carpenter AE, Jones TR, Lamprecht MR, Clarke C, Kang IH, Friman O, Guertin DA, Chang JH, Lindquist RA, Moffat J, Golland P, Sabatini DM, CellProfiler: Image analysis software for identifying and quantifying cell phenotypes. Genome Biol. 7, R100 (2006). [DOI] [PMC free article] [PubMed] [Google Scholar]
- 59.Lachmanovich E, Shvartsman DE, Malka Y, Botvin C, Henis YI, Weiss AM, Colocalization analysis of complex formation among membrane proteins by computerized fluorescence microscopy: Application to immunofluorescence co-patching studies. J. Microsc 212, 122–131 (2003). [DOI] [PubMed] [Google Scholar]
Associated Data
This section collects any data citations, data availability statements, or supplementary materials included in this article.
Supplementary Materials
Fig. S1. Method used to estimate SR-PM separation distance.
Fig. S2. Z-stack analysis of interactions between the SR and microtubule arches.
Fig. S3. Microtubules underlie the peripheral SR.
Fig. S4. Overlap of RyR2 channel clusters with tubulin.
Fig. S5. Nocodazole treatment has no effect on total SR Ca2+ store load or Ca2+ spark frequency.
Fig. S6. BKα and RyR2 nearest neighbor analysis.
Fig. S7. Actin disruption does not alter STOC frequency.
Fig. S8. Inhibition of BK channels increases myogenic tone.
Fig. S9. Effects of nocodazole on passive luminal diameter.
Movie S1. Microtubule depolymerization increases the separation distance between the SR and the plasma membrane.
Movie S2. Microtubule structure in freshly isolated smooth muscle cells.
Movie S3. SR structure in freshly isolated smooth muscle cells.