

Abstract
The objective of this study was to assess the association between vitamin D and cardiometabolic markers in 2 indigenous communities from similar ethnic backgrounds, but living at different altitudes. A cross-sectional study compared 152 (72 females) indigenous schoolchildren from San Antonio de los Cobres (SAC), 3750 m above sea level, with 175 (86 females) from Chicoana (CH), 1400 m above sea level, mean age 9 years. Anthropometry, blood pressure, lipids, glucose, insulin, and vitamin D were assessed in spring season. The prevalence of children’s overweight/obesity was significantly lower in SAC, 9.2% (13), than in CH, 41.5% (71). There was a significantly higher prevalence of vitamin D deficiency (<20 ng/mL) in SAC (n = 103, 67.7%) than in CH (n = 62, 36.3%). SAC showed an inverse correlation between vitamin D and insulinemia (r = −0.17, P < .05), whereas CH showed an inverse correlation between vitamin D and systolic blood pressure (r = −0.19, P < .05), z-BMI (body mass index; r = −0.25, P < .01), triglycerides (r = −0.15, P < .05), glucose (r = −0.35, P < .05), and insulinemia (r = −0.24, P < .01). Multiple linear regression analysis showed that vitamin D (β = −.47; R2 = .21) was significantly associated with SAC location, adjusted for confounding variables. Vitamin D levels were significantly and directly associated with altitude and inversely with metabolic markers, suggesting that populations living at high altitudes are at higher risk for future cardiovascular diseases.
Keywords: vitamin D, cardiometabolic markers, indigenous schoolchildren, high altitudes
Background
Different studies have found that a risk factor for metabolic syndrome is exposure to high altitudes leading to ambient hypoxia.1,2 The partial pressure of oxygen at high altitudes (>2500 m above sea level) is reduced when compared with that at sea level, deriving in chronic hypoxemia in highlanders.3 Furthermore, a previous study performed by our group in San Antonio de los Cobres (SAC) found that indigenous Andean Argentinean children living at 3750 m had a higher prevalence of dyslipidemia compared with children living at sea level.4 Also, we found that children from this community had low vitamin D concentrations.5 Sunlight exposure is the main source of vitamin D.6 However, small amounts of vitamin D can also be obtained from various foods such as fatty fish and fortified milk products.6 Vitamin D deficiency could additionally be related to dark skin, reduced sun exposure, high altitudes, and seasonal variation.7,8 Even though SAC has sunny weather, it is often cold and windy due to its high altitudes.5 Therefore, children wear more layers and often play inside, leading to low vitamin D concentrations.5 Furthermore, the lower skin temperature due to cold weather is associated with slower conversion rates of pro-vitamin D3 into stable vitamin D3, even in the presence of sufficient ultraviolet-B irradiation.6 The likely relationship between vitamin D and metabolic syndrome have been explored in other studies.6,9 Children who were vitamin D deficient had higher risk of higher blood glucose level, elevated blood pressure (BP), and metabolic syndrome.6 Beta-cell function is influenced by vitamin D, which increases insulin release by regulating calcium flux and by calcium-independent mechanisms in β-cells.10 In addition, vitamin D status may alter glucose levels either by direct effect on insulin resistance through parathyroid hormone levels, or insulin receptor expression, or by an indirect effect through glucose clearance or uptake regulating fasting glucose levels.11 Unfortunately, there is little information about the association between vitamin D, lifestyle behaviors, metabolic markers, and altitude in indigenous children from similar ethnic backgrounds, but living at different altitudes. The objective of this study was to assess the association between vitamin D and cardiometabolic markers in 2 indigenous communities from similar ethnic backgrounds, but living at different altitudes.
Methods
A cross-sectional study was designed to compare metabolic markers between 2 indigenous communities living at different altitudes. The study was approved by the Human Rights Committee of the University of Buenos Aires. Each parent or legal guardian gave written informed consent after an explanation of the study and before its initiation.
The populations of SAC and Chicoana (CH) have similar ethnic backgrounds but they live at different altitudes. The details of the SAC community have been reported previously.4 However, a brief description is included in this article. SAC is a village in the Andes mountains, 3750 m above sea level, with 4274 inhabitants.12 Ninety-eight percent of the SAC population consists of Diaguitas descendants. The SAC community was ethnically homogenous, since there were no intermarriages between ethnic groups. CH is a village in the southwest of the Lerma Valley, 170 km from SAC. It is 1432 m above sea level and has 4202 inhabitants.12 The population of CH is also of Diaguita descent. Despite CH’s proximity to Salta, the capital of the province, CH’s community also has no history of mixed marriages, and therefore has also maintained its ethnic homogeneity.
The study assessed demographic data, lifestyle behaviors, anthropometric measurements, BP, and biochemical data. Health care professionals performed all measurements. Sociodemographic characteristics recorded included age, level of education, and the presence of a refrigerator or a dirt floor in the house. The absence of a refrigerator and the presence of a dirt floor are indicators of a very low socioeconomic level by the National Statistics and Censuses Institute of Argentina.12 The same personnel and equipment were used to complete validated questionnaires on lifestyle behaviors and measure BP and anthropometry in the 2 villages.13 A simple 5-level index ranked participants’ daily consumption of vegetables or fresh fruits portions, glasses of milk, sweetened beverages, and television viewing.13 One out of the 3 elementary schools existing in SAC was selected by simple randomization in November 2014. Another elementary school of similar socioeconomic status was chosen among the elementary schools located in CH in November 2016. All children from each school were invited to participate. The overall individual response rate was 90%. Assuming that the prevalence of vitamin D insufficiency was 98% in SAC children, the sample size of 152 SAC children would give a power of 0.80 at a significance level of .05.5 Furthermore, assuming that the prevalence of dyslipidemia was close to 30%, our sample size ensures a power of approximately 80% considering an effect size of 0.1 and a significance level of .05.4
Exclusion criteria included the following: (1) missing anthropometric measurements, BP, or biochemical data; (2) the use of medication that would affect BP, lipids, and glucose levels; (3) children who did not fast; and (4) the informed consent form not being signed. Participants included in our study sample had no significant difference in socioeconomic level, age, body mass index (BMI), and waist circumference, with those who were excluded because of missing data.
Height and weight measurements were collected with subjects wearing light clothing and without shoes. BMI was calculated as weight in kilograms divided by height in meters squared. BP was recorded with the child in the seated position by use of a mercury sphygmomanometer, with the child’s right forearm horizontal on a table. The cuffs sizes were adjusted for differences in arm circumference and height. At a period of 1 to 2 minutes, 2 measures were taken. The cuff was totally deflated between the 2 measures.14 Hypertension was defined as the average of the values of systolic BP and/or diastolic BP ≥95th percentile based on age, sex, and height percentiles.14
BMI z-score and percentiles were determined according to Centers for Disease Control and Prevention norms.15 Children were classified as underweight (<5th percentile), normal weight (5th to <85th percentile), overweight (85th to <95th percentile), or obese (≥95th percentile).15
Blood samples were obtained from subjects after a 10-hour overnight fast. All samples were analyzed in the same laboratory. We had stored SAC and CH serum samples at −70°C and both groups were assessed together. Lipids were analyzed by standardized methods using the Architect C 16000 instrument (Toshiba, Kanagawa, Japan) and dedicated reagents (Abbott Laboratories, Chicago, IL). Inter-assay coefficients of variation were the following: cholesterol 0.62% and 0.95%; high-density lipoprotein cholesterol (HDL-C) 2.00% and 3.08%; and triglycerides 0.87% and 1.11%, respectively. Plasma glucose was assessed using standardized techniques (Roche Diagnostics, Mannheim, Germany). Insulin levels were estimated by radioimmunoassay (Linco Laboratories, St Charles, MO). HOMA-IR was validated and was strongly correlated with insulin resistance.16 Serum 25(OH)D levels were measured using a radioimmunoassay kit (DiaSorin, Stillwater, MN); the intra-assay coefficient of variation was 8.6% to 12.5%, and the inter-assay coefficient of variation was 8.2% to 11.0%. Dyslipidemia was defined according to the National Institute of Health’s Expert Panel on Integrated Guidelines for Cardiovascular Health and Risk Reduction in Children and Adolescents. Total 25(OH)D insufficiency, deficiency, and severe deficiency were defined as levels 20 to <30 ng/mL, 10 to <20 ng/mL, and <10 ng/mL, respectively. Optimal levels were defined as >30 ng/mL.17
Data Analysis
Descriptive statistics for raw variables are described as mean ± SD or median (quartiles I- III). Chi-squared tests were used to compare proportions. When more than 20% of the cells had expected frequencies <5, a Fisher’s exact test was used. The fit to a normal distribution of continuous variables was assessed using the Shapiro-Wilks test. When comparing 2 groups with normally distributed data, a Student t test was performed. Variables with a skewed distribution (triglycerides and insulin levels) were logarithmically transformed for analysis. After log transformation, the data were tested again to confirm the findings. When comparing vitamin D across deficiency groups, due to the differences in sample sizes, the nonparametric Kruskal-Wallis test was also used and results did not change. Bonferroni’s adjustment was carried out when many comparisons were performed.
To determine the correlation between 2 variables, Kendall or Spearman coefficients were used depending on the variables of each case. The main goal of the study was to examine the association between vitamin D and metabolic markers in 2 indigenous communities from similar ethnic backgrounds, but living at different altitudes. Multiple linear regression analyses were performed to analyze the association between vitamin D levels and metabolic markers adjusted for confounding variables. Multiple logistic regression analysis was performed. The odds ratio and 95% confidence interval were used to estimate the association between altitude, age, sex, and BMI selected as independent variables, and low vitamin D levels as a dependent variable. P values of <.05 were considered statistically significant. Analyses were performed using the SPSS (IBM, Chicago, IL) statistical software package SPSS version 22.0.
Results
In the SAC community, 159 children were invited to participate in the study. However, 1 did not have the informed consent signed and 6 had missing BP data and were excluded. In the CH community, 189 children were invited to participate in the study. However, 4 did not have the informed consent signed, 4 had missing BP data, and 6 had missing biochemical data and were excluded from the study. A cross-sectional study compared 152 (72 females) indigenous schoolchildren from SAC, 3750 m above sea level, with 175 (86 females) from CH, 1400 m above sea level. Seventy-three percent of SAC and 43% of CH parents had no high school education (P < .01), and 14% of SAC and 3% of CH families did not have a refrigerator at home (P < .01). All participating families came from a low socioeconomic class; however, SAC families belonged to a lower socioeconomic level than CH.
Lifestyle Behaviors
The reported mean daily intake of sugary beverages was 2.8 ± 1.3 glasses/day in SAC versus 3.2 ± 4.2 glasses/day in CH children (P > .05). In both communities, the sugary beverages consumed by children were juices made from concentrated powder diluted in water. Fruit and vegetable intake was significantly lower in SAC (2.4 ± 0.9 servings/day) than in CH (2.7 ± 1.3 servings/day). Milk intake among children was significantly lower in SAC (1.7 ± 1.0 glasses/day) than in CH (2.1 ± 1.2 glasses/day; P = .003). SAC children watched significantly fewer hours of television (2.4 ± 1.2 h/d) than CH children (2.5 ± 1.2 h/d; P < .01). Approximately 15% (n = 21) of SAC children versus 31.5% (n = 51) of CH children drank 3 or more glasses of milk per day (P < .01); 2% (n = 3) of children in SAC versus 7% (n = 12) in CH skipped breakfast (P > .05); 59% (n = 90) of children in SAC versus 70.3% (n = 123) in CH had a television in their rooms (P = .02).
There was an inverse and significant association between vitamin D levels and television viewing for more than 2 h/d (r = −0.18; P < .01), as well as milk intake of more than 2 glasses/day (r = −0.13; P < .05).
Clinical and Metabolic Characteristics in SAC and CH Children
Table 1 describes clinical characteristics of the sample. There was no significant difference in age between SAC and CH children. The age range was between 4 and 13 years in SAC and between 4 and 14 years in CH. However, mean weight, height, and BMI, adjusted for age and sex, were significantly lower in SAC than in CH children. In contrast, systolic and diastolic BPs adjusted for age, sex, and height were significantly higher in SAC than in CH children.
Table 1.
Clinical Characteristicsa.
| SAC (N = 152) | CH (N = 175) | |
|---|---|---|
| Age in years at screening | 9.37 ± 2.11 | 9.02 ± 2.14 |
| Birth weight (kg)* | 3.07 ± 0.51 | 3.22 ± 0.63 |
| Waist circumference (cm)** | 60.06 ± 8.29 | 67.52 ± 13.05 |
| Body weight (kg) | 29.25 ± 8.81 | 37.52 ± 13.74 |
| Height (cm)** | 130.4 ± 12.41 | 137.64 ± 13.41 |
| z-Height** | −0.80 ± 0.85 | 0.75 ± 1.10 |
| BMI (kg/m2)** | 16.83 ± 2.69 | 19.27 ± 4.41 |
| Z-BMIb,** | −0.14 ± 0.99 | 0.68 ± 1.21 |
| Systolic: BP (mm Hg)** | 87.09 ± 13.84 | 69.65 ± 14.35 |
| z-systolic: BPc,** | 87.34 ± 13.65 | 69.39 ± 13.94 |
| Diastolic: BP (mm Hg)** | 57.75 ± 13.77 | 47.58 ± 10.96 |
| z-diastolic: BPc,** | 58.37 ± 13.85 | 47.99 ± 10.95 |
Abbreviations: SAC, San Antonio de los Cobres; CH, Chicoana; BMI, body mass index; BP, blood pressure.
Data are presented as mean ± SD. Z-score is a quantitative measure of the deviation of a specific variable taken from the mean of that population.
Centers for Disease Control and Prevention z-BMI considers age and gender.
z-BP considers age, sex, and height.
P < .05. **P < .01.
Table 2 describes metabolic characteristics of the sample. Vitamin D levels were significantly lower in SAC than in CH children. Glucose levels were significantly higher in SAC than in CH children. Regarding the lipoprotein profile, HDL-C levels were significantly lower in SAC than in CH children, whereas total cholesterol, non-HDL-C, and triglycerides were significantly higher in SAC than in CH. Furthermore, different lipid-related indexes were calculated. Interestingly, total cholesterol/HDL-C, LDL-C/HDL-C, and triglycerides/HDL-C ratios were significantly higher in SAC than in CH children.
Table 2.
Metabolic Characteristicsa.
| SAC (N = 152) | CH (N = 175) | |
|---|---|---|
| Cholesterol, mg/dL** | 157 ± 25 | 148 ± 35 |
| HDL-C, mg/dL** | 46 ± 8 | 48 ± 11 |
| LDL-C, mg/dL** | 90 ± 22 | 83.0 ± 22 |
| Triglycerides** | 104 ± 39 | 88 ± 41 |
| Triglycerides/HDL-C** | 2.4 ± 1.1 | 1.9 ± 1.2 |
| LDL-C/HDL-C** | 2.0 ± 0.6 | 1.8 ± 0.5 |
| Cholesterol/HDL-C** | 3.5 ± 0.7 | 3.1 ± 0.8 |
| Non-HDL-C** | 111.1 ± 24.6 | 99.7 ± 32.4 |
| Glucose, mg/dL** | 90 ± 7 | 80 ± 6 |
| Insulin, IU/dL* | 5.3 ± 2.8 | 6.7 ± 4.8 |
| Vitamin D, ng/mL** | 17.6 ± 5.2 | 22.0 ± 5.1 |
Abbreviations: SAC, San Antonio de los Cobres; CH, Chicoana; HDL-C, high-density lipoprotein cholesterol; LDL-C, low-density lipoprotein cholesterol.
Data are presented as mean ± SD.
P < .05. **P < .01.
The prevalence of children’s overweight/obesity was significantly lower in SAC, 9.2% (13), than in CH, 41.5% (71), children. The prevalence of hypertension was significantly higher in SAC, 13.2% (20), than in CH, 1.8% (3). The prevalence of hypertriglyceridemia was significantly higher in SAC, 42.3% (60), than in CH, 27.5% (47), children. Even though the prevalence of low HDL-C was higher in SAC, 26.8% (38), than in CH, 20.5% (35), the difference did not reach significant levels. There was no significant difference in the prevalence of dyslipidemia between genders in both communities. Five percent (7) of the SAC children had impaired fasting glucose levels (>100 mg/dL to <126 mg/dL). In contrast, none of the CH children had altered fasting glucose levels. None of the children from either group had diabetes.
There was a significantly higher prevalence of vitamin D deficiency (<20 ng/mL) in SAC (n = 103, 67.7%) than in CH (n = 62, 36.3%) children. The prevalence of vitamin D deficiency was not significantly different between genders in both groups. Furthermore, 3 (2.1%) SAC children had a severe deficiency (<10 ng/mL) versus none of the CH children. Only 5 (3.5%) SAC children and 11 (6.4%) CH children had optimal vitamin D levels (≥30 ng/mL). Figure 1 shows the vitamin D levels in SAC and CH children.
Figure 1.
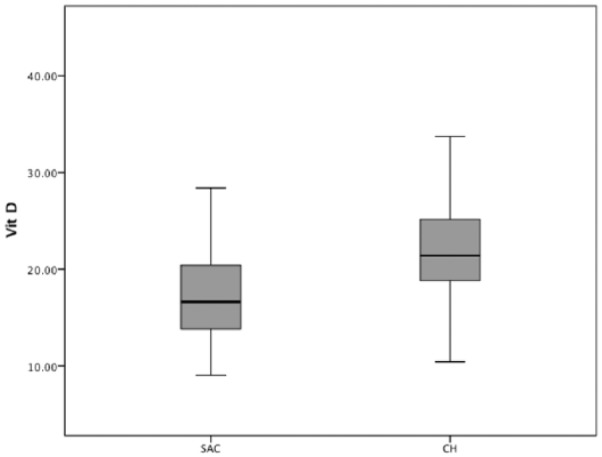
Boxplot. Median vitamin D and interquartile range are presented separately for children in SAC (San Antonio de los Cobres) and CH (Chicoana) of both sexes. The boxes define the 25th and 75th percentiles and enclose the median; the extensions define the range of values.
Factors Associated With Vitamin D Levels
There was an inverse and significant univariate association between vitamin D levels and television viewing for more than 2 h/d (r = −0.18, P < .01). SAC children showed an inverse correlation between vitamin D and insulinemia (r = −0.17, P < .05), whereas CH children showed an inverse correlation between vitamin D and z-BMI (r = −0.25, P < .01), systolic BP (r = −0.19, P < .05), glucose (r = −0.35, P < .01), triglycerides (r = −0.15, P < .05), and insulinemia (r = −0.24, P < .01). Furthermore, multiple linear regression analyses showed significant and inverse associations between vitamin D levels and systolic BP (β = −.29; P < .01; R2 = .12), diastolic BP (β = −.18; P < .01; R2 = .06), triglycerides (β = −.20; P < .01; R2 = .10), triglycerides/HDL-C (β = −.20; P < .01; R2 = .08), and glucose (β = −.30; P < .01; R2 = .23), whereas HDL-C (β = .12; P < .01; R2 = .05) was significantly and directly associated with vitamin D, adjusted for age, sex, z-BMI, and milk intake.
Multiple linear regression analyses, including location as an independent variable, showed that SAC location was significantly associated with vitamin D, adjusted for age, sex, and z-BMI (Table 3). In addition, multiple logistic regression analysis showed that SAC children had 7-fold the odds (odds ratio = 7.02; 95% confidence interval = 4.05-12.19) of having vitamin D deficiency adjusted for age, sex, and BMI.
Table 3.
Multiple Linear Regression Analysisa.
| Variable | B (Standardized Coefficient) | t | Significance | R 2 |
|---|---|---|---|---|
| Age | −0.165 | −3.239 | .001 | 0.21 |
| z-BMI | −0.161 | −2.957 | .003 | |
| Sex | −0.07 | −1.382 | .168 | |
| Location (SAC-CH) | −0.47 | 8.135 | <.01 |
Abbreviations: BMI, body mass index; SAC, San Antonio de los Cobres; CH, Chicoana.
Dependent variable: vitamin D.
Discussion
This cross-sectional study showed that the prevalence of overweight/obesity was significantly lower in SAC than in CH children. However, SAC children had higher BP, glucose, and triglycerides than CH children. Moreover, there was a higher prevalence of vitamin D deficiency in SAC children living at 3750 m than in CH children living at 1400 m. Multiple linear regression analyses showed significant and inverse associations between vitamin D levels and BP, triglycerides, triglycerides/HDL-C, and glucose, whereas HDL-C was significantly and directly associated with vitamin D, adjusted for confounding variables. Furthermore, SAC children had 7-fold the odds of having vitamin D deficiency compared with CH children. As far as we know, this is the first study to examine lifestyle behaviors, metabolic markers, and vitamin D concentrations in children from similar backgrounds living at different altitudes. Vitamin D levels were significantly and directly associated with altitude and inversely with metabolic markers, suggesting that communities living at high altitudes had lower vitamin D levels and higher risk for future cardiometabolic diseases.
The prevalence of overweight/obesity was significantly lower in SAC than in CH indigenous children. Even though all children were from similar backgrounds, SAC children were significantly shorter than CH children. There was a lower prevalence of unhealthy behaviors in SAC children than in CH, which could partly explain the lower prevalence of obesity in SAC. Accordingly, a study performed on elementary school children in 8 European countries demonstrated that children were more likely to be obese if they skipped breakfast or ate breakfast in front of the television.18 It is worth noting that milk intake was associated with higher BMI and triglycerides in indigenous children. Although the intake of some components of milk, such as saturated fat, leads to detrimental consequences on weight status in children,19,20 other components, such as calcium, may have beneficial effects.21,22 However, most of the studies about milk consumption were done in European populations and not in indigenous children.23 Thus, the fact that milk intake was associated with higher BMI and triglycerides may be explained by the habit of drinking non–skimmed milk in Salta, which is not fortified with vitamin D and has more saturated fat.
Growth at high altitudes is a product of hypoxia, genetic and developmental factors, nutrition, physical activity, and other socioeconomic and environmental variables.24 Individuals living at high altitudes in the Andes have shown a decrease in height and weight in the first 2 years of life continuing into childhood and adolescence.24 This trend brings about a 1- to 2-year delay in height and a less marked adolescent growth spurt and stature remaining shorter in adulthood.24,25 Accordingly, SAC children were significantly shorter than CH children.
High altitudes are also associated with high leptin levels, which might increase sympathetic nerve activity that is related to adipose tissue.26 The sympathetic system is a main regulator of leptin production in adipose tissue. Higher leptin concentrations could partly explain the lower BMI in children who live at high altitudes, such as SAC children.26-28 Moreover, exposure to hypoxia has been shown to stimulate hypoxia inducible factor 1, which seems to be a main regulator for the leptin’s expression. Chronic exposure to high altitude results in increased sympathetic and decreased parasympathetic activity, which leads to elevated BP.30
Subjects living at high altitude had a lower partial pressure of oxygen due to hypoxic conditions.30 Therefore, in order to avoid the reduction in arterial oxygen content, cardiac output is increased through sympathetic activation.30 Consistently, we found that SAC children had a higher prevalence of hypertension than children from CH probably due to chronic hypoxia because of high altitude.
Many communities have low vitamin D levels, even though they are located in sunny climates.31,32 Because SAC is at high altitude, the weather is often cold and windy so children wear layers and stay inside, resulting in less exposure to the sun.5 The principal source of vitamin D is sunlight. The relationship between sedentary habits and lower vitamin D levels is likely due to less time being spent outdoors.33,34 Higher vitamin D levels reflect healthier lifestyles.33,34 The present study shows that even though both communities belong to similar ethnic backgrounds, SAC children, 3750 m, had a significantly higher prevalence of vitamin D deficiency. A meta-analysis of 12 cross-sectional studies of international databases also showed that vitamin D was inversely associated with metabolic markers such as triglycerides, total cholesterol, and LDL-C and directly associated with HDL-C in children and adolescents.35 A large study in Caucasian children found that low vitamin D levels were related to obesity, metabolic syndrome, and hypertension.36 Consistently, we found significantly and inverse associations between vitamin D levels and BP, triglycerides, triglycerides/HDL-C, and glucose adjusted for age, sex, BMI, and milk intake in indigenous children. Furthermore, vitamin D was directly associated with HDL-C, indicating that low vitamin D was associated with higher risk of future cardiometabolic diseases in indigenous children. Low vitamin D level predisposes to glucose abnormalities by disturbing the function of pancreatic β-cells, impairing insulin sensitivity, and inducing systemic inflammation.37,38 Potential benefits of vitamin D include suppression of inflammation such as the decrease of expression of multiple inflammatory cytokines, including tumor necrosis factor-α, interleukin (IL)-6, IL-1, and IL-8.39
Strengths
This study adds to previous research by examining 2 similar indigenous communities living at different altitudes. Furthermore, there was a high response rate of the children, and the data were collected through measurements taken by our team rather than self-reported by school children. The measurements of vitamin D levels were performed in a single laboratory, which ensures low variability. Furthermore, the measurement of lifestyle behaviors enhances the results of the study. Finally, we used regression models and simultaneous adjustment of confounding variables.
Limitations
First, this cross-sectional study cannot imply a causal relationship. Second, this study lacked information regarding family history of metabolic diseases, pubertal status, and physical activity that are known to have an impact on metabolic diseases. Third, the study of the CH sample was not concurrent with that of the SAC sample as both communities were evaluated in different years (SAC children in November 2014 and CH children in November 2016). Fourth, the assessment of lifestyle behaviors was made by a food frequency questionnaire containing only a few items and not by a 24-hour recall method. Last, the conclusions of this study, conducted in a sample of indigenous SAC and CH children, might not extend to children from other communities without confirmation.
Conclusion
Indigenous SAC children have a higher prevalence of vitamin D deficiency than children from a similar background, but living at lower altitudes. Furthermore, vitamin D levels were significantly and directly associated with altitude and inversely with metabolic markers, suggesting that populations living at high altitudes are at higher risk for future cardiovascular disease. Thus, the early detection of vitamin D deficiency might be important as it can be corrected by medical intervention. Longitudinal studies will help discern whether vitamin D is causally related to metabolic risk in children living at high altitudes and whether vitamin D supplementation in this group may decrease the process.
Footnotes
Author Contributions: VH and CDG had the core idea for this study. All authors either analyzed the data or interpreted the results. VH wrote the draft and the article. All other authors participated in the review of the literature, text editing, and finalization of the manuscript. All authors read and approved the final manuscript.
Declaration of Conflicting Interests: The author(s) declared no potential conflicts of interest with respect to the research, authorship, and/or publication of this article.
Funding: The author(s) received no financial support for the research, authorship, and/or publication of this article.
Ethical Approval: All procedures were performed according to the Declaration of Helsinki and approved by the Ethics Committee of the University of Buenos Aires. This study was also approved by the Salta Ministry of Public Health (Approval Number 4518).
Informed Consent: Each parent signed the informed consent form after an explanation of the study.
ORCID iD: Valeria Hirschler  https://orcid.org/0000-0002-9533-9343
References
- 1. Brito J, Siqués P, León-Velarde F, De La Cruz JJ, López V, Herruzo R. Chronic intermittent hypoxia at high altitude exposure for over 12 years: assessment of hematological, cardiovascular, and renal effects. High Alt Med Biol. 2007;8:236-244. [DOI] [PubMed] [Google Scholar]
- 2. Wolfel EE, Selland MA, Mazzeo RS, Reeves JT. Systemic hypertension at 4,300 m is related to sympathoadrenal activity. J Appl Physiol (1985). 1994;76:1643-1650. [DOI] [PubMed] [Google Scholar]
- 3. Vargas E, Spielvogel H. Chronic mountain sickness, optimal hemoglobin, and heart disease. High Alt Med Biol. 2006;7:138-149. [DOI] [PubMed] [Google Scholar]
- 4. Hirschler V, Maccallini G, Aranda C, Molinari C; San Antonio de los Cobres Study Group. Dyslipidemia without obesity in indigenous Argentinean children living at high altitude. J Pediatr. 2012;161:646-651. [DOI] [PubMed] [Google Scholar]
- 5. Hirschler V, Maccallini G, Molinari C, Aranda C; San Antonio de los Cobres Study Group. Low vitamin D concentrations among indigenous Argentinean children living at high altitudes. Pediatr Diabetes. 2013;14:203-210. [DOI] [PubMed] [Google Scholar]
- 6. Hossein-nezhad A, Holick MF. Vitamin D for health: a global perspective. Mayo Clin Proc. 2013;88:720-755. [DOI] [PMC free article] [PubMed] [Google Scholar]
- 7. Kienreich K, Tomaschitz A, Verheyen N, et al. Vitamin D and cardiovascular disease. Nutrients. 2013;5:3005-3021. [DOI] [PMC free article] [PubMed] [Google Scholar]
- 8. Poh BK, Rojroongwasinkul N, Nguyen BK, et al. ; SEANUTS Study Group. 25-Hydroxy-vitamin D demography and the risk of vitamin D insufficiency in the South East Asia Nutrition Surveys (SEANUTS). Asia Pac J Clin Nutr. 2016;25:538-548. [DOI] [PubMed] [Google Scholar]
- 9. Li YC, Qiao G, Uskokovic M, Xiang W, Zheng W, Kong J. Vitamin D: a negative endocrine regulator of the renin-angiotensin system and blood pressure. J Steroid Biochem Mol Biol. 2004;89-90:387-392. [DOI] [PubMed] [Google Scholar]
- 10. Danescu LG, Levy S, Levy J. Vitamin D and diabetes mellitus. Endocrinology. 2009;35:11-17. [DOI] [PubMed] [Google Scholar]
- 11. Liu E, McKeown NM, Pittas AG, et al. Predicted 25-hydroxyvitamin D score and change in fasting plasma glucose in the Framingham offspring study. Eur J Clin Nutr. 2012;66:139-141. [DOI] [PMC free article] [PubMed] [Google Scholar]
- 12. Instituto Nacional de Estadística y Censos de la Republica Argentina. Censo 2010. https://www.indec.gov.ar/nivel4_default.asp?id_tema_1=2&id_tema_2=41&id_tema_3=135. Accessed December 18, 2018.
- 13. Hirschler V, Oestreicher K, Beccaria M, Hidalgo M, Maccallini G. Inverse association between insulin resistance and frequency of milk consumption in low-income Argentinean school children. J Pediatr. 2009;154:101-105. [DOI] [PubMed] [Google Scholar]
- 14. Flynn JT, Kaelber DC, Baker-Smith CM, et al. ; Subcommittee on Screening and Management of High Blood Pressure in Children. Clinical practice guideline for screening and management of high blood pressure in children and adolescents. Pediatrics. 2017;140:e20171904. [DOI] [PubMed] [Google Scholar]
- 15. Kuczmarski RJ, Ogden CL, Guo SS, et al. 2000 CDC growth charts for the United States: methods and development. Vital Health Stat 11. 2002;(246):1-190. [PubMed] [Google Scholar]
- 16. McAuley KA, Williams SM, Mann JI, et al. Diagnosing insulin resistance in the general population. Diabetes Care. 2001;24:460-464. [DOI] [PubMed] [Google Scholar]
- 17. National Academy of Sciences. Dietary reference intakes for calcium and vitamin D. http://www.iom.edu/Reports/2010/Dietary-Reference-Intakes-for-Calcium-and-Vitamin-D.aspx. Accessed December 18, 2018.
- 18. Bjørnarå HB, Vik FN, Brug J, et al. The association of breakfast skipping and television viewing at breakfast with weight status among parents of 10-12-year-olds in eight European countries; the ENERGY (EuropeaN Energy balance Research to prevent excessive weight Gain among Youth) cross-sectional study. Public Health Nutr. 2014;17:906-914. [DOI] [PMC free article] [PubMed] [Google Scholar]
- 19. Dixon LB, Pellizzon MA, Jawad AF, Tershakovec AM. Calcium and dairy intake and measures of obesity in hyper- and normocholesterolemic children. Obes Res. 2005;13:1727-1738. [DOI] [PubMed] [Google Scholar]
- 20. Wiley AS. Dairy and milk consumption and child growth: is BMI involved? An analysis of NHANES 1999-2004. Am J Hum Biol. 2010;22:517-525. [DOI] [PubMed] [Google Scholar]
- 21. Dror DK, Allen LH. Dairy product intake in children and adolescents in developed countries: trends, nutritional contribution, and a review of association with health outcomes. Nutr Rev. 2014;72:68-81. [DOI] [PubMed] [Google Scholar]
- 22. Rosell M, Johansson G, Berglund L, Vessby B, de Faire U, Hellenius ML. Associations between the intake of dairy fat and calcium and abdominal obesity. Int J Obes Relat Metab Disord. 2004;28:1427-1434. [DOI] [PubMed] [Google Scholar]
- 23. Lin SL, Tarrant M, Hui LL, et al. The role of dairy products and milk in adolescent obesity: evidence from Hong Kong’s “Children of 1997” birth cohort. PLoS One. 2012;7:e52575. [DOI] [PMC free article] [PubMed] [Google Scholar]
- 24. Moore LG, Niermeyer S, Zamudio S. Human adaptation to high altitude: regional and life-cycle perspectives. Am J Phys Anthropol. 1998;107:25-64. [DOI] [PubMed] [Google Scholar]
- 25. Beall CM, Baker PT, Baker TS, Haas JD. The effects of high altitude on adolescent growth in southern Peruvian Amerindians. Hum Biol. 1997;49:109-124. [PubMed] [Google Scholar]
- 26. Mark AL, Rahmouni K, Correia M, Haynes WG. A leptin-sympathetic-leptin feedback loop: potential implications for regulation of arterial pressure and body fat. Acta Physiol Scand. 2003;177:345-349. [DOI] [PubMed] [Google Scholar]
- 27. Shukla V, Singh SN, Vats P, Singh VK, Singh SB, Banerjee PK. Ghrelin and leptin levels of sojourners and acclimatized lowlanders at high altitude. Nutr Neurosci. 2005;8:161-165. [DOI] [PubMed] [Google Scholar]
- 28. Tschöp M, Strasburger CJ, Töpfer M, et al. Influence of hypobaric hypoxia on leptin levels in men. Int J Obes Relat Metab Disord. 2000;24(suppl 2):S151. [DOI] [PubMed] [Google Scholar]
- 29. Sierra-Johnson J, Romero-Corral A, Somers VK, Johnson BD. Effect of altitude on leptin levels, does it go up or down? J Appl Physiol (1985). 2008;105:1684-1685. [DOI] [PubMed] [Google Scholar]
- 30. Howden R, Kleeberger SR. Genetic and environmental influences on gas exchange. Compr Physiol. 2012;2:2595-2614. [DOI] [PubMed] [Google Scholar]
- 31. Peters BS, dos Santos LC, Fisberg M, Wood RJ, Martini LA. Prevalence of vitamin D insufficiency in Brazilian adolescents. Ann Nutr Metab. 2009;54:15-21. [DOI] [PubMed] [Google Scholar]
- 32. Nsiah-Kumi PA, Erickson JM, Beals JL, et al. Vitamin D insufficiency is associated with diabetes risk in native American children. Clin Pediatr (Phila). 2012;51:146-153. [DOI] [PubMed] [Google Scholar]
- 33. Hyppönen E, Power C. Hypovitaminosis D in British adults at age 45 y: nationwide cohort study of dietary and lifestyle predictors. Am J Clin Nutr. 2007;85:860-868. [DOI] [PubMed] [Google Scholar]
- 34. Jääskelainen T, Knekt P, Marniemi J, et al. Vitamin D status is associated with sociodemographic factors, lifestyle and metabolic health. Eur J Nutr. 2013;52:513-525. [DOI] [PubMed] [Google Scholar]
- 35. Kelishadi R, Farajzadegan Z, Bahreynian M. Association between vitamin D status and lipid profile in children and adolescents: a systematic review and meta-analysis. Int J Food Sci Nutr. 2014;65:404-410. [DOI] [PubMed] [Google Scholar]
- 36. Pacifico L, Anania C, Osborn JF, et al. Low 25(OH)D3 levels are associated with total adiposity, metabolic syndrome, and hypertension in Caucasian children and adolescents. Eur J Endocrinol. 2011;165:603-611. [DOI] [PubMed] [Google Scholar]
- 37. Chiu KC, Chu A, Go VL, Saad MF. Hypovitaminosis D is associated with insulin resistance and beta cell dysfunction. Am J Clin Nutr. 2004;79:820-825. [DOI] [PubMed] [Google Scholar]
- 38. Li YX, Zhou L. Vitamin D deficiency, obesity and diabetes. Cell Mol Biol (Noisy-le-grand). 2015;61:35-38. [PubMed] [Google Scholar]
- 39. Giulietti A, van Etten E, Overbergh L, Stoffels K, Bouillon R, Mathieu C. Monocytes from type 2 diabetic patients have a proinflammatory profile. 1,25-Dihydroxyvitamin D(3) works as anti-inflammatory. Diabetes Res Clin Pract. 2007;77:47-57. [DOI] [PubMed] [Google Scholar]