

Abstract
Context:
Reliable quantitative measure of meditation is still elusive. Although electroencephalogram (EEG) and heart rate variability (HRV) are known as quantitative measures of meditation, effects of meditation on EEG and HRV may well take long time as these measures are involuntarily controlled. Effect of mediation on respiration is well known; however, quantitative measures of respiration during meditation have not been studied.
Aims:
Breath rate variability (BRV) as an alternate measure of meditation even over a short duration is proposed. The main objective of this study is to test the hypothesis that BRV is a simple measure that differentiates between meditators and nonmeditators.
Settings and Design:
This was a nonrandomized, controlled trial. Volunteers meditate in their natural habitat during signal acquisition.
Subjects and Methods:
We used Photo-Plythysmo-Gram (PPG) signal acquisition system from BIO-PAC and recorded video of chest and abdomen movement due to respiration during a short meditation (15 min) session for 12 individuals (all males) meditating in a relaxed sitting posture. Seven of the 12 individuals had substantial experience in meditation, while others are controls without any experience in meditation. Respiratory signal from PPG signal was derived and matched with that of the video respiratory signal. This derived respiratory signal is used for calculating BRV parameters in time, frequency, nonlinear, and time-frequency domain.
Statistical Analysis Used:
First, breath-to-breath interval (BBI) was calculated from the respiration signal, then time domain parameters such as standard deviation of BBI (SDBB), root mean square value of SDBB (RMSSD), and standard deviation of SDBB (SDSD) were calculated. We performed spectral analysis to calculate frequency domain parameters (power spectral density [PSD], power of each band, peak frequency of each band, and normalized frequency) using Burg, Welch, and Lomb–Scargle (LS) method. We calculated nonlinear parameters (sample entropy, approximate entropy, Poincare plot, and Renyi entropy). We calculated time frequency parameters (global PSD, low frequency-high frequency [LF-HF] ratio, and LF-HF power) by Burg LS and wavelet method.
Results:
The results show that the mediated individuals have high value of SDSD (+24%), SDBB (+29%), and RMSSD (+26%). Frequency domain analysis shows substantial increment in LFHF power (+73%) and LFHF ratio (+33%). Nonlinear parameters such as SD1 and SD2 were also more (>20%) for meditated persons.
Conclusions:
As compared to HRV, BRV can provide short-term effect on anatomic nervous system meditation, while HRV shows long-term effects. Improved autonomic function is one of the long-term effects of meditation in which an increase in parasympathetic activity and decrease in sympathetic dominance are observed. In future works, BRV could also be used for measuring stress.
Keywords: Breath awareness and yoga, effect of meditation, respiration awareness meditation
Introduction
Heart rate and pulse rate are involuntary parameters while breath rate is both voluntary and involuntary. How much of breath rate is voluntarily controlled and involuntarily controlled could be altered with simple practice such as meditation. In biomedical literature, pulse, blood pressure, and temperature are the most frequently recorded vital parameters, while the respiration rate is the least although respiratory rate shows to be an early and sensitive detector of deterioration.[1]
Breathing patterns and techniques are regularly supported for stress management, relaxation, psycho-physiological state control, and organ functional improvement.[2] There is a supportive balance in breathing pressure with breathing, which can be easily disturbed by excitatory nervous system arousal such as stress. Meditation may reduce or alleviate some of the chronic negative effects of stress. The differentiation between voluntary and automatic (metabolic) breathing is that automatic breathing requires no attention to maintain, whereas voluntary breathing involves a given amount of focus.[3]
Pranayama breathing is often performed in yoga and meditation. It means the practice of voluntary breath control and refers to inhalation, retention, and exhalation that can be performed quickly or slowly.[4] As such, yoga breathing is considered “an intermediary between the mind and body.”[5]
The purpose of breath training in meditation is not to override the autonomic systems, although there is clear evidence that pranayama breathing techniques can affect oxygen consumption and metabolism.[4] In fact, the aim of pranayama breathing appears to shift the autonomic nervous system away from its sympathetic (excitatory) dominance. Pranayama breathing has been shown to positively affect immune function, hypertension, asthma, autonomic nervous system imbalances, and psychological or stress-related disorders.[4] The research is very clear that breathing exercises can enhance parasympathetic (inhibit neural responses) tone, decrease sympathetic (excitatory) nervous activity, improve respiratory and cardiovascular function, decrease the effects of stress, and improve physical and mental health.[6]
Meditation mainly focuses on voluntary breath regulation, which influences brain functions. It is closely related with mindfulness or breathing awareness. The word “Mindfulness” has been used to refer to a psychological state of awareness. Mindfulness can simply be defined as “moment by moment awareness”.[7]
Affective benefits of meditation help to develop effective emotion regulation in the brain.[7] Meditation promotes metacognitive awareness, decreases rumination via disengagement from perseverative cognitive activities, and enhances attentional capacities through gains in working memory.[8]
Evidence shows that meditation can be inversely correlated with distress contagion with the ability to act with awareness in social situations.[9]
Photoplethysmography is a noninvasive technique for measuring blood volume changes in the blood vessels and has become a popular method for extracting physiological measurements such as HR and SpO2. Effect of breathing can be seen as respiratory sinus arrhythmia on the Photo-Plythysmo-Gram (PPG) signal which modulates amplitude, intensity, and frequency of PPG signal.[10]
There is a feasibility of measuring HR and BR from a cell phone without any additional hardware, only by placing the index finger over the cellphone camera which generates PPG waveform based on the principle of light absorbency by finger tissue.
PPG waveform has two components: a baseline (D.C.) and a pulsatile (A.C.) component lies between 0.5–4 Hz knows as cardiac frequency corresponds to HR between 30 and 240 beats/min.[10] The amplitude of PPG waveform varies with respiratory cycle which can be seen as baseline fluctuation termed as respiratory-induced intensity variation (RIIV).[11]
The low-power frequency with cutoff frequency of 0.5 Hz used to extract the baseline component gives the value of respiration rate. The mechanics of respiration can lead to reduction in tissue blood volume by two mechanisms, The first is by reduction in cardiac output causing a reduction in arterial blood flow, therefore tissue perfusion; the second is by reduction in intrathoracic pressure transmitted through venous system, which siphons the blood from the vascular bed within the tissue.[12] RIIV is closely associated with a reduction in arterial pressure, rather than a backward transmission of reduced venous pressure.[13]
A measure to differentiate meditators from nonmeditators as a first step using breath rate variability (BRV) analysis based on time domain and nonlinear methods can be further useful to measure effective progress of meditation. Heart rate variability (HRV) shows the long-term effects on nervous system while BRV can be a good tool for short-term analysis of anatomic nervous system (ANS) problems.
Subjects and Methods
We compared advanced meditators with a convenience sample of nonmeditators with age group of 55 ± 15 who had great interest in meditation and were willing to participate in the study about the effects of meditation. Seven meditation teachers of “Dhamma setu Vipassana meditation center” with more than 10 years of experience of daily meditation and five without experience of meditation were recruited.
Inclusion criteria
Inclusion criteria for meditators included completion of basic 10 days’ meditation course and has to do regular meditation daily for at least 2 times for 30 min. Experimental individuals should have meditation history. Controls should be of the same age group.
Exclusion criteria
Exclusion criteria included regular alcohol, tobacco, or recreational drug consumption, history of mental illness, current physical illness of any kind, a history of major physical illness, and consumption of any regular prescription medication. Controls should be interested in meditation but have no experience of it.
Protocol
Participants are asked to sit in a comfortable position in a quiet, climate-controlled room.
Before starting the experiment, the participants are asked to take rest for at least 5 min.
PPG sensors are attached to the participants at their index finger, headphones for audio prompting them to continuously aware of their breath, and video camera for recording of chest and abdomen movement during respiration. Participants are asked to close their eyes and breathe normally for 15 min.
Experimental setup
Experimental setup [Figure 1] has been arranged in the laboratory with maintained room temperature of 25°C ± 5°C. Participants have to sit in proper dhyana position with closed eyes. BIO-PAC has been used for PPG signal collection using infrared finger sensor with high cutoff frequency of 0.05 Hz and sampling rate of 200 Hz for 15 min. Logitech Carl Zeiss Tessar 2.0/3.7 2MP Autofocus camera has been used to capture video of chest and abdomen movement during the time of breathing. During the time of data collection, the participant has to be aware about his/her breathing meaning he/she has to notice how air comes to his/her nose and goes to his/her lungs and to the complete body.
Figure 1.
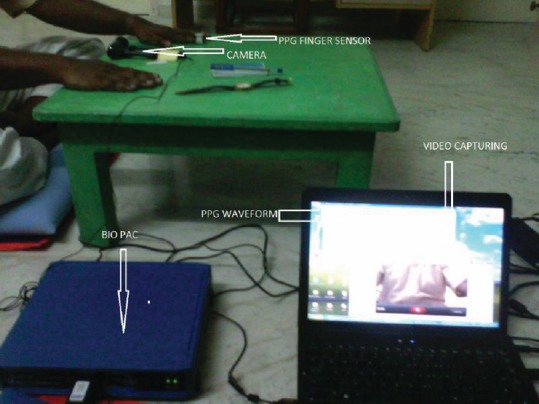
Experimental setup to collect Photo-Plythysmo-Gram data and chest movement video during experimental condition for further processing
Methods
Preprocessing
PPG signal captured using BIO-PAC contains frequency between 0.05 and 66.5 Hz which can be a mixture of ambient light-induced noise, thermal noise, and other unclassified noise. Butterworth low pass filter has been used to remove high-frequency (HF) contrast of PPG signal with cutoff frequency of 5 Hz because PPG signal frequency distributed <5 Hz, since we are interested in respiratory signal variation in PPG that happens at very low frequency (VLF) within the range of 0.1–0.5 Hz.
Respiration wave extraction from Photo-Plythysmo-Gram
In PPG waveform, we detected minimum and maximum peaks of each wave pulse using peak finder algorithm. According to literature, PPG waveform shows variations in intensity, amplitude, and frequency due to respiratory signal.
By joining top peak points of the waveform, we can clearly see respiratory-induced amplitude variation and, by joining minima points of PPG, we can identify the variation in baseline showing RIIV, although it is more convenient to see respiratory-induced frequency variation in frequency domain. Fast Fourier transform (FFT) of PPG gives dominant peak within frequency band of 0.1–0.5 Hz which clearly shows respiratory rate between 6 and 18 breath/min. Respiratory dominant frequency can be clearly seen in that region in Figure 2. We developed an algorithm to find dominant frequency component that lies in the frequency range of respiratory signal, after that band pass filter has been used having cutoff frequency equal to dominant frequency ±10% of the dominant frequency.
Figure 2.
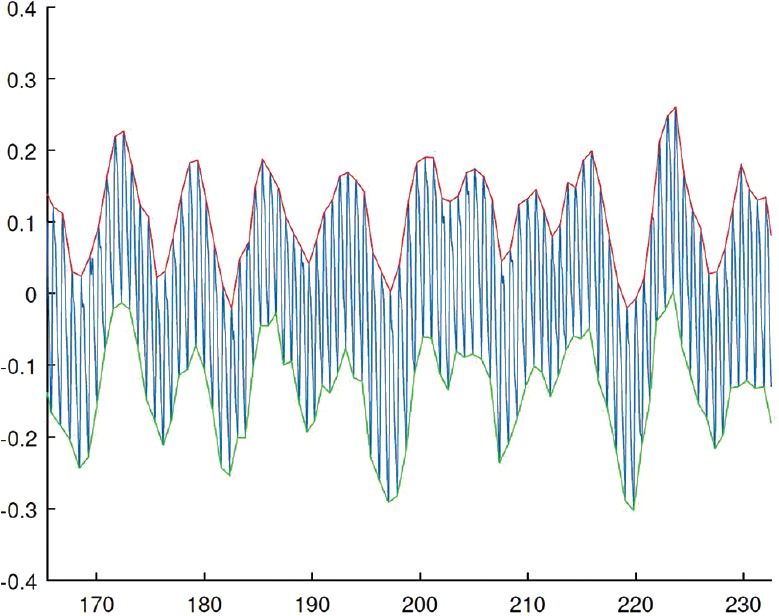
Photo-Plythysmo-Gram variation due to respiration
By taking care of our objective of variability calculation, our first task was to obtain iterative breath interval (IBI) calculation. For the calculation of BRV, we noted time stamp at the peak of each breath pulse, and using that time interval, we find breath-to-breath (BB) interval, which is used as input for time domain, frequency domain, and nonlinear parameter calculation of BRV. This has been done by us in MATLAB using developed algorithm. The IBI time series of PPG is the time location of the nth beat. We also calculated the time stamp for PPG peaks to calculate pulse-to-pulse interval which is used as input for time domain, frequency domain, and nonlinear parameter calculation of pulse rate variability (PRV).
Breath rate variability parameter calculation
For time domain parameter calculation, we used the abovementioned formula, while frequency domain parameters required re-sampling of unevenly sampled BB interval at 4 Hz using cubic spline interpolation processed further by Welch method for power spectral density (PSD) calculation. Lomb–Scargle (LS) method was used for PSD calculation which does not require re-sampling of BB intervals. We also developed an algorithm to find approximate entropy, sample entropy, Renyi entropy, and Detrended fluctuation analysis (DFA) using the above-explained algorithm.
Time domain measures
Statistical measures
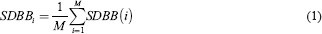
Statistical measures include mean IBI (BB interval [BBI]), standard deviation of BBI series (SDBB), root mean square of successive differences of the IBI series (RMSSD), number of successive differences that are greater than x seconds (BBx), and percentage of total intervals that successively differ by more than x seconds (pBBx).
1. SDABB
Standard deviation of average BB (SDABB) intervals was calculated over short period. Therefore, SDABB is a measure of changes in breath rate due to cycle longer than 5 min.
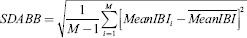
M is the total number of segments.
2. Root mean square of successive differences of the iterative breath interval series
Root mean square of successive differences shows the square root of the mean of the square of the successive differences between adjacent BBs.

3. Standard deviation of successive differences
It is the square root of the mean of the squares of successive differences between adjacent BBs.
Frequency domain parameters
Frequency domain methods show the number of BB counts in each frequency band. Bands are defined as HF band (0.15–0.4 Hz), low frequency (LF) band (0.04–0.15 Hz), and VLF band (<0.04 Hz).
Power spectral density
It gives information about power distribution across frequency. It can be calculated using parametric and nonparametric methods. Nonparametric methods use simple algorithm based on FFT and high processing speed, while parametric method gives smooth spectral component. There is another FFT-based classical method used for calculation of frequency domain parameters which is the LS period gram. LS method is best of BB interval data because BB interval is unevenly sampled and this method does not require re-sampling and detrend of data. Frequency domain parameters include (total area power [TP] <0.4 Hz); VLF power (<0.04 Hz), and LF power (0.04–0.15 Hz). It is reflective of sympathetic modulation and parasympathetic tone. (HF power [0.15–0.4 Hz]), A pure measure of parasympathetic activity such as LF/HF, rLFHF (Ratio of LF to HF), nLF (Normalized LF = LF/(TP − VLF)), nHF (Normalized HF = HF/(TP − VLF)).
Welch period gram
Welch's period gram is based on discrete Fourier transform (DFT), or more practical as FFT. The N-point DFT of a random variable X (n) is given by:
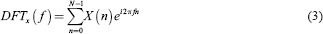
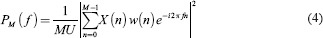
Reducing spectral leakage of the period gram can be accomplished by incorporating a weighted windowing function w (n), for example, Hamming and Henning, to the input series. Data near the edges of time series are given less weight compared to data nearer the center. Thus, modified period gram is given by:
Where i =1………L-1
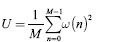
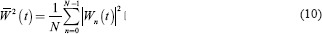
Finally, an averaged PSD is calculated using all segments. PSD by the Welch period gram is given by:
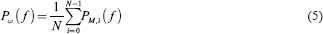
where, PM, i (f) is the modified periodogram from the data series.
Burg periodogram
Autoregressive spectral estimation methods differ from nonparametric methods in that they attempt to model the data instead of estimating the PSD directly. The power spectrum of a pth order autoregressive process is given by:
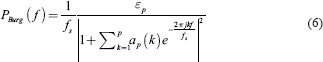
where Єp is the total least square error, fs is the sample rate, and ap are the Burg AR model parameters. Boardman et al. suggest that a model order of p between 16 and 20 is a sound choice for HRV in human IBI resampled at 2–4 Hz.
Lomb–Scargle periodogram
As mentioned before, the LS periodogram (LSP) method of estimating PSD does not require resampling. The LSP only uses available data. Conceptually, LSP estimates the frequency spectrum by performing a least squares fit of sinusoids to the data. The LSP of a nonuniformly sampled, real-valued data sequence X of length N for arbitrary times tn is defined by:
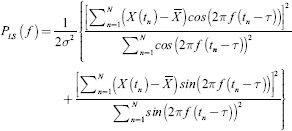
Where x̄ and σ2 are the mean and variance of time series and
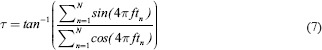
Where τ is the frequency dependent time delay, defined to make the Periodogram insensitive to time shift.
Time-frequency analysis
Methods used to allow simultaneous viewing of both time and frequency information are often termed time-frequency analysis. Time-frequency BRV analysis quantifies VLF-, LF-, and HF-related measures. The two primary types of time frequency analysis used are the windowed Fourier transform (also called short-time Fourier transform) and the continuous wavelet transform. To include spectral estimation methods other than the Fourier transform, the term windowed periodogram will be used in place of windowed Fourier transform. This generalization allows the inclusion of the windowed Burg periodogram and windowed LSP.
Windowed pictogram
Windowed power spectrum broken down the data into consecutive (overlapping or not) segments or windows. PSD is then computed for each segment.
For the windowed Burg periodogram, the entire data series is first re-sampled and then broke into segments of equal lengths. Finally, the PSD is computed for each segment using the Burg periodogram. BRV quantification from time-frequency analysis using windowed periodogram can be accomplished by two ways: the first method computes an averaged or global power spectrum and calculates typical frequency-domain HRV measures, for example, LF, HF, and LFHF. Alternatively, BRV measures can be calculated for each segment, and then an average BRV measure can be computed. The second method produces discretely instantaneous frequency-domain measures that are a function of time, for example, LF (t) and LFHF (t). From LFHF instantaneous time series, another index can be extracted called the rLFHF.
Wavelet transforms
Like Fourier transform, wavelet transform separates a signal into its fundamental components. However, unlike the Fourier transform, wavelet transforms can be applied to nonstationary signals and is not limited to a single set of basis waveforms for signal decomposition. Acharya et al. state that “bio-signals usually exhibit self-similarity patterns in their distribution, and a wavelet which is akin to its fractal shape would yield the best results in terms of clarity and distinction of patterns.”
Continuous wavelet transform
For a given signal x(t) and wavelet function,
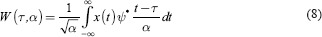
where ψ* is the complex conjugate of the mother wavelet ψ (t), α is the dilation parameter, and T is the location parameter. The bivariant function W (T, α) shows the similarity of x(t) to a wavelet scaled by α at a given time T.
The time-scale map (scalogram) must be interpreted in terms of a time frequency map (spectrogram). The instantaneous power of the frequency band (f1 f2) is given by:
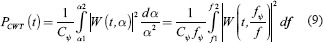
The wavelet equivalent to an averaged periodogram is the global wavelet spectrum is given by:
Nonlinear analysis
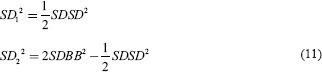
Poincare plot
Poincare plot is a scatter plot of the current BB interval plotted against preceding BB interval. Poincare plot analysis is a quantitative visual technique, whereby the shape of the plot is categorized into functional classes. Points above the line of identity indicate BB intervals that are longer than the preceding BB interval, and points below the line of identity indicate a shorter BB interval than the previous. Accordingly, the dispersion of point's perpendicular to the line of identity reflects the level of short-term variability. This dispersion can be quantified by the standard deviation of the distances the points lie from the line of identity. The standard deviation of points along the line of identity reflects the SDBB.
Approximate entropy
Autonomic nervous system affects the respiration rate, which shows nonlinear proprieties. Approximate entropy increases due to meditation.[14] ApEn is a measure that quantifies the unpredictability in a time series data. ApEn reflects the likelihood that similar observations will not be followed by additional similar conditions. Lower ApEn values are assigned to more regular time series, while higher ApEn values are assigned to more irregular, less predictable, time series.
For our experiment, In method, the embedded dimension m and tolerance r can be set as m = 2 and r = 0.20SD (standard deviation of signal segment). The distances among vectors are calculated as the maximum absolute distance between their corresponding scalar elements. The number of vector distance exceeding the tolerance r corresponding vector i is counted as Nm (i). The counting number of different vectors is calculated, normalized, and taken logarithm as
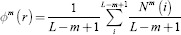
Where L is the data length, than ApEn is defined as

Sample entropy
Sample entropy (SampEn) is an embedded entropy that attempts to quantify a signal's complexity or rate of new information generation. Let Xi = (x1. xi.xN) represents the original N-long IBI series. The unconditional probability of randomly selecting two m length sequences from a signal that have a distance less than r using the relative frequency methods is  . The averaged probability is given by:
Similarly, nim+1, Cim+1, Φim+1, are calculated for vector lengths of m+1. Finally Sample entropy is determined by

Detrended fluctuation analysis
Detrended fluctuation analysis measures the correlation within the signal and consists into the steps: The average BB of BB interval series is calculated on all the N samples. The alternate component of BB interval series, which is defined as BB minus its average value BB, is integrated:
The integrated time series is detrended as follows: y (k)–y n (k). The root mean square fluctuation of the detrended time series is computed according to the following formula:
The steps from 2 to 4 are repeated for n from 4 to 64. Representing the function F(n) in a log-log diagram, two parameters are defined: short-term fluctuations (α 1) as the slope of the regression line relating log (F(n)) to log(n) with n within 4–16; long-term fluctuations (α 2) as the slope of the regression line relating log(F(n)) to log(n) with n within 16–64.
Renyi entropy
Renyi entropy generalizes the Shannon entropy and includes the Shannon entropy as a special case. Renyi entropy H is defined as follows:
where pi is the probability that a random variable takes a given value out of n values, and α is the order of the entropy measure. H (0) is simply the logarithm of n. As α increases, the measures become more sensitive to the values occurring at higher probability and less to those occurring at lower probability, which provides a picture of the BB length distribution within a signal. A density measure can be calculated for the individual BB interval with index i, as the sum of all contributions from other BB intervals with index j:
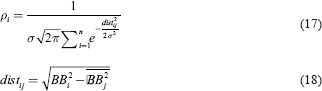
The SD of BB intervals as a time domain feature and the Renyi entropy, using a scaling exponent of integer values from −3 to 0, was analyzed.
Kubios heart rate variability
Kubios HRV is an advanced tool for studying the variability of heart beat intervals. We use the same for BRV. By our developed algorithm, we calculated IBI data from breathing wave. Then, we put IBI data as input to convert all parameters based on the above explanation.
Flow sensor
We used two flow sensor [See Figure 3] boards with the arrangement as we connect sensor to our nostrils. It will be directly in front of nostrils, so air can fall on sensor during inspiration and expiration. The amplified signal generated by sensor board was sent to motherboard which is used for analog to digital conversion. Now, these digital data are transferred to system using a Bluetooth board. We used code block for interfacing Mother board (MB) and system.
Figure 3.
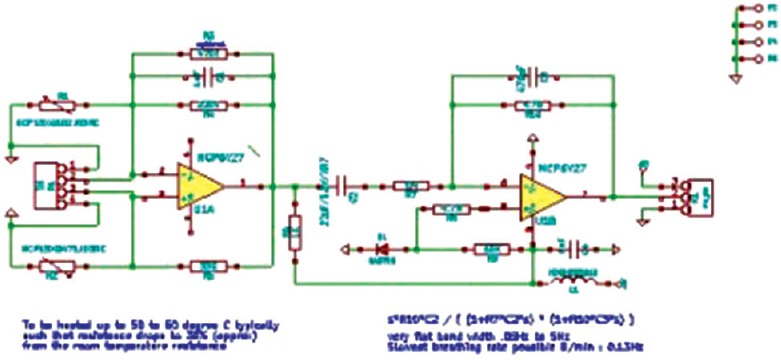
Flow sensor circuit diagram
Description
The flow sensor circuit measures the velocity (or volume) of the airflow through the nasal cavity based on constant temperature hot-wire anemometer principle. The circuit consists of negative temperature coefficient (NTC) thermistors NCP15XQ102J03RC (R1) and NCP15XQ471J03 (R2) and a precision low-noise dual op-amp MCP6022 or auto-zero dual op-amp MCP6V27 (U1) for very low drift in ultra-LF band. The bridge is inherently compensated against the thermal variation of the air flow by using two thermistors in opposite branches.
Captured video shows movement of chest or abdomen during the time of breathing. To amplify the movement, we used Eulerian video magnification, which uses filter to select the part of the image to amplify and reject other parts using MATLAB platform.
The next task was to generate respiration waveform from the video. For the purpose, we use the code of OPENCV. We defined coordinates of three different places according to the movement due to respiration which we can choose based of video observation during running of the code. It gives the output on the graph display a length of 100 and normalized magnitude between 0 and 255. X-axis shows the number of frame and Y-axis shows movement. The camera takes video at the rate of 14 frames per seconds, by dividing frame length with frame speed (14 FPS) gives time in seconds, output gives nine different waveforms as three different places of RGB. All nine waveforms give different variations at different places. Hence, we had taken mean of all waveforms and used 5th order Butterworth high-pass filter to remove unwanted HF noise. Now, we find the peak point of each respiratory pulse to calculate BBI using peak-finder algorithm.
Results
Comparison of mediator and controls
We consider that change in parameters should be more than 10% as significant. Our analysis is based on mean value changing control (meditated) and experimental (nonmeditated) individuals. Time domain measures (See Figure 4(a)): mean breathing time (+17.5%), median (+16.8%), SDBB (+24%), SDABB (+29%), RMSSD (+26%) increased while mean BR (+21%) decreased due to meditation.
Figure 4.

Breath rate variability time domain, frequency domain, time frequency, and nonlinear analysis for meditators andnonmeditators (a) Time domain parameters (b) Frequency domain parameters (c) Time frequency parametrs (d) Nonlinear parameters
Time domain analysis of breath awareness was associated with change in the HRV during and after the practice which were suggestive of reduced parasympathetic modulation. The time domain measures are recognized to be strongly dependent on the vagal modulation.[15] The increase in the mean BB interval could be related to the fact that these practices are associated with increased vigilance and better performance in an attention task.[15] It shows suggestive decreased sympathetic and increased parasympathetic modulation in meditating individuals.
Frequency domain analysis
Concurrent monitoring of respiration in terms of BRV is considered important. This has been supported by an acute increase in LF and total spectrum BRV in meditation. Welch frequency domain PSD analysis shows huge decrease in the area of HF power (+75%) and increase of VLF area (>100%) without significant change in total area, decrease in both HF and LF percentage, and huge decrement in normalized HF percentage See Figure 4(b). Similar result is shown by AR and LS methods; hence the changes observed in the present study appear to be related to changes in autonomic modulation. In contrast, the LF significantly presents, whereas the HF was approximately negligible in meditation. The LF band of the BRV is mainly related to sympathetic activation when expressed in normalized units,[15] while efferent vagal activity chiefly contributes to the HF band.[15]
Time frequency analysis
It shows comparison of Welch, AR, and LS methods See Figure 4(c). There is huge decrement in area and power of HF band while significant increment in area and power of VLF band. LFHF power (+73%) and LFHF ratio (+33%) get increased by AR method. Wavelet and Lomb methods also give similar results. Thus, concurrent monitoring of respiration in terms of BRV is considered important. Sd1, Sd2, and sample entropy increase in value for >20% while approximate entropy shows very less increment See figure 4(d). DFA parameters α and α 1 show less effective increment while Renyi entropy parameters with value of α between −3 and −1 show enough decrement. LFHF ratio is a good indicator of sympathetic (>1) and parasympathetic (<1) tone. DFA parameters show factuality or self-similar proprieties of nonstationary time series. ApEn measures unpredictability of time series data, increment in ApEn shows more irregular and less predictable time series. SpEn quantifies signal complexity or rate of new information generation. In summary, meditation is associated with a shift in the autonomic balance toward vagal withdrawal. The exact mechanism by which meditation may be influencing the autonomic nervous system remains a speculation. The respiratory and cardiovascular centers are closely associated in the brainstem. It is possible that conscious cortical regulation of brainstem respiratory centers may influence cardiovascular centers and hence bring about the changes in BRV seen.
Comparison of percentage change in different parameters of pulse rate variability and breath rate variability
We are trying to compare BRV with PRV based on percentage change in time domain, frequency domain, time frequency domain, and nonlinear parameters between meditating and nonmeditating individuals. Figure 5(a) shows the correlation between BRV and PRV. Max, min, mean, median, SDABB, and SDBBi show similar type of variation, while SDBB and TIBB show opposite variations. We observe strong percentage change in mean, median, SDBB, SDABB, and RMSSD due to meditation. Figure 5(b) shows the area of LF increases, while area of HF decreases. LFHF power and peak of LF increase due to meditation is similar to BRV and for PRV. Figure 5(c) shows time frequency parameters using Lomb, wavelet, LS for PRV, and BRV. Areas of VLF and LF increase while decrease is observed for HF calculated by Lomb method for BRV and PRV. Figure 5(d) shows change in nonlinear parameters in PRV and BRV. It increases for sample entropy, SD1, SD2, and α, while decreases for H (−3) to H (−1). We do not observe any large change in approximate entropy due to meditation.
Figure 5.

Comparison between breath rate variability and pulse rate variability between meditators and nonmeditators (a) Time domain parameters (b) Frequency domain parameters (c) Time frequency parametrs (d) Nonlinear parameters
Discussion
According to literature, BRV parameters describe how meditation changes control parasympathetic activity over sympathetic activity.[16] It can be clearly understood that meditation increases voluntary control on breathing and autonomic nervous system.[17] According to the table, LF and VLF power and HF/LF ratio increase. LS method shows only significant increment in LF and LF/HF power ratio. We can see a great increment in SD1, SD2, and sample entropy for meditating individuals. It describes both sympathetic and parasympathetic balance. Time frequency parameter shows only increase in VLF area which describes only parasympathetic activity. Renyi entropy and approximate entropy decrease due to meditation. As mentioned in the literature, meditation shows increment in time domain parameters, increase in LF, VLF, and VF/HF ratio and decrease in HF power. One long-term effect of meditation is the improvement in autonomic function to increase parasympathetic activity and decrease sympathetic dominance. As compared to HRV, BRV can provide short-term effect on ANS like stress while HRV shows long-term effects.[18] By observing the above results, BRV can be a good tool to quantify the effect of meditation.
We used the measured breathing waveform from PPG and video as input in our algorithm to calculate BBI, also known as IBI. This IBI is used as the input for BRV parameter computation. Our MATLAB algorithms calculate time domain parameters such as SDBB, RMSSD, and standard deviation of SDBB. We then performed spectral analysis to calculate frequency domain parameters such as PSD, power of each band, peak frequency of each band, and normalized frequency using Burg, Welch, and LS methods. We also calculated nonlinear parameters such as sample entropy, approximate entropy, Poincare plot, and Renyi entropy. Finally, time-frequency parameters such as global PSD, LF-HF ratio, and LFHF power by Burg LS and wavelet method are also computed. The preliminary result shows that the meditation individuals have high value of DSD, SDBB, and RMSSD. While in frequency domain, it shows decrease in HF (>50%) and it shows increase in LF (>17%) region. Nonlinear parameters SD1 and SD2 are also more (>20%) for meditation individuals. BRV can be a successful tool to identify the short-term ANS problem at early stage. It can be useful to quantify progress due to meditation. People can use different methods to extract respiratory waveform from PPG such as auto-regressive modeling. People can use this algorithm for continuous heath monitoring of vital parameter such as respiration rate. The algorithm can show stage-wise progress in autonomic nervous system due to meditation.[19] PPG respiration effect shows at VLF which includes a lot of noise and can be disturbed very easily by motion and anatomical behavior, so it is quite difficult to get 100% correct result every time. The study has two main limitations. (i) It would have been ideal to test the individuals after a time but no control. (ii) If the breath frequency is close to frequency of the heart rate during the experiment, this could result to an interference between two close frequencies which leads to a raise in artifact, particularly increase in LF. BRV needs at least 15 min of data for analysis while HRV needs a minimum of 5 min data.
Conclusion
RV is an alternate measure of effect of meditation even over a short duration. More importantly, BRV is both voluntarily and involuntarily controlled unlike HRV which is involuntarily activated. BRV quantifies the effect of meditation on human ANS. Our novelty starts with a simple and elegant observation that most meditation techniques are inherently related to breathing awareness or breathing practices. Therefore, in this preliminary study, we tested a hypothesis that the BRV quantifies the effect of meditation over a short duration as it elevates parasympathetic control over sympathetic control.
Future work
BRV can be a successful tool to identify the short-term ANS problem at early stage. It can be useful to quantify progress due to meditation. People can use different methods to extract respiratory waveform from PPG such as auto-regressive modeling. People can use this algorithm for continuous heath monitoring of vital parameter such as respiration rate. The algorithm can show stage-wise progress in autonomic nervous system due to meditation.
Financial support and sponsorship
Nil.
Conflicts of interest
There are no conflicts of interest.
Acknowledgements
The authors gratefully acknowledge and thank all the teachers and trainers in the Dhamma Setu Vipassana Meditation Center, Chennai for volunteering as subjects whose participation made this study possible. Thanks to all meditation teachers for active participation and support in the experimental activities.
References
- 1.Manocha R, Black D, Spiro D, Ryan J, Stough C. Changing definitions of meditation-is there a physiological corollary? Skin temperature changes of a mental silence orientated form of meditation compared to rest. J Int Soc Life Inf Sci. 2010;28:23–31. [Google Scholar]
- 2.Ritz T, Roth WT. Behavioral interventions in asthma. Breathing training. Behav Modif. 2003;27:710–30. doi: 10.1177/0145445503256323. [DOI] [PubMed] [Google Scholar]
- 3.Gallego J, Nsegbe E, Durand E. Learning in respiratory control. Behav Modif. 2001;25:495–512. doi: 10.1177/0145445501254002. [DOI] [PubMed] [Google Scholar]
- 4.Jerath R, Edry JW, Barnes VA, Jerath V. Physiology of long pranayamic breathing: Neural respiratory elements may provide a mechanism that explains how slow deep breathing shifts the autonomic nervous system. Med Hypotheses. 2006;67:566–71. doi: 10.1016/j.mehy.2006.02.042. [DOI] [PubMed] [Google Scholar]
- 5.Sovik R. The science of breathing – The yogic view. Prog Brain Res. 2000;122:491–505. doi: 10.1016/s0079-6123(08)62159-7. [DOI] [PubMed] [Google Scholar]
- 6.Pal GK, Velkumary S, Madanmohan Effect of short-term practice of breathing exercises on autonomic functions in normal human volunteers. The Indian journal of medical research. 2004;120:115–21. ISSN 0971-5916. URL http://www.ncbi.nlm.nih.gov/pubmed/15347862 . [PubMed] [Google Scholar]
- 7.Siegel DJ. Mindfulness training and neural integration: Differentiation of distinct streams of awareness and the cultivation of well-being. Soc Cogn Affect Neurosci. 2007;2:259–63. [Google Scholar]
- 8.Walsh R, Shapiro SL. The meeting of meditative disciplines and western psychology a mutually enriching dialogue the evolution of a relationship. doi: 10.1037/0003-066X.61.3.227. [DOI] [PubMed] [Google Scholar]
- 9.Davis DM, Hayes JA. What are the benefits of mindfulness? A practice review of psychotherapy-related research. Psychotherapy (Chic) 2011;48:198–208. doi: 10.1037/a0022062. [DOI] [PubMed] [Google Scholar]
- 10.Meredith DJ, Clifton D, Charlton P, Brooks J, Pugh CW, Tarassenko L. Photoplethysmographic derivation of respiratory rate: A review of relevant physiology. J Med Eng Technol. 2012;36:1–7. doi: 10.3109/03091902.2011.638965. [DOI] [PubMed] [Google Scholar]
- 11.Karlen W, Raman S, Ansermino JM, Dumont GA. Multiparameter respiratory rate estimation from the photoplethysmogram. IEEE Trans Biomed Eng. 2013;60:1946–53. doi: 10.1109/TBME.2013.2246160. [DOI] [PubMed] [Google Scholar]
- 12.Cernat RA, Ungureanu C, Ungureanu GM, Aarts R, Arends J. Real-time extraction of the respiratory rate from photoplethysmographic signals using wearable devices. Proceedings of the European Conference on Ambient Intelligence, November 11-13. 2014 [Google Scholar]
- 13.Papp ME, Lindfors P, Storck N, Wändell PE. Increased heart rate variability but no effect on blood pressure from 8 weeks of hatha yoga – A pilot study. BMC Res Notes. 2013;6:59. doi: 10.1186/1756-0500-6-59. [DOI] [PMC free article] [PubMed] [Google Scholar]
- 14.Rastogi R, Pawluk DT, Ketchum JM. Issues of using tactile mice by individuals who are blind and visually impaired. IEEE Trans Neural Syst Rehabil Eng. 2010;18:311–8. doi: 10.1109/TNSRE.2010.2045008. [DOI] [PubMed] [Google Scholar]
- 15.Telles S, Singh N, Balkrishna A. Heart rate variability changes during high frequency yoga breathing and breath awareness. Biopsychosoc Med. 2011;5:4. doi: 10.1186/1751-0759-5-4. [DOI] [PMC free article] [PubMed] [Google Scholar]
- 16.Levy DM, Wobbrock JO, Kaszniak AW, Ostergren M. The Effects of Mindfulness Meditation Training on Multitasking in a High-Stress Information Environment. Graphics Interface Conference. 2012:45–52. [Google Scholar]
- 17.Guz A. Brain, breathing and breathlessness. Respir Physiol. 1997;109:197–204. doi: 10.1016/s0034-5687(97)00050-9. [DOI] [PubMed] [Google Scholar]
- 18.Medical TA. Heart Rate Variability (HRV) Measurement Standards of Measurement, Physiological Interpretation, and Clinical Use Task Force of the European Society of Cardiology the North American Society of Pacing Electrophysiology. Circulation. 1996;93:1043–1065. https://doi.org/10.1161/01.CIR.93.5.1043. Originally published March 1, 1996. [PubMed] [Google Scholar]
- 19.Buddhist Meditation: An fMRI Study Published in: Noninvasive Functional Source Imaging of the Brain and Heart and the International Conference on Functional Biomedical Imaging, 2007. NFSI-ICFBI. 2007 [Google Scholar]