

Abstract
Information about layer specific connections in the brain comes mainly from classical neuronal tracers that rely on histology. Manganese Enhanced MRI (MEMRI) has mapped connectivity along a number of brain pathways in several animal models. It is not clear at what level of specificity neuronal connectivity measured using MEMRI tracing can resolve. The goal of this work was to determine if neural tracing using MEMRI could distinguish layer inputs of major pathways of the cortex. To accomplish this, tracing was performed between hemispheres of the somatosensory (S1) cortex and between the thalamus and S1 cortex. T1 mapping and T1 weighted pulse sequences detected layer specific tracing after local injection of MnCl2. Approximately twelve hours following injections into S1 cortex, maximal T1 reductions were observed at 0.6 ± 0.07 and 1.1± 0.12 mm from the brain surface in the contralateral S1. These distances correspond to the positions of layer 3 and 5 consistent with the known callosal inputs along this pathway. Four to six hours following injection of MnCl2 into the thalamus there were maximal T1 reductions between 0.7 ± 0.08 and 0.8 ± 0.08 mm from the surface of the brain, which corresponds to layer 4. This is consistent with terminations of the known thalamocortical projections. In order to observe the first synapse projection, it was critical to perform MRI at the right time after injections to detect layer specificity with MEMRI. At later time points, tracing through the cortical network led to more uniform contrast throughout the cortex due to its complex neuronal connections. These results are consistent with well established neuronal pathways within the somatosensory cortex and demonstrate that layer specific somatosensory connections can be detected in vivo using MEMRI.
Introduction:
The anatomical and functional architecture of the somatosensory cortex has been studied extensively in the past using neuronal tracing methods. From the pioneering work of Woolsey over fifty years ago, the primary somatosensory cortex was found to be separated into regional boundaries defining areas of the brain where sensory information is processed from inputs from the periphery (Woolsey and Fairmen, 1946). The use of anterograde and retrograde tracing techniques have been critical for working out the neuronal pathways responsible for the organization of the brain into functional regions and for understanding the specific inputs/outputs that connect brain regions (for review see Kobbert et al., 2000). Despite the tremendous knowledge gathered over fifty years from these architectural studies, a shortcoming of these techniques is that they require histology to visualize the tracer. Moreover, unless specific types of retroviruses are used, then traditional neural tracers can detect connections only one synapse away. Until recently it was not possible to gather data in vivo making it difficult to make repeated measurements within individual subjects over time in order to study changes in connections that might occur due to learning, plasticity, and pathological conditions.
The great success of neuroimaging techniques such as positron emission tomography (PET), magnetic resonance imaging (MRI) and optical imaging at measuring anatomical and functional events related to neuronal activity within living subjects has led to great interest in expanding the information about neural systems that can be obtained with these techniques (Fox et al., 1986; Kwong et al., 1992; Ogawa et al., 1993; Denk et al., 1990). In particular, MRI has proven to be an excellent method for examining the complex structure and function of brain tissue. The advent of functional MRI (for review see Mathews and Jezzard, 2004), and diffusion MRI (Le Bihan, 2003) has, in combination with more traditional anatomical MRI, given an unprecedented view of the human brain. Indeed, the development of high field MRI for animal and human work is leading to image resolution beginning to approach that seen in traditional histological techniques (Aoki et al., 2004; Duyn et al., 2007).
There has been growing interest in the use of Manganese Enhanced MRI (MEMRI) to enable MRI to detect neuronal activity (Lin and Koretsky, 1997; Aoki et al., 2002; Yu et al., 2005), to enable MRI to measure a number of aspects of neuroarchitecture (Watanabe et al., 2002; Aoki et al., 2004; Silva et al., 2004), and to trace specific neuronal pathways (Pautler et al., 1998). Indeed, the ability of MEMRI to obtain information about neuronal connectivity in analogy to classical anterograde track tracers has led to its widespread use to study connectivity in rodents, birds, and monkeys (Saleem et al., 2002; Van der Linden et al., 2002; Leegaard et al., 2003; Pautler, 2004; Bilgen et al., 2006; Chuang and Koretsky, 2006; Murayama et al., 2006; Bearer et al., 2007; Lee et al., 2007; Pelled et al., 2007; van der Zijden et al., 2007; Minoshima and Cross, 2008; Silva et al., 2008). The fact that Mn2+ moves in an anterograde direction along the appropriate neuronal pathway and can cross synapses has led to the ability of using MRI to detect functional neural circuits (Pautler et al., 1998; Pautler and Koretsky, 2002; Saleem et al., 2002; Pautler, 2004).
Despite the growing body of work using MEMRI track tracing it is not yet clear at what level of resolution connectivity can be measured. There is growing evidence that when delivered to the whole brain, Mn2+ leads to enhancement of MRI in a manner that can be sensitive to detection of layers in the olfactory bulb, hippocampus, and cerebral cortex (Aoki et al., 2004; Watanabe et al., 2002; Silva et al., 2004). One report has shown preliminary data that indicated when MnCl2 was injected into the thalamus layer specific inputs into layer 4 of the cortex could be detected (Silva et al., 2008). Evidence has been presented for layer specific tracing from the olfactory bulb with MEMRI as well (Pautler and Koretsky, 2002). The present work was designed to build on this initial finding to determine if MEMRI based track tracing could resolve layer inputs into the cortex along two major pathways. MEMRI tracing was performed between hemispheres of the somatosensory (S1) cortex, and between the thalamus 4 and the S1 cortex. Results show that the known layer specific inputs of these pathways into somatosensory cortex could be detected by MEMRI. Critical to detecting layer specific inputs was performing MRI at the specific time after local injection of MnCl2. This opens the possibility to assess layer specific changes in patterns of connectivity in individual animals associated with learning, plasticity and pathological states such as stroke or peripheral nerve injury.
Methods:
Animal Procedure:
All animal work was performed according to the guidelines of the Animal Care and Use Committee and the Animal Health and Care Section of the National Institute of Neurological Disorders and Stroke, National Institutes of Health (Bethesda, MD USA). A total of twenty-two adult male Sprague-Dawley rats (140-200g) were used in this study. For cortical injections, eleven rats received pressure injection of 1pl of 60mM aqueous MnCl2 (Sigma-Aldrich, St. Louis, MO, USA), which was buffered with Bicene (Sigma-Aldrich, St. Louis, MO, USA) and brought to physiological pH with NaHCO3. Injections were made into the right S1 cortex in the forepaw area (Bregma 0.2, lateral 3.8 and ventral 1.5 mm). For thalamic injections, eleven rats received 200 nl of 60 mM MnCl2 solution into the left hemisphere (Bregma 3.0, lateral −3.0, and ventral 5.5 mm). All stereotactic coordinates were determined according to the Paxinos and Watson atlas (Paxinos and Watson, 2005). MRI was performed before, immediately after injection, and at 4 to 6 hours, 12 hours, and 24 hours post injection. For stereotactic injections, animals were initially anesthetized by 5% isoflurane (1:1:1 air: nitrogen: oxygen mixture), positioned in a stereotactic frame (Stoelting) and kept on 2-3%_isoflurane during the surgery. A small bur hole was drilled after exposing the skull. A Hamilton syringe was placed at the proper coordinates in the sterotaxic frame. Injections were performed slowly over 5-10 minutes and the syringe was slowly removed. The burr hole was sealed with bone wax and the muscle sutured closed.
MRI was performed right after stereotaxic injections to make sure MnCl2 delivered to the proper site and then at varying times after injections. For MRI scans, rats were initially anaesthetized with 5% isoflurane and placed in a custom made plastic stereotactic holder. The anesthesia was maintained at 1-2% using a nose cone and rectal temperature was maintained at 37 ± 1°C by a heated water bath. After surgery and in between scans, animals were allowed to recover and were free to roam within their cages. No abnormalities were observed after injection in all the rats.
MRI:
Images were acquired on an 11.7 T/31 cm horizontal bore magnet (Magnex Scientific Ltd., Abingdon, UK), which was equipped with a 9 cm gradient/shim set (Resonance Research Inc., Billerica, MA, USA) and interfaced to a Bruker Avance console (Bruker BioSpin, Billerica, MA, USA). A 70 mm volume transmit coil and a 2 cm circular receive only surface coil constructed in the laboratory were used for MRI. Two dimensional T1 maps were obtained from seven animals in the S1 injection group and seven animals in the thalamic injection group using a Look-Locker method previously described (Chuang and Koretsky, 2006). Imaging parameters were: TR=12s, TE=2.5 ms, α=20°, τ= 500 ms, N=20. Twenty-two coronal slices with FOV=2.56 × 2.56 cm, matrix 128×128, thickness=1.0 mm, and gap 0.1 mm were used to cover the whole brain at 200gm in plane resolution in 27 minutes. To examine enhancement due to Mn2+ tracing at higher resolution, a Magnetization Prepared Rapid Gradient Echo (MP-RAGE) sequence (Mugler and Brookeman, 1990) was used on four animals in both the S1 and thalamic injection groups. For MP-RAGE data, S1 injected animals were imaged 12-16 hours post injection and thalamic injected animals were imaged 4-6 hours post injection. Sequence parameters such as optimal inversion delay time for best tissue contrast with the MP-RAGE sequence were determined from the T1 values obtained from the Look-Locker T1 maps. Sixteen coronal slices with FOV= 2.56×2.56 cm, matrix 256×256, thickness= 0.5 mm (TR= 4000 ms, Echo TR/TE = 15/5 ms, TI= 1000 ms, number of segments= 4, Averages= 8) were used to cover the area of interest at 100 μm in plane resolution in 32 minutes.
Data Processing:
For T1 maps the T1 of each pixel was calculated using a custom written program that accounts for the dependence of T1 fits on the flip angle (Chuang and Koretsky, 2006). For group analysis, the brain was extracted from the T1 map by Brain Surface Extraction (Shattuck et al., 2001) and spatially normalized to a brain using affine transformation (Woods et al., 1998). Group statistical maps were created by a paired t-test in each voxel with a threshold at p< 0.05. Region of Interest (ROI) analysis was performed on the two-dimensional T1 maps and MP-RAGE images using Image J (NIH). According to the rat brain atlas, ROIs perpendicular to the surface and extending through the length of the cortex, throughout the forepaw area, were selected to get averaged T1 values from T1 maps and signal intensity values from the MP-RAGE, at various cortical depths and at different time points. From the T1 values derived from the Look-Locker T1 maps, the change in relaxation rate due to manganese was calculated using the expression: ΔR1 =1/T1exp−1/T1control . From the MP-RAGE data, signal difference to noise ratio (SDNR) was calculated by subtracting signal intensity values pre- and post- injection after normalizing to the standard deviation of noise intensity in the image outside of the cranial tissue.
All data is presented as means ± s.d. One way ANOVA was performed to assess significance between means of ΔR1 values or SDNR within all cortical depths (reported as F value). Post-hoc multiple comparisons using an unpaired two-tailed Student t-test with bonferonni correction were done to assess the statistical significance of MRI signal changes of unique cortical depths to the remaining cortical depth measurements within an experimental group. A p value < 0.05 was considered significant.
Results:
Relaxation Profile and Images from T1 mapping
Figure 1A shows T1 maps from a single animal showing prior to MnCl2 injection at a slice corresponding to the injection site, a T1 map from a slice corresponding to the injection site into S1 cortex immediately after the injection, and a slice more rostral from the injection site containing globus pallidus and thalamus at 6, 12 and 24 hours post injection. No significant T1 reductions can be seen in subcortical regions at 6hrs in this rat, but at 12 and 24 hours shorter T1s (darker brain regions on the T1 maps) can be detected in the thalamic regions on the same side of the brain as the injection site compared to the contralateral hemisphere. This is the well known cortical-thalamic connections that have been detected previously with MEMRI track tracing (Canals et al., 2008). Additionally, regions of the cortex ipsilateral to the injected hemisphere also exhibit T1 shortening that can begin to be detected at 12 hours. Cortical-cortical connections have been detected previously with MEMRI tracing as well (van der Zijden et al., 2007; Canals et al., 2008). Figure 1B shows the temporal evolution of signal intensity of the inversion prepped, Look-Locker based T1 relaxation measurement from an ROI of a rat before Mn2+ injection. The region of interest measured was located within a portion of cortical gray matter corresponding to the right forepaw somatosensory cortex. The plot profile is a typical magnitude, exponential recovery curve of the longitudinal magnetization as seen with other standard inversion recovery sequences. Figure 1C shows the signal to noise difference from regions of the manganese injection site subtracted from the contralateral S1 forepaw cortex, immediately post injection when no T1 enhancement was seen in the contralateral hemisphere. Here maximal SDNR between injection site and contralateral cortical tissue was seen at an inversion time of 1 second. Therefore, this inversion time was chosen to provide optimal tissue contrast for the MP-RAGE sequences.
Figure 1:
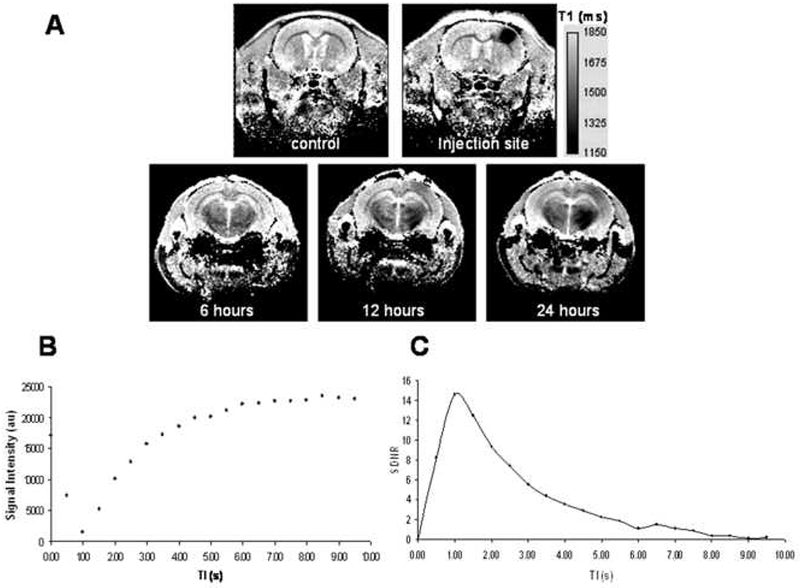
(A) T1 maps from a single animal indicating control, injection site, and 6, 12 and 24 hours post injection in a slice through the basal ganglia
(B) Signal intensity profile for different inversion times of the Look-Locker T1 mapping sequence follows normal longitudinal relaxation after inversion pulse.
(C) Optimal inversion time for the MP-RAGE sequence was determined by calculating the maximal signal to noise difference between nulled background tissue and tissue with Mn2+ (optimal TI=1 sec).
Time Course of Changes in T1 after S1 Injection
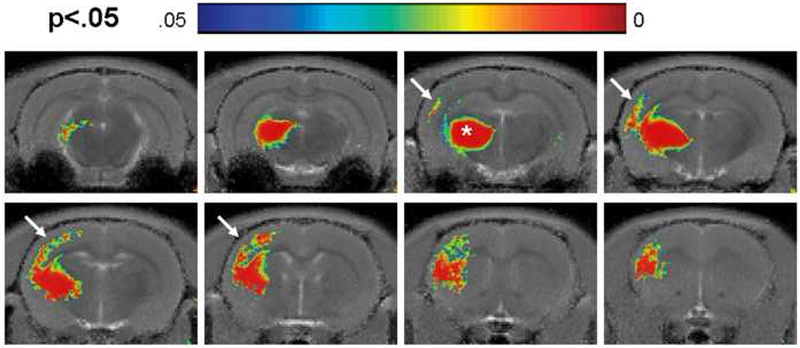
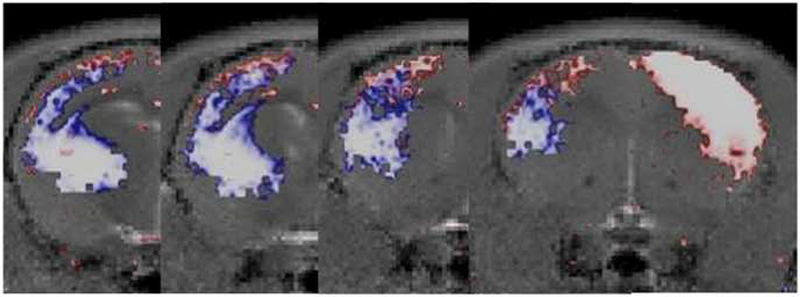
The time courses of changes immediately after and up to 24 hours post injection are shown in Figure 2. The data represents the group statistical maps overlaid on template T1 maps for different slices (Figure 2A-D). Significant changes in T1 relaxation per pixel due to localized Mn2+ accumulation are shown immediately after injection into the right forepaw area (indicated by a white star) and 6, 12 and 24 hours post injection. The color scale represents the significance of the change in T1 with blue being at p=0 and red at p< 0.05. At 6 and 12 hours, significant (p< 0.05) changes in T1 are seen in the contralateral cortex, homotopic to the injection site about the forepaw representational area (Figure 2 D, indicated by white arrows). At the threshold used, a layer organization is apparent. Additionally at 6 hours, significant changes are seen along the corpus callosum (Figure 2D). The contralateral region approaches higher statistical significance with more wide spread changes in T1 at 12 and 24 hours. However, significantly shorter T1s are now detected throughout the thickness of the contralateral cortex. At 6 hours post injection, significant changes in T1 can be seen within the ipsilateral ventral medial thalamic nucleus (Figure 2A and 2B) as well as the ipsilateral secondary somatosensory cortex (Figure 2B-D) and the ipsilateral striatum (Figure 2C and 2D). By 12 hours significant changes in T1 can be seen in the ipsilateral visual cortex, subthalamic nuclei and substantia nigra (Figure 2A), in addition to the ipsilateral external globus pallidus and internal capsule (Figure 2B). By 24 hours, in addition to the contralateral somatosensory cortex, the contralateral striatum also shows significant changes in T1.
Figure 2:
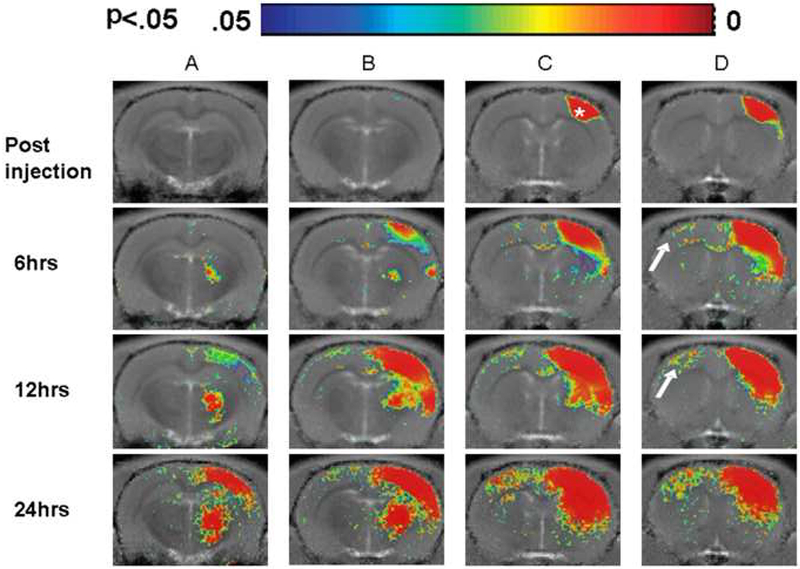
Group statistical maps (n=7) at 6, 12, and 24 hours following S1 injection reveals regions with significant T1 changes especially in the contralateral hemisphere (shown by arrows) homotopic to the injection site (indicated by star). Different time points are orientated as rows while subsequent slices within each time point are indicated as columns (A-D). Color bar threshold set to p< 0.05.
Time Course of Change in R1 through Cortical Depths of Contralateral Forepaw Area
In order to quantitate the degree to which T1 was changing in the contralateral S1 forepaw area due to Mn2+ accumulation throughout the cortical depth, profiles of the change in longitudinal relaxation rate (R1 = 1/T1post injection − 1/T1pre injection) at the 6, 12 and 24 hour time points are shown in Figure 3. Vertical lines indicate the positions of different cortical layers with values for the depth of the layers taken from previous work using MRI to delineate cortical layers (Silva et al., 2008). At 6 hours post injection, mean changes in R1 can be seen throughout all cortical depths. However, there was no significant difference in intensity at different cortical depths (F12,78 = .55, P = .87). At 12 hours there was significant difference in intensity at different cortical depths (F12,78 = 2.75, P = .004). At 12 hours a peak in the change of R1 was seen at a 0.6 mm depth corresponding to the layer 3/4 border. Post-hoc analysis revealed that the change in R1 at this depth was statistically different from the R1 at 0.0-0.2 mm cortical depth (p< 0.01) corresponding to layer 1, and for the R1 at 0.8 mm depth (p< 0.05) corresponding to layer 4, and from the R1 at a 1.0 to 1.6 mm depth (p< 0.01) corresponding to layers 5-6. At 24 hours the change in R1 due to manganese leveled off throughout all cortical depths so that no depth was significantly different from any other cortical depths (F12,78 = .09, P = .99).
Figure 3:
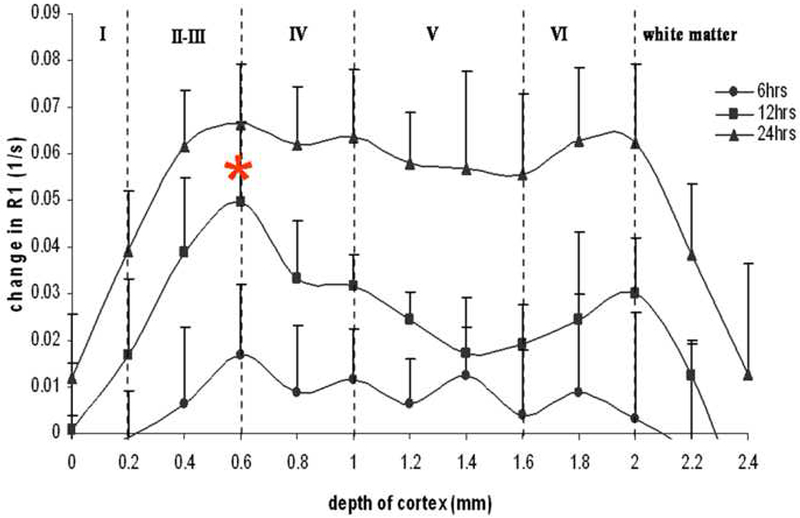
ΔR1 profiles through the cortical depth in the contralateral S1 obtained at 6, 12 and 24 hrs post injection into S1. A significant peak (indicated by star) of ΔR1 due to Mn2+ was observed at 12 hrs post injection. This depth of .6 mm was significantly different (p < 0.05) from values at 0.2 and 0.8-1.6 mm below the cortical surface.
High Resolution Imaging of Contralateral Enhancement in the S1 Forepaw Area
The T1 maps were acquired at 200 micron in-plane resolution which is close to the thickness of some cortical layers. In order to better assess whether there is any layer specificity for Mn2+ tracing to the contralateral cortex, higher resolution T1-weighted images were acquired using MP-RAGE. Figure 4a shows high resolution MP-RAGE images of an uninjected control animal (top row), and 12 hours post injection (bottom row). Contralateral enhancements in cortical regions homotopic to the injection site are clearly detected in a layer specific manner indicated by red arrows. Figure 4b shows profiles of the signal difference to noise ratio between pre- and post-injection (n=4). There was significant differences throughout cortical depths throughout the enhanced volume (F19,60 = 8.16, P = 1.64 × 10⁻¹⁰ ). Post-hoc analysis revealed significant peaks in intensity at 0.6 ± 0.07 mm and 1.1 ± 0.12 mm from the cortical surface (indicated by blue) were detected. These peaks are significantly higher than signal from 0.0-0.4 mm and 1.2-2.0 mm below the surface of the cortex (indicated by red). The peak intensity at 0.6 mm corresponds to the transition between layer 3 and 4 of the primary somatosensory cortex and the peak at 1.1 mm corresponds to the upper half of layer 5.
Figure 4:
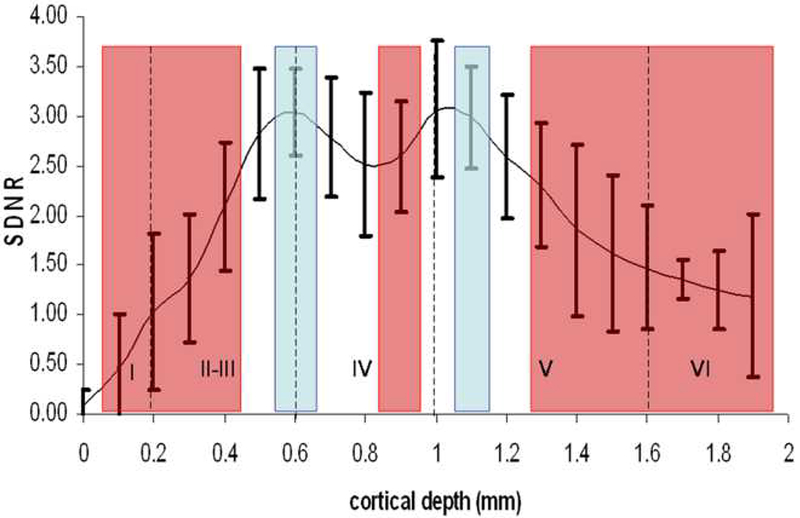
(A) High resolution MP-RAGE images of uninjected control scan (top row) and at 12 hours post injection (bottom row) reveal contralateral enhancement (shown by arrows), homotopic to the injection site (shown by star).
(B) Profiles of the signal difference to noise between pre and 12 hours post treatment (n=4) show peaks (at 0.6 and 1.1mm; shown in blue) significantly different (p < 0.05) than 0.0 - 0.4 mm and 1.2 – 2.0 mm below the cortical surface (shown in red). Vertical lines indicate positions of cortical layer.
Significant Difference in T1 Relaxation of S1 Ipsilateral to Thalamic Injection
To further investigate whether Mn2+ can trace in a layer specific manner in the cortex, injections were done into the thalamus. It is well established that the thalamus sends neuronal projections to the somatosensory cortex primarily into layer 4 with less dense projections into all other cortical layers. Statistical maps using the T1 mapping protocol overlaid on slices of a template T1 map from seven rats, 4-6 hours post injection of MnCl2 into the thalamus are shown in Figure 5. Significant changes in T1 relaxation per pixel due to localized manganese accumulation are seen at the injection site in the ventrobasal thalamic nucleus (indicated by a white star) and along the somatosensory cortex of the hemisphere ipsilateral to the injection site, especially within mid-cortical areas (indicated by white arrows). Additionally there were statistical differences in T1 in the internal capsule, corpus callosum and striatum (data not shown).
Figure 5:
Statistical maps (n=7) at 4-6 hours following thalamic injection reveals significant changes in T1 in the ipsilateral hemisphere (shown by arrows) to the injection site (shown by star).
High Resolution Imaging of Ipsilateral Enhancement Following Thalamic Injection
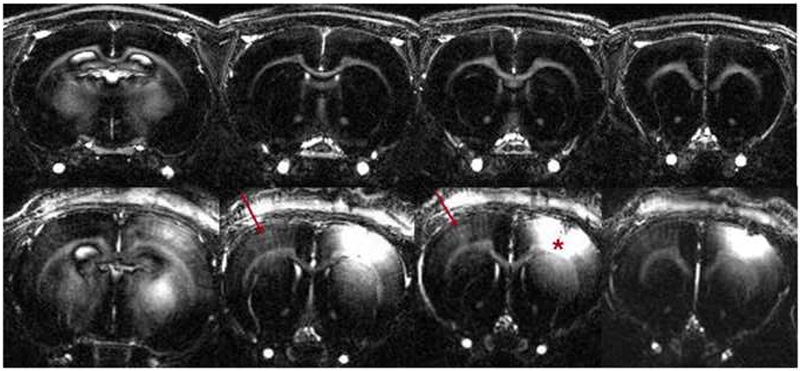
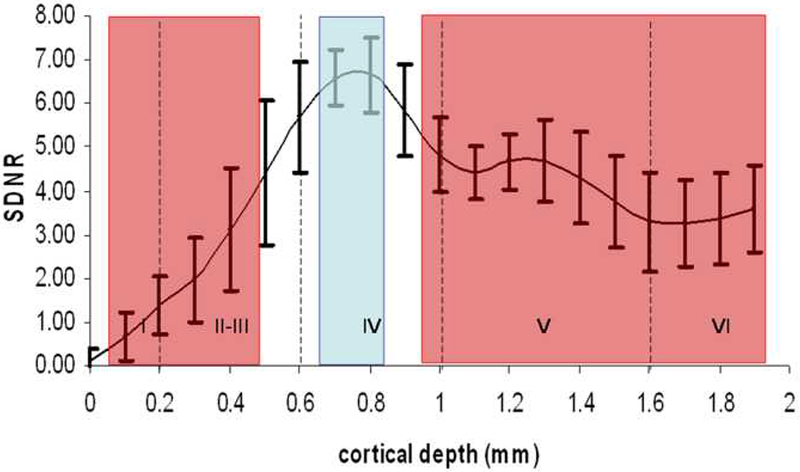
To better analyze layer specificity at higher resolution, T1 weighted images were obtained at 100 micron resolution using the MP-RAGE sequence. Figure 6a shows high resolution MP-RAGE images of an un-injected control animal (top row), and 6 hours post injection (bottom row). Ipsilateral contrast due to T1 enhancement in cortical tissue appears as a distinct band at a specific cortical depth (red arrows in Figure 6A). This band stops at regions just lateral to the brain midline which is approximately the border with the motor cortex. Additionally the band formed through the cortex at this time point was comprised of “patches” of contrast through this narrow band of tissue. Figure 6b shows profiles of the signal to noise difference between profiles 4-6 hours post-injection subtracted from profile pre-injection. There was significant differences throughout cortical depths throughout the enhanced volume (F19,60 = 13.32, P = 5.35 × 10⁻¹⁵ ). Post-hoc analysis showed that the peak between 0.7 and 0.8 mm cortical depth with an average depth of 0.72 ± 0.08 mm (indicated by blue) are significantly different than 0-0.4 mm and 1-2 mm below the surface of the cortex (indicated by red). The peak between 0.7 mm and 0.8 mm corresponds to mid layer 4 of the primary S1 cortex.
Figure 6:
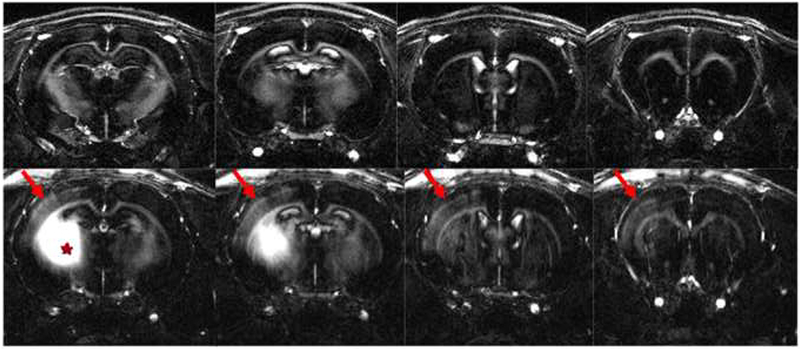
(A) High resolution MP-RAGE images of a control, uninjected animal (top row) and 4-6 hours post injection into the thalamus (bottom row) reveal enhancement (shown by arrows) in the hemisphere ipsilateral to the injection site (shown by star).
(B) Profiles of the signal difference to noise ratio between pre and 6 hours post treatment (n=4) show peaks (at 0.7 and 0.8mm; shown in blue) significantly different ( p < 0.05) than 0.0 - 0.4 mm and 1.0 – 2.0 mm below the cortical surface (shown in red). Vertical lines indicate positions of cortical layer.
Variance of Significant Peak Placement between Animals in Each Group
The degree of variation of the depth of the highest peak in SDNR between animals within each injection group from the MP-RAGE data was measured. From the S1 tracing data, the peak corresponding to an average depth of 0.6 mm had a standard deviation of 0.07 mm between animals while the peak corresponding to an average depth of 1.1 mm had a standard deviation of 0.12 mm between animals. From the thalamus injected group, the peak corresponding to an average depth of 0.72 mm had a standard deviation of 0.08mm. The cortical depths of both peaks which were detected after S1 injection in the contralateral hemisphere were at a significantly different location (p<0.05) as compared with the peak which was detected after the thalamus injections. To further visualize the difference in tracing into S1 cortex from thalamus as opposed to contralateral S1 injections, statistical maps from the quantitative T1 data were overlapped. The 12 hr time point for the S1 group and the 4-6 hour from the thalamus group were overlaid on a common template with a threshold set at p< 0.05. Figure 7 shows the relationship of the manganese enhanced regions through the cortical depth of S1 between the two injection groups. The S1 injection group (red areas) indicates an upper cortical localization of T1 change, whereas the thalamus injection group (blue areas) indicates a mid-cortical localization of T1 change after thalamic injection.
Figure 7:
Overlaid statistical maps (p < 0.05) from both experimental groups (S1 injection: red; thalamic injection: blue) onto a common template (A-D: from posterior to anterior) gives a relationship of enhancement regions in cortical layer.
Discussion:
The purpose of this work was to determine if Mn2+ is transported with layer specificity transcallosally across hemispheres between the somatosensory cortex and along thalamocortical pathways into S1. Both quantitative T1 mapping and MP-RAGE sequences detected the largest T1 changes in S1 of the contralateral cortex from a depth corresponding to layer 3 and 5 due to tracing of Mn2+1 across the corpus collosum. Maximal effects were detected at a cortical depth corresponding to layer 4 of the ipsilateral S1 following thalamic injections. It was critical to acquire MRI data at the proper time after injection to detect these layer specific effects. MRI performed too soon after injection did not give time for significant Mn2+ to enter the cortex and MRI too late led to tracing of Mn2+ throughout the cortex leading to a loss in layer specificity. The optimal time was at about 12 hours for cortical-cortical connections and 4-6 hours for thalamocortical pathways in the rat brain. These results indicate that it will be critical to establish optimal times for performing MEMRI for optimal detection of layer specific inputs depending on the pathway being studied and probably dependent on the species being studied. Furthermore, the ability to detect layer specific tracing using MEMRI was improved with higher resolution. It is well known that the cortical thickness of some layers in the rodent can be as thin as 200 microns. Thus, even at the 100 micron resolution used for the MP-RAGE data the thinner layers, such as layer 4 are barely being properly sampled. Therefore, it is predicted that the ability to detect layer specific inputs will improve with improvements in resolution.
The results obtained for the positions of the cortical-cortical and thalamocortical inputs into S1 are consistent with the well established neuronal pathways within the somatosensory cortex (Woolsey and Van der Loos, 1970; Wise and Jones, 1976). Thus, layer specific somatosensory connections can be detected in vivo using MEMRI. Neuronal connections linking hemispheric regions of S1 cortex have been known for some time. The corpus callosum is the major connectivity pathway between cortical hemispheres in the anterior portion of the brain. Anterograde and retrograde histological tracing experiments in the rat have demonstrated that callosal fibers originating in the primary somatosensory cortex terminate in the contralateral hemisphere within the lower depths of layer 3 and the upper portion of layer 5 (Wise and Jones, 1976). Additionally it was proposed that these callosal connections are restricted to the dysgranular zones of the somatosensory cortex (Akers and Killackey, 1978; Olavarria et al., 1984). Later reports indicated that these callosal connection patterns are not absolute and that certain representational areas of the somatosensory cortex such as the upper and lower jaw areas have dense callosal afferents in layer 2-3 and 5 of the granular in addition to the dysgranular zones (Hayama and Ogawa, 1997). Furthermore, it was found that anatomical connections exist in one hemisphere within regions homotopic to the contralateral hemisphere (Hayama and Ogawa, 1997). The localizations of Mn2+ found by the in vivo tracing experiments performed in this study are in good agreement with results of the studies mentioned. Cortical depths of highest signal intensity corresponding to layer 3 and upper layer 5 of S1 cortex in regions homotopic to the injection site are consistent with interhemispheric connections through the corpus callosum. This is a good indication that Mn2+ transport is specific to the density of layer inputs along these callosal pathways. This is the first time MEMRI used for tract tracing has demonstrated layer specific connections in the cortex between brain hemispheres.
Previous reports have demonstrated contralateral hemispheric transport of Mn2+ within S1 (Allegrini and Weissner, 2003; Leergard et al., 2003; Van der Zijden et al., 2007). However, none of these studies reported layer specificity in the contrast achieved from manganese accumulation. An interesting finding from Van der Zijden and colleagues (Van der Zijden et al., 2007) was that following a rodent stroke induced by middle cerebral artery occlusion, subsequent Mn2+ tracing of the somatosensory pathway after injection into S1 revealed a significant delay in changes in ipsilateral relaxation due to manganese transport throughout the somatosensory circuit, more specifically the striatum, thalamus and substantia nigra, for up to four weeks post stroke. Additionally, tracing was restored to controlled levels in the cortex ipsilateral to stroke at ten weeks after stroke alongside a plateau in functional recovery assessed behaviorally. Finally, there was an increase in tracing to the striatum, thalamus substantia nigra in the hemisphere contralateral to stroke ten weeks post stroke. Taken together, the authors suggest these findings be indicative of interhemispheric structural changes in neuronal networks which contribute to post stroke recovery. It would be interesting to assess changes in structural plasticity in models of this type at the resolution of cortical layers to try to better define the changes in neural circuits.
Neuronal inputs originating in the thalamus and sent to the somatosensory cortex have also been thoroughly established using classic tracing techniques that rely on histology. The majority of S1 inputs originating from the thalamus project to layer 4 of the somatosensory cortex forming a somatopic map of functional areas of the rodent body surface (Welker, 1976). For example, discreet functional columns of neurons are represented throughout layer 4 of the somatosensory cortex and correspond to projections of specific whiskers sent from the thalamus (Woolsey and Van der Loos, 1970; Wise and Jones, 1978). The localization of Mn2+ found in the in vivo tracing experiments from the ventrobasal nucleus of thalamus to the somatosensory cortex are in good agreement with the histological results. Cortical depths of highest signal intensity 4-6 hours post injection corresponding to layer 4 in the hemisphere ipsilateral to the injected thalamus are consistent with thalamocortical connections originating from the thalamus. These results confirm and extend preliminary reports from our group that indicated contrast in layer 4 after thalamic injection at a time point of 12-16 hours post injection (Silva et al., 2008).
Significant differences in layer signal have been reported using MEMRI in the olfactory bulb, hippocampus, retina, cerebellum, and cortex (Aoki et al., 2004; Watanabe et al., 2004; Silva et al., 2004; Lee et al., 2005; Berkowitz et al., 2006). In these studies, layers were detected after systemic administration of MnCl2 which results in very interesting anatomical contrast. Silva and colleagues (Silva et al., 2008) focused on the layered distribution of contrast enhancement 24-28 hours after systemic manganese administration. In this case, the highest manganese enhanced MRI signal was found in lower layer 2 of the mouse brain. During systemic administration manganese enters the brain through the choroid plexus and into the ventricular compartments, from which it transports into other brain regions. While it is probably true that enhancement due to systemic delivery involves track tracing, it is impossible to detect any specific tracks due to the large number of tracing routes available for the manganese ion to enter any specific area of the brain. This issue is solved by studying the temporal enhancement after injection into a specific region of the brain where specific inputs can be imaged as demonstrated in the present work. MEMRI has been found to trace to specific layers of the olfactory bulb (Pautler and Koretsky et al., 2002; Lee et al., 2005; Chuang et al., 2006). Within the olfactory bulb, other groups have shown that the temporal evolution of contrast after systemic administration can lead to changes in enhancement patterns. For example in Lee and colleagues (Lee et al., 2005) it was shown that there is a redistribution of layered enhancement in the olfactory bulb from the olfactory nerve layer through the mitral cell layer over the first 4 hours post systemic delivery.
The results from systemic administration are only comparable to the results from the present work in so much as the timing of imaging can emphasize different aspects of neuronal architecture or connectivity. The present work has not determined if the final distribution of contrast after injection into a specific region is similar to that obtained after systemic injection. This is an interesting issue for future studies. The present results indicate that at optimal imaging times, layer specific tracing can be detected in the major afferent pathways into S1 cortex. This supports the idea that Mn2+ traces in a pathway specific manner and should enable MRI to be used to assess neural connections at least to the level of layer specific inputs.
In several animals following thalamic injection, the T1 weighted images showed several bright bands that extended through the cortex, perpendicular to the pial surface and several bright patches throughout layer 4 measuring roughly 300-500 micrometers in diameter (Tucciarone and Koretsky 2008). It is suspected that these structures are cortical columns representing digits and whisker barrels innervated by thalamocortical projections. Further data is required including careful comparison to histology to properly characterize these interesting patches of contrast.
In conclusion, it was found that differences in maximal signal intensity due to Mn2+ accumulation throughout depths of the cortex are specific to particular neuronal input pathways to layers of S1 cortex. Connections between hemispheres into layers 3 and 5 and from the thalamus into the cortical layer 4 could be detected using MEMRI. It was critical to acquire images at sufficient resolution and at the right time after injection to observe layer specific tracing. There is evidence that functional changes associated with learning and plasticity within the rat somatosensory cortex takes place in a layer specific manner (Fox, 1994; Micheva and Beaulieu, 1995). The layer specificity of MEMRI neuronal track tracing has great potential for identifying changes in neuronal connectivity in vivo that may occur in learning, plasticity, brain development, or certain disease states such as stroke or peripheral nerve injury.
Acknowledgements
The authors would like to acknowledge the surgical assistance and expertise of Ms. Nadia Bouraoud and Ms. Kathy Sharer. This research was supported by the Intramural Research Program of the NINDS, NIH.
Footnotes
Publisher's Disclaimer: This is a PDF file of an unedited manuscript that has been accepted for publication. As a service to our customers we are providing this early version of the manuscript. The manuscript will undergo copyediting, typesetting, and review of the resulting proof before it is published in its final citable form. Please note that during the production process errors may be discovered which could affect the content, and all legal disclaimers that apply to the journal pertain.
References
- Ackers RM, Killackey HP, 1978. Organization of corticocortical connections in the parietal cortex of the rat. J Comp Neuro 180, 513–37. [DOI] [PubMed] [Google Scholar]
- Allegrini PR, Weissner C, 2003. Three-dimensional MRI of cerebral projections in rat brain in vivo after intracortical injection of MnCl2. NMR Biomed 16, 252–6. [DOI] [PubMed] [Google Scholar]
- Aoki I, Naruse S, Tanaka C, 2004. Manganese-enhanced magnetic resonance imaging (MEMRI) of brain activity and applications to early detection of brain ischemia. NMR Biomed 17, 569–80. [DOI] [PubMed] [Google Scholar]
- Aoki I, Tanaka C, Takegami T, Ebisu T, Umeda M, Fukunaga M, Fukuda K, Silva AC, Koretsky AP, Naruse S, 2002. Dynamic activity-induced manganese-dependent contrast magnetic resonance imaging (DAIM MRI). Magn Reson Med 48, 927–33. [DOI] [PubMed] [Google Scholar]
- Aoki I, Wu YJ, Silva AC, Lynch RM, Koretsky AP, 2004. In vivo detection of neuroarchitecture in the rodent brain using manganese enhanced MRI. Neuroimage. 22, 1046–59. [DOI] [PubMed] [Google Scholar]
- Bearer EL, Falzone TL, Zhang X, Biris O, Rasin A, Jacobs RE, 2007. Role of neuronal activity and kinesin on tract tracing by manganese-enhanced MRI (MEMRI). Neuroimage 37 Suppl 1, S37–46. [DOI] [PMC free article] [PubMed] [Google Scholar]
- Belliveau JW, Kennedy DN Jr., McKinstry RC, Buchbinder BR, Weisskoff RM, Cohen MS, Vevea JM, Brady TJ, and Rosen BR, 1991. Functional Mapping of the Human visual cortex by magnetic resonance imaging. Science. 254, 716–719. [DOI] [PubMed] [Google Scholar]
- Berkowitz BA, Roberts R, Goebel DJ, Luan H, 2006. Noninvasive and simultaneous imaging of layer-specific retinal functional adaptation by manganese-enhanced MRI. Invest Ophthalmol Vis Sci. 47, 2668–74. [DOI] [PubMed] [Google Scholar]
- Bilgen M, Peng W, Al-Hafez B, Dancause N, He YY, Cheney PD, 2006. Electrical stimulation improves corticospinal tract tracing in rat spinal cord using manganese enhanced MRI. J. Neuroscience Methods 156, 17–22. [DOI] [PubMed] [Google Scholar]
- Canals S, Beyerlein M, Keller AL, Murayama Y, Logothetis NK, 2008. Magnetic Resonance Imaging of cortical connectivity in vivo. Neuroimage 40, 458–72. [DOI] [PubMed] [Google Scholar]
- Chuang KH, Koretsky AP, 2006. Improved neuronal tract tracing using manganese enhanced magnetic resonance imaging with fast T(1) mapping. Magn Reson Med. 55, 604–11. [DOI] [PubMed] [Google Scholar]
- Denk W, Strickler JH, Webb WW, 1990. Two photon laser scanning fluorescence microscopy. Science 248, 73–76. [DOI] [PubMed] [Google Scholar]
- Duyn JH, van Gelderen P, Li TQ, de Zwart JA, Koretsky AP, Fukunaga M, 2007. High-field MRI of brain cortical substructure based on signal phase. Proc Natl Acad Sci U S A, 104, 11796–801. [DOI] [PMC free article] [PubMed] [Google Scholar]
- Fox K, 1994. The cortical component of experience-dependent synaptic plasticity in the rat barrel cortex. J Neurosci.14, 7665–79. [DOI] [PMC free article] [PubMed] [Google Scholar]
- Fox PT, Mintun MA, Raichle ME, Miezin FM, Allman JM, Van Essen DC, 1986. Mapping human visual cortex with positron emission tomography. Nature, 323, 806–09. [DOI] [PubMed] [Google Scholar]
- Gaspar P, Cases O, Maroteaux L, 2003. The developmental role of serotonin: news from mouse molecular genetics. Nat Rev Neurosci. 4, 1002–12. [DOI] [PubMed] [Google Scholar]
- Hayama T, Ogawa H, 1997. Regional differences of callosal connections in the granular zones of the primary somatosensory cortex in rats. Brain Res Bull. 43, 341–7. [DOI] [PubMed] [Google Scholar]
- Inan M, Crair MC, 2007. Development of cortical maps: perspectives from the barrel cortex. Neuroscientist 13, 49–61. [DOI] [PubMed] [Google Scholar]
- Killackey HP, 1973. Anatomical evidence for cortical subdivisions based on vertically discrete thalamic projections from the ventral posterior nucleus to cortical barrels in the rat. Brain Res. 51, 326–31. [DOI] [PubMed] [Google Scholar]
- Kobbert C, Apps R, Bechmann I, Lanciego JL, Mey J, Thanos S 2000, Current concepts in neuroanatomical tracing. Prog Neurobiol. 62, 327–51. [DOI] [PubMed] [Google Scholar]
- Kwong KK, Belliveau JW, Chesler DA, 1992. Dynamic magnetic resonance imaging of human brain activity during primary sensory stimulation. Proc. Natl Acad. Sci. USA 89, 5675–79 [DOI] [PMC free article] [PubMed] [Google Scholar]
- Le Bihan D, 2003. Looking into the functional architecture of the brain with diffusion MRI. Nat. Rev. Neurosci 4, 469–80. [DOI] [PubMed] [Google Scholar]
- Le Bihan D, Breton E, Lallemand D, Grenier P, Cabanis E, Laval Jeantet M, 1986. MR imaging of intravoxel incoherent motions: applications to diffusion and perfusion in neurological disorders. Radiology 161, 401–07. [DOI] [PubMed] [Google Scholar]
- Lee JH, Koretsky AP, 2004. Manganese enhanced magnetic resonance imaging. Curr Pharm Biotechnol. 5, 529–37. [DOI] [PubMed] [Google Scholar]
- Lee JH, Silva AC, Merkle H, Koretsky AP, 2005. Manganese-enhanced magnetic resonance imaging of mouse brain after systemic administration of MnCl2: dose-dependent and temporal evolution of T1contrast. Magn Reson Med. 53, 640–8. [DOI] [PubMed] [Google Scholar]
- Lee JW, Park JA, Lee JJ, Bae SJ, Lee SH, Jung JC, Kim MN, Lee J, Woo S, Chang Y, 2007. Manganese enhanced auditory tract-tracing MRI with cochlear injection. Magn Reson Imaging. 25, 652–6. [DOI] [PubMed] [Google Scholar]
- Leergaard TB, Bjaalie JG, Devor A, Wald LL, Dale AM, 2003. In vivo tracing of major rat brain pathways using manganese-enhanced magnetic resonance imaging and three-dimensional digital atlasing. Neuroimage 20, 1591–600. [DOI] [PubMed] [Google Scholar]
- Lin YJ, Koretsky AP, 1997. Manganese ion enhances T1-weighted MRI during brain activation: an approach to direct imaging of brain function. Magn Reson Med. 38, 378–88. [DOI] [PubMed] [Google Scholar]
- Mathews PM, Jezzard P, 2004. Functional magnetic resonance imaging. J. Neurol. Neurosurg. Psychiatr 75, 6–12. [PMC free article] [PubMed] [Google Scholar]
- Micheva KD, Beaulieu C, 1995. An anatomical substrate for experience-dependent plasticity of the rat barrelfield cortex. Proc Natl Acad Sci U S A. 92, 11834–8. [DOI] [PMC free article] [PubMed] [Google Scholar]
- Minoshima S, Cross D, 2008. In vivo imaging of axonal transport using MRI: aging and Alzheimer’s disease. Eur. J. Nucl. Med. Mol. Imaging [Epub ahead of print]. [DOI] [PubMed] [Google Scholar]
- Mugler JP 3rd, Brookeman J,R, 1990. Three-dimensional magnetization prepared rapid gradient echo imaging (3D MP-RAGE). Magn Reson. Med 15, 152–7. [DOI] [PubMed] [Google Scholar]
- Murayama Y, Weber B, Saleem KS, Augath M, Logothetis NK, 2006. Tracing neuronal circuits in vivo with Mn-enhanced MRI. Magn Reson Imaging. 24, 349–58. [DOI] [PubMed] [Google Scholar]
- Ogawa S, Menon RS, Tank DW, Kim SG, Merkle H, Ellerman JM, Ugurbil K, 1993. Functional brain mapping by blood oxygenation level-dependent contrast magnetic resonance imaging: a comparison of signal characteristics with a biophysical model. Biophys. J 64, 803–08. [DOI] [PMC free article] [PubMed] [Google Scholar]
- Olavarria J, Van Sluyters RC, Killackey HP, 1984. Evidence for the complementary organization of callosal and thalamic connections within rat somatosensory cortex. Brain Res. 291, 364–8. [DOI] [PubMed] [Google Scholar]
- Pautler RG, Silva AC, Koretsky AP 1998. In vivo neuronal tracing using manganese enhanced magnetic resonance imaging. Magn Reson Med 40, 740–88. [DOI] [PubMed] [Google Scholar]
- Pautler RG. and Koretsky AP., 2002. Tracing odor-induced activation in the olfactory bulb of mice using manganese-enhanced magnetic resonance imaging. Neuromimage. 16, 441–8. [DOI] [PubMed] [Google Scholar]
- Pautler RG, 2004. In vivo, trans-synaptic tract-tracing utilizing manganese-enhanced magnetic resonance imaging (MEMRI). NMR Biomed.17, 595–601. [DOI] [PubMed] [Google Scholar]
- Pautler R,G, 2006. Biological applications of manganese-enhanced magnetic resonance imaging. Methods Mol Med.124, 365–86. [DOI] [PubMed] [Google Scholar]
- Pelled G, Bergman H, Ben-Hur T, Goelman G, 2007. Manganese-enhanced MRI in a rat model of Parkinson’s Disease. J. Magn Reson Imaging. 26, 863–70. [DOI] [PubMed] [Google Scholar]
- Saleem KS, Pauls J, Augath M, Trinath T, Prause BA, Logothetis NK, 2002. Magnetic resonance imaging of neuronal connections in the macaque monkey. Neuron 34, 685–700. [DOI] [PubMed] [Google Scholar]
- Sharief AA, Johnson GA, 2006. Enhanced T2 contrast for MR histology of the mouse brain. Magn Reson Med. 56, 717–25. [DOI] [PubMed] [Google Scholar]
- Shattuck DW, Sandor-Leahy SR, Schaper KA, Rottenberg DA, Leahy RM, 2001. Neuroimage 13, 856–76. [DOI] [PubMed] [Google Scholar]
- Silva AC, Lee JH, Aoki I, Koretsky AP, 2004. Manganese-enhanced magnetic resonance imaging (MEMRI): methodological and practical considerations. NMR Biomed. 17, 532–43. [DOI] [PubMed] [Google Scholar]
- Silva AC, Lee JH, Wu CWH, Tucciarone J, Pelled G, Aoki I, Koretsky AP, 2008. Detection of cortical layer architecture using manganese-enhanced MRI. J Neurosci Methods 167, 246–57. [DOI] [PMC free article] [PubMed] [Google Scholar]
- Tucciarone J and Koretsky AP, 2008. Detection of thalamocortical inputs to the rat whisker barrel field using manganese enhanced MRI [abstract]. In: 2008 Proceedings of The International Society for Magnetic Resonance in Medicine 16th Annual Scientific Meeting; 2008 May 3-9; Toronto, Ontario, Canada Abstract Number [2316]. [Google Scholar]
- Van der Linden A, Verhoye M, Van Meir V, Tindemans I, Eens M, Absil P, Balthazart J, 2002. In vivo manganese-enhanced magnetic resonance imaging reveals connections and functional properties of the songbird vocal control system. Neuroscience 112, 467–74. [DOI] [PubMed] [Google Scholar]
- Van der Zijden JP, Bouts M, Wu O, Roeling TP, Bleys RL, van der Toorn A, Dijkhuizen RM, 2007. Manganese-enhanced MRI of brain plasticity in relation to functional recovery after experimental stroke. J Cereb Blood Flow Metab. [Epub ahead of print]. [DOI] [PubMed] [Google Scholar]
- Wadghiri YZ, Blind JA, Duan X, Moreno C, Yu X, Joyner AL, Turnbull DH, 2004. Manganese-enhanced magnetic resonance imaging (MEMRI) of mouse brain development. NMR Biomed.17, 613–9. [DOI] [PubMed] [Google Scholar]
- Watanabe T, Natt O, Boretius S, Frahm J, Michaelis T, 2002. In vivo 3D MRI staining of mouse brain after subcutaneous application of MnCl2. Magn. Reson. Med 48, 852–9. [DOI] [PubMed] [Google Scholar]
- Welker C, 1976. Receptive fields of barrels in the somatosensory neocortex of the rat. J Comp Neurol. 166, 173–89. [DOI] [PubMed] [Google Scholar]
- Weng JC, Chen JH, Yang PF, Tseng WYI, 2007. Functional mapping of rat barrel activation following whisker stimulation using activity induced manganese dependent contrast. Neuroimage 36, 1179–88. [DOI] [PubMed] [Google Scholar]
- Wise SP, Jones EG, 1976. The organization and postnatal development of the commissural projection of the rat somatic sensory cortex. J Comp Neurol. 168, 313–43. [DOI] [PubMed] [Google Scholar]
- Wise SP, Jones EG, 1977. Somatotopic and columnar organization in the corticotectal projection of the rat somatic sensory cortex. Brain Res.133, 223–35. [DOI] [PubMed] [Google Scholar]
- Wise SP, Jones EG, 1978. Developmental studies of thalamocortical and commissural connections in the rat somatic sensory cortex. J Comp Neurol.178, 187–208. [DOI] [PubMed] [Google Scholar]
- Woods RP, Grafton ST, Watson JDG, Sicotte NL, Mazziotta JC, 1998. Automated Image Registeration: II. Intersubject validation of linear and nonlinear models. J of Comp Assisted Tomography 22, 135–165. [DOI] [PubMed] [Google Scholar]
- Woolsey CN, Fairman D, 1946. Contralateral, ipsilateral, and bilateral representation of cutaneous receptors in somatic areas I and II of the cerebral cortex of pig, sheep, and other mammals. Surgery 19, 684–702. [PubMed] [Google Scholar]
- Woolsey TA, Van der Loos H, 1970. The structural organization of layer IV in the somatosensory region (SI) of mouse cerebral cortex. The description of a cortical field composed of discrete cytoarchitectonic units. Brain Res. 17, 205–42. [DOI] [PubMed] [Google Scholar]
- Yang X, Hyder F, Shulman RG, 1996. Activation of single whisker barrel in rat brain localized by functional magnetic resonance imaging. Proc Natl Acad Sci U S A. 93, 475–8. [DOI] [PMC free article] [PubMed] [Google Scholar]
- Yu X, Wadghiri YZ, Sanes DH, Turnbull DH, 2005. In vivo auditory brain mapping in mice with Mn-enhanced MRI. Nat Neurosci. 8, 961–8. [DOI] [PMC free article] [PubMed] [Google Scholar]