Abstract
Background and Purpose
Ischaemic stroke is a leading cause of death and long‐term disability. Promising neuroprotective compounds are urgently needed to overcome clinical therapeutic limitations. Neuroprotective agents are limited to single‐target agents, which further limit their clinical effectiveness. Due to the brain's particular energy requirements, the energy micro‐environment, centred in mitochondria, is a new research hotspot in the complex pathology of ischaemic stroke. Here, we studied the effects of neferine (Nef), a bis‐benzylisoquinoline alkaloid extracted from the seed embryo of Nelumbo nucifera Gaertn, on ischaemic stroke and its underlying mitochondrial protective mechanisms.
Experimental Approach
Rats with permanent middle cerebral artery occlusion (pMCAO)‐induced focal cerebral ischaemia and tert‐butyl hydroperoxide (t‐BHP)‐injured PC12 cells were used to investigate the neuroprotective effects of Nef, particularly with regard to energy micro‐environment regulation by mitochondria and its mechanism in vivo and in vitro.
Key Results
Nef protected t‐BHP‐injured PC12 cells in vitro and ameliorated neurological score, infarct volume, regional cerebral blood flow, cerebral microstructure and oxidant‐related enzyme deficits in pMCAO rats in vivo. Nef also prevented mitochondrial dysfunction both in vivo and in vitro. The underlying mechanism of the mitochondrial protective effect of Nef might be attributed to the increased translocation of Nrf2 to the nucleus. Furthermore, the translocation of Nrf2 to nucleus was also decreased by sequestosome 1 (p62) knockdown.
Conclusions and Implications
Our results demonstrated that Nef might have therapeutic potential for ischaemic stroke and may exert its protective role through mitochondrial protection. This protection might be attributed to the modulation of Nrf2 signalling.
Abbreviations
- 3‐MA
3‐methyladenine
- AM
6 h after 24 h MCAO
- CBF
cerebral blood flow
- CQ
chloroquine
- DCFH2‐DA
2′,7′‐dichlorodihydrofluorescein diacetate
- IP
immunoprecipitation
- MDA
malondialdehyde
- MDC
monodansylcadaverine
- MTT
3‐(4,5‐dimethyl‐2‐thiazolyl)‐2,5‐diphenyl‐2‐H‐tetrazolium bromide
- Nef
neferine
- NMD
nuclear magnetic detection
- Nrf2‐ARE
nuclear factor erythroid 2‐related factor 2‐antioxidant response element
- PM
15 min prior to 24 h MCAO
- pMCAO
permanent middle cerebral artery occlusion
- p62
sequestosome 1
- ROIs
regions of interest
- t‐BHP
tert‐butyl hydroperoxide
- TEM
transmission electron microscope
- TTC
2,3,4‐triphenyltetrazolium chloride
Introduction
Stroke is a leading cause of long‐term adult disability and brain damage (Donnan et al., 2008; Mozaffarian et al., 2016). Past decades witnessed tremendous achievements in stroke diagnosis. However, numerous neuroprotective agents have failed in clinical translation (Moretti et al., 2015). Promising neuroprotective compounds are urgently needed to overcome the clinical therapeutic limitations.
In recent years, micro‐environments characterized by the concepts of systems and integration have become a new research hotspot for drug treatment (Hui and Chen, 2015). The special energy needs of the brain result in the existence of an energy micro‐environment centred in mitochondria. Mitochondrial dysfunction following ischaemia makes the prognosis of ischaemic stroke difficult. Neuroprotective agents are limited to the regulation of single‐target agents, such as enzymes, receptors or channel proteins, which further limits the clinical effectiveness of these agents (Chen et al., 2011). Mitochondria are the core of the energy micro‐environment as they are the energy plants within a cell (Sims and Muyderman, 2010; Fuhrmann and Brune, 2017). Structural and functional impairments in mitochondria directly lead to an imbalance in the intracellular micro‐environment and further result in ischaemic injury (Wolinski and Glabinski, 2013; Baxter et al., 2014).
Recent studies reported that the nuclear factor erythroid 2‐related factor 2 (Nrf2)‐antioxidant response element (ARE) signalling pathway is crucial for mitochondrial protection (Hancock et al., 2013). In addition, this protective effect was attributed to its cellular defence mechanism under oxidative stress (Nguyen et al., 2009; Baird et al., 2014; Liu et al., 2015). At baseline, this pathway is negatively regulated by a cytoplasmic regulatory protein that targets Nrf2 for proteasomal degradation, Keap1. Canonical activation of Nrf2 signalling during oxidative stress is mediated by a conformational change in Keap1, allowing Nrf2 to translocate to the nucleus and initiate the transcription of genes with ARE in their promoter (Nguyen et al., 2009). Recent work demonstrated that Nrf2 signalling can also be activated through a non‐canonical system that depends on activation of autophagy. Specifically, the substrate sequestosome 1 (p62) competes with Nrf2 for Keap1 binding, promotes the degradation of Keap1 through autophagy and activates the Nrf2‐ARE pathway (Hu et al., 2013; Xu et al., 2013; Yin and Cao, 2015; Duleh et al., 2016). Activation of Nrf2 signalling protects the mitochondria to maintain the energy supply to the brain in ischaemic stroke (Michelson and Ashwal, 2004; Holmstrom et al., 2013; Ichimura et al., 2013).
Neferine (Nef) is a bis‐benzylisoquinoline alkaloid isolated from the green seed embryos of Nelumbo nucifera Gaertn (Lotus) (Furukawa, 1965). There is an abundance of evidence showing that this alkaloid has sedative, anti‐pyretic, (Sugimoto et al., 2008), anti‐arrhythmic (Narayana Moorthy et al., 2013), anti‐depressant (Sugimoto et al., 2010) and autophagy‐inducible effects (Poornima et al., 2013). Moreover, Nef also has effects related to cardiovascular diseases and neurological disorders, such as anti‐thrombotic (Zhou et al., 2013) and inhibitory effects on the β‐site amyloid precursor protein‐cleaving enzyme 1 (Jung et al., 2015). However, as yet, the effects of Nef on cerebral ischaemia have not been explored. Hence, we investigated the anti‐ischaemic effects of Nef on stroke and the underlying mitochondrial protective mechanism of this alkaloid.
Methods
Cell culture
PC12 cells, obtained from the American Type Culture Collection, were cultured in complete DMEM/F‐12K medium containing 5% FBS and 10% horse serum. Cells were incubated at 37°C in a humidified atmosphere of 5% CO2 in air.
Primary cortical neuron culture
Primary rat cortical neurons were isolated from the cerebral cortices of neonatal SD rats. Under sterile conditions, dissected cortices were dissociated with 0.125% trypsin and plated onto poly‐L‐lysine‐coated 24‐well plates. After a 4 h incubation, the medium was replaced with serum‐free neurobasal‐A medium supplemented with 2% B27 and 0.5 mM glutamine, followed by re‐incubation for 7 days, and half of the medium was changed every 3 days. Cells were maintained at 37°C in a humidified atmosphere of 5% CO2.
Identification of primary cortical neurons
The primary cortical neurons were washed and fixed with 4% paraformaldehyde for 20 min at 37°C, permeabilizaed with 0.1% Triton X‐100 for 15 min and blocked with 3% BSA for 30 min at room temperature. Then, the cells were incubated with MAP‐2 (1:400) antibody overnight at 4°C. Subsequently, the cells were incubated with PE‐conjugated goat anti‐rabbit IgG (H+L) (1:1000) mixture for 2 h at room temperature in the dark for 20 min. Cell images were observed under a fluorescence inverted microscope.
Cell viability assay
Cells were seeded on a 96‐well plate overnight and then treated with tert‐butyl hydroperoxide (t‐BHP) (100 μM) for 1 h, with or without Nef (1–10 μM) pretreatment/post‐treatment for 24 h. Subsequently, 20 μL of 3‐(4,5‐dimethyl‐2‐thiazolyl)‐2,5‐diphenyl‐2‐H‐tetrazolium bromide (MTT) solution (5 mg·mL−1) was added to each well, and the samples were then incubated at 37°C for 4 h. The supernatant was removed, and the insoluble formazan product was dissolved in 100 μL of DMSO. Absorbance of each culture well was measured with a microplate reader (Molecular Devices, USA) at a wavelength of 570 nm.
Measurement of ROS generation
Cells were seeded in six‐well plates overnight followed by treatment with or without Nef for 24 h and then treated with t‐BHP (100 μM) for 1 h. The cells were incubated with 2′,7′‐dichlorodihydrofluorescein diacetate (DCFH2‐DA) or MitoSOX™ Red mitochondrial superoxide indicator in the dark at 37°C for 30 min (Dixon et al., 2012). Cells were washed twice with PBS and detached with trypsin/EDTA. Cellular fluorescence was analysed by flow cytometry (Becton Dickinson FACS Canto TM, USA).
Immunofluorescence staining
PC12 cells were cultured in 96‐well plates overnight followed by treatment with or without Nef for 24 h and then treated with t‐BHP (100 μM) for 1 h. The cells were then washed and fixed with 4% paraformaldehyde for 15 min at 37°C, permeabilized with 0.5% Triton X‐100 for 20 min and blocked with 3% BSA for 30 min at room temperature. Next, the cells were incubated with Nrf2 antibody (1:200) overnight at 4°C and then with PE‐conjugated goat anti‐rabbit IgG (H+L) as a secondary antibody (1:1000) performed at room temperature for 1 h. After being washed with PBS, cells were incubated with Hoechst 33342 for 5 min, in the dark, to stain the nuclei. The Nrf2 protein and nuclei are displayed as red and blue fluorescence respectively. Cell imaging was simultaneously viewed on a high‐content analyser to determine the translocation of Nrf2 (Xin et al., 2014).
JC‐1 staining
PC12 cells (5 × 10⁴ per well) were cultured in black‐walled 96‐well plates. After treatment with t‐BHP (100 μM) for 1 h, the mitochondrial membrane potentials were determined by JC‐1 staining according to the manufacturer's instructions. Images were analysed by ImageJ.
Immunoprecipitation assay
PC12 cells were treated with t‐BHP (100 μM) for 1 h, with or without Nef/chloroquine (CQ)/3‐methyladenine (3‐MA) pretreatment for 24 h. Cells were washed twice with ice‐cold PBS and lysed on ice with Beyotime™ lysis buffer. The cell lysate was collected via centrifugation at 3000 × g for 15 min. In addition, the lysate was then divided into two equal parts: one for total protein extraction and the other for immunoprecipitation (IP). Approximately 10 μg of Keap1 antibody was added to 300 μg of lysate obtained from the cells and incubated overnight at 4°C. Agarose A beads (20 μL) were added to the mixture and the samples were incubated for another 8 h under gentle rocking. Lysates were then collected via centrifugation at 3000× g for 3 min, and the supernatant was separated out. Beads were then washed 6 times with lysis buffer. The Keap1 complex from each sample was eluted with 40 μL of lysis buffer. Then, the protocol for Western blotting was followed.
Western blotting
PC12 cells were collected, and the total protein was extracted after treatment with or without Nef for 24 h, and the cells were then treated with t‐BHP (100 μM) for 1 h. The protein concentration was detected by bicinchoninic acid protein assays, according to the manufacturer's instructions. A total of 30 μg of cellular protein from each group was electro‐blotted onto PVDF membranes, followed by separation on 8% SDS‐PAGE. The immune‐blots were then incubated with blocking solution (5% skimmed milk) at room temperature for 1 h, followed by incubation with the primary antibody overnight at 4°C. After being washed with Tween 20/Tris‐buffered saline and incubated with secondary antibodies (1:10000) for 2 h at room temperature, the blots were developed by SuperSignal West Femto chemi‐luminescence. Nucleus and cytoplasm proteins were isolated using a commercial kit, following the manufacturer's instructions.
Animal models
Adult male Sprague–Dawley rats weighing 240–270 g were obtained from the National Institute for Food and Drug Control (Beijing, China). All animals were kept on a 12 h light/12 h dark cycle with free access to food and water. The experimental procedures were approved by the China Academy of Chinese Medical Science's Administrative Panel on Laboratory Animal Care. All studies have followed the editorial on experimental design and analysis in pharmacology (Curtis et al., 2015). The animal studies was compliance with the ARRIVE guidelines (Kilkenny et al., 2010).
Rats were anaesthetized by injection of 10% chloral hydrate (400 mg·kg−1, i.p.) after 2 days of acclimatization. Body temperature was monitored and maintained at 37 ± 0.5°C. After the rats' response to the non‐aversive and noxious stimulation disappeared, the procedures were performed (Field et al., 1993). The middle cerebral artery occlusion (MCAO) model was performed according to a previously described method with minor modifications (Longa et al., 1989). Briefly, a 4‐0 monofilament nylon suture with a rounded tip was inserted from the left external carotid artery into the lumen of the internal carotid artery to occlude the origin of the MCA (Jiang et al., 2010). Rats with <80% reduction in cerebral blood flow (CBF) in the core of the MCA area were excluded from the study. Rats were killed 24 h after the MCAO.
Rats were randomly divided into six groups (n = 10 per group): the sham group; vehicle control, EGb761 group (4 mg·kg−1); and Nef‐treated groups (12.5, 25 and 50 mg·kg−1). Nef was dissolved in sterile saline (containing 2% Tween 80) and diluted before administration. Both Nef and EGb761 were administered intragastrically 15 min prior to the 24 h MCAO (Jiang et al., 2015) or 6 h after the 24 h MCAO (AM). The sham‐ and vehicle‐treated rats were injected with physiological saline.
Treatment groups were assigned in a randomized fashion. Researchers were blind to the assignment of treatment during surgeries and the outcome evaluations.
Evaluation of neurological deficits
The neurological defects were determined by a single researcher 24 h after the MCAO. The researcher was blinded to the experimental treatment groups. The neurological behaviours were scored on 5‐point scale as described previously (Hanley et al., 1989).
Evaluation of cerebral infarct volume
The cerebral infarct volume was determined by 2,3,4‐triphenyltetrazolium chloride (TTC) staining at 24 h after cerebral ischaemia. Brain tissue was sliced into six coronal sections (2 mm thick), stained with 2% TTC solution at 37°C for 30 min, followed by fixation with 4% paraformaldehyde (Zhao et al., 2015). Normal tissue was stained deep red, while the infarct area was stained white. The stained slices were photographed and recorded. The adjusted infarct areas and both hemispheric areas of each slice were determined by an image analysis system (Image‐Pro Plus 6.0) (Lin et al., 1993).
Detection of GSH‐Px, SOD and MDA
Rat blood samples were obtained from the abdominal aorta 24 h after cerebral ischaemia, and then, the serum was collected. The activity of GSH peroxidase (GSH‐Px) and SOD and the concentration of malondialdehyde (MDA) were determined after centrifugation with a commercial kit.
Nuclear magnetic detection (NMD)
Rats were anaesthetized (2% isoflurane), and images were acquired using a 7.0 T Bruker Biospin MR imaging system and the Paravision 5.1 software. T2 maps, which were generated from T2‐weighted sequences, were further analysed using ImageJ. Irregular regions of interest (ROIs) were drawn to encircle the entire stroke lesion, which manifested as a hyperintense area on each T2 map. The lesion areas delineated were summed and multiplied by the slice thickness to determine the stroke volume for each time point. The observed changes were expressed as percentage change compared with the stroke volume calculated in the sham group. CBF maps generated from arterial spin labelling pulse sequences were used to evaluate changes in blood flow over time. Irregular ROIs outlining the stroke areas were created in T2 maps and were transferred horizontally to the ipsilateral side (the brain midline was used as the line of reference) of the CBF map of the corresponding slice. The mean value of the CBF was measured on the ipsilateral and contralateral sides using the ROIs specified on the T2 maps. Mean CBF measurements were obtained from the contralateral hemisphere. Data analysis was performed in ImageJ on the maps generated 24 h after the MCAO procedure.
Electron microscopy
After anaesthesia, the heart was exposed, and the left ventricle was perfused with 0.9% saline, followed by perfusion for 2 h with fixative consisting of 6% glutaraldehyde in 0.1 M sodium cacodylate (pH 7.40–7.50). At the end of the perfusion, the brain tissues were isolated and cut into 1 to 2 mm3 pieces. The samples were kept in the same fixative for 1 h, rinsed in washing solution (0.15 M NaCl plus 0.2 M sucrose), post‐fixed in 1% osmium tetroxide (OsO4) diluted in the same solution, dehydrated in a graded acetone series and embedded in Epon 812. For light‐microscopic examinations, semithin sections (1 μm thick) were cut on an ultra‐microtome (Reichert S Ultra‐Cut, Leica) and stained with 1% toluidine blue (TB). For transmission electron microscope (TEM), ultrathin sections (60 nm thick) were obtained from selected blocks of cerebral regions after histological examination of the TB sections. The ultrathin sections were mounted on copper grids (200 mesh) and double‐contrasted with uranyl acetate and lead citrate for examination by an LEO 906 TEM (Zeiss, Oberkochen, Germany) operated at 60 kV.
PC12 cells were seeded in 10 cm dishes. The following day, cells were treated with t‐BHP (100 μM) for1 h, with or without Nef (10 μM) pretreatment for 24 h. Cells were collected in PBS, gently spun down, fixed in 2% paraformaldehyde and 2.5% glutaraldehyde in 0.1 M sodium cacodylate buffer before being washed in 0.1 M sodium cacodylate buffer and post‐fixed in 1% osmium tetroxide in 0.1 M sodium cacodylate buffer. Following fixation, cells were dehydrated through a graded series of alcohols and embedded in Spurr's resin. Ultrathin sections were cut with a diamond knife using a Leica Ultra‐cut S ultra‐microtome and stained with both methanolic uranyl acetate and lead citrate before being viewed by an LEO 906 TEM operated at 60 kV.
siRNA knockdown
The Nrf2 and p62 siRNA were synthesized by Suzhou GenePharma Co., Ltd. (Suzhou, China). siRNA transfections in PC12 cells were performed with Lipofectamine® 2000 according to the manufacturer's instructions.
siRNAs for rats were dissolved in RNAase free water to produce a stock solution with a concentration of 100 μM according to manufacturer's instructions. Then, we took 100 μL of the stock solution, diluted it with in vivo transfection reagent to a total volume of 200 μL and gently mixed the solution. Rats were anaesthetized as above and appropriately positioned. The injectable solutions (10 μL and 50 μM) were stereotactically injected slowly into the lateral ventricle at the following coordinates with the aid of a brain locator: 1.1 mm caudal to bregma, 1.5 mm lateral to the sagittal suture and 4.5 mm in depth.
Statistics
Data are expressed as the mean ± SD of at least five independent experiments. The protective effects were assessed using the GraphPad Prism 6 software (GraphPad, CA, USA). Relative protein semi‐quantification was performed using the QUANTITY ONE software (Bio‐Rad, CA, USA). Differences between groups were assessed by ANOVA. A P value less than 0.05 was considered statistically significant.
Materials
Nef (>99.0%) was purchased from Chenguang Herb Purify Co., Ltd. (Chengdu, China). The positive control EGb761 was purchased from Dr. Willmar Schwabe (Karlsruhe, Germany). t‐BHP was purchased from Aladdin (Shanghai, China). Antibody for Nrf2 (cat# sc‐722) was purchased from Santa Cruz Biotechnology (CA, USA). Antibodies for Keap1 (cat# 4678), p62 (cat# 8025), LC3B (cat# 3868), HO‐1 (cat# 82206), MAP‐2 (cat# 8707), GAPDH (cat# 5174) and PE‐conjugated goat anti‐rabbit IgG (H+L) (cat# 14705) were purchased from Cell Signaling Technology (MA, USA). Resazurin, CQ, 3‐MA, TTC, monodansylcadaverine (MDC), MTT, Hoechst 33342, paraformaldehyde and chloral hydrate were purchased from Sigma (St. Louis, MO, USA). The DCFH2‐DA, MitoSOX Red mitochondrial superoxide indicator, Lipofectamine 2000 and SuperSignal West Femto chemi‐luminescence were purchased from Thermo Fisher Scientific (MA, USA). The LDH assay kit and JC‐1 staining kit (C0016) were purchased from Beyotime Biotechnology (Haimen, China). Entranster‐in vivo RNA transfection reagent was purchased from Engreen (Beijing, China). The siRNAs for Nrf2 and p62 were purchased from Suzhou GenePharma Co., Ltd. Assay kits for GSH‐Px, SOD, MDA, Na+‐K+‐ATPase and Ca2+‐Mg2+‐ATPase were purchased from Nanjing Jiancheng Bioengineering Institute (Nanjing, China).
Nomenclature of targets and ligands
Key protein targets and ligands in this article are hyperlinked to corresponding entries in http://www.guidetopharmacology.org, the common portal for data from the IUPHAR/BPS Guide to PHARMACOLOGY (Harding et al., 2018), and are permanently archived in the Concise Guide to PHARMACOLOGY 2017/18 (Alexander et al., 2017a, 2017b, 2017c).
Results
Nef protected PC12 cells from t‐BHP‐induced cell injury
The viability of the PC12 cells decreased to 50% that of the control group after treatment with t‐BHP. Pre‐ and post‐treatment with Nef (5 and 10 μM) significantly increased the cell viability (Figure 1A). Furthermore, pre‐ and post‐treatment with Nef (1, 5 and 10 μM) decreased t‐BHP‐induced LDH leakage (Figure 1B). At the concentration of 10 μM, Nef provided better protection from t‐BHP‐induced cell injury; thus, further experiments in cells were performed with this concentration. Nef showed marked inhibitory effects on t‐BHP‐induced ROS generation (Figures 1C). Nef also improved mitochondrial morphology, increased the red‐to‐green ratio and decreased ROS generation in the mitochondria (Figure 1D–F), as well as increasing the content of ATP (Figure 1E).
Figure 1.
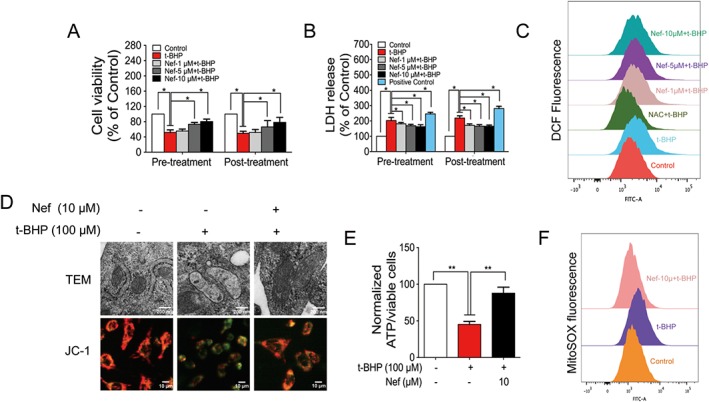
Nef protected PC12 cells from t‐BHP‐induced cell injury. Cell viability (A) and LDH release (B) were determined by MTT assay and LDH kit (n = 5). ROS generation (C) was determined with a DCFH2‐DA probe (n = 5). Mitochondrial structure and mitochondrial membrane potential were observed by TEM and high‐content analyser respectively (n = 5) (D). ATP content was determined with a commercial kit (n = 5) (E). Mitochondrial ROS was determined with MitoSOX probes (n = 5) (F). Data are expressed as the mean ± SD and were analysed by ANOVA. *P < 0.05.
Anti‐cerebral ischaemic effect of Nef in rats subjected to pMCAO
The MCAO was performed on the left side. After 24 h, the behaviour of the animals, cerebral microstructures and activity of oxidative stress‐related enzymes were all disturbed. After 24 h of pMCAO, Nef, at the dosages of 25 and 50 mg·kg−1, significantly decreased neurological scores and infarct volumes, both 15 min prior to MCAO and 6 h after MCAO (Figure 2A–C). At the dosage of 50 mg·kg−1, Nef exhibited more remarkable effects; thus, the subsequent experiments in the rats were performed with this dosage. The NMR results revealed that Nef, at the dosage of 50 mg·kg−1, increased CBF (Figure 2D, panel b, E) and decreased infarct volume (Figure 2D, panel c, F). Regarding the brain microstructure, Nef alleviated the injury to neurons, decreased the oedema of astrocytic end‐feet and improved vascular conditions (Figure 2G). Moreover, Nef increased the activity of SOD (Figure 3A,D) and GSH‐Px (Figure 3B,E) and decreased the concentration of MDA (Figure 3C,F) in serum and brain tissue.
Figure 2.
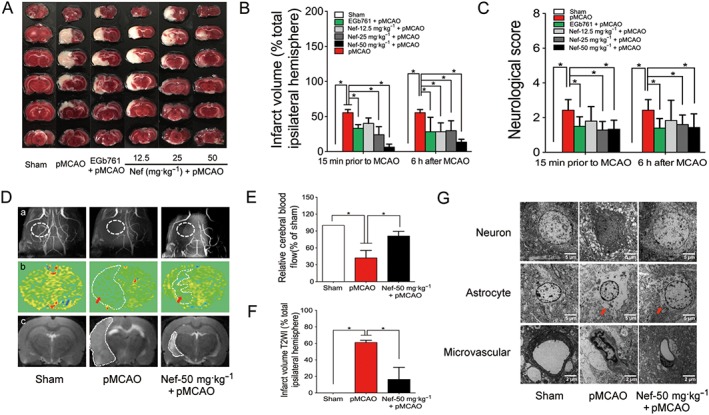
Anti‐cerebral ischaemic effect of Nef in rats subjected to pMCAO. Nef and EGb761 were both administered intragastrically 15 min prior to MCAO and 6 h after MCAO. (A–C) Effects of Nef on infarct volume and neurological deficits (n = 10). Angiography (D, panel a), cerebral blood flow (D, panel b, E) and infarct volume (D, panel c, F) were determined by nuclear magnetism (n = 5). Neuron, astrocyte and microvascular were observed with an electron microscope (n = 5) (G). Data are expressed as the mean ± SD and were analysed by ANOVA. *P < 0.05.
Figure 3.
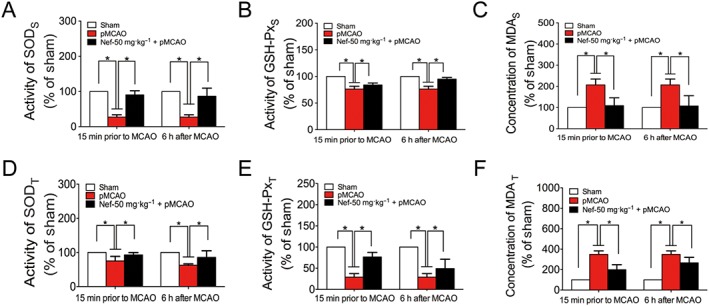
Antioxidant effect of Nef in rats subjected to pMCAO. Nef was administered intragastrically 15 min prior to MCAO and 6 h after MCAO. The activity of SOD (A, D), GSH‐Px (B, E) and the concentration of MDA (C, F) were detected by a commercial kit (n = 10). Data are expressed as the mean ± SD and were analysed by ANOVA. *P < 0.05. Serum was labelled with S, and brain tissue was labelled with T.
Mitochondrial protective effect of Nef in rats subjected to pMCAO
After subjected to pMCAO, rat's brain mitochondrial structures and mitochondrial activity were injured. In the vehicle group, mitochondrial crests fractured, swelled and even ruptured. After Nef (50 mg·kg−1) treatment, the mitochondrial structures improved (Figure 4A). Moreover, Nef increased mitochondrial activity (Figure 4B), the mitochondrial red‐to‐green ratio (Figure 4C), mitochondrial respiration (Figure 4D), mitochondrial Na+‐K+‐ATPase activity (Figure 4E) and mitochondrial Ca2+‐Mg2+‐ATPase activity (Figure 4F).
Figure 4.
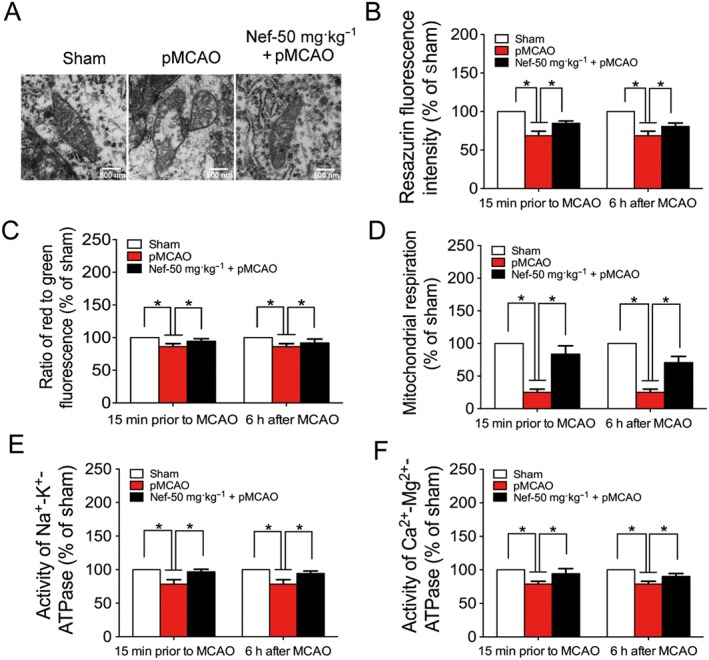
Protective effect of Nef on mitochondria in rats subjected to pMCAO. Nef was administered intragastrically 15 min prior to MCAO and 6 h after MCAO. (A) Mitochondrial structure was observed by TEM (n = 5). Mitochondrial vitality (B) was determined with fluorescence dye resazurin (n = 10). Mitochondrial membrane potential (C), activity of Na+‐K+‐ATPase (E) and Ca2+‐Mg2+‐ATPase (F) were determined with commercial kits (n = 10). Mitochondrial respiration (D) was determined by Oxygraph‐2k (n = 10). Data are expressed as the mean ± SD and were analysed by ANOVA. *P < 0.05.
Nef activated the Nrf2 pathway both in vitro and in vivo
The Nrf2‐ARE signalling pathway is a major mechanism in the cellular defence against oxidative or electrophilic stress. After treatment with t‐BHP, the viability of primary cortical neurons decreased significantly compared to that of the control group, which was dramatically reversed by Nef pretreatment and post‐treatment (Figure 5A). Furthermore, Nef increased the expression of Nrf2 in nucleus in primary cortical neurons (Figure 5B). The immunofluorescence results in PC12 cells revealed that after treatment with t‐BHP, the translocation of Nrf2 to the nucleus was decreased; however, Nef promoted the translocation of Nrf2 from the cytoplasm to the nucleus (Figure 6A). Nef increased the expression of Nrf2 in nucleus (Figure 6B). Meanwhile, Nef decreased the expression of Keap1 and increased HO‐1 and NQO1 expression (Figure 6C). Nef alone protected against t‐BHP induced cell death, which was significantly abolished by co‐treatment with zinc protoporphyrin (ZnPP), an Nrf2 pathway inhibitor (Figure 6D). In addition, Nef also activated the Nrf2 pathway in rats subjected to MCAO (Figure 6E,F). PC12 cells co‐treatment with Nef alone, showed no influence on cell viability, intracellular ROS and Nrf2 protein level (Figure S1).
Figure 5.
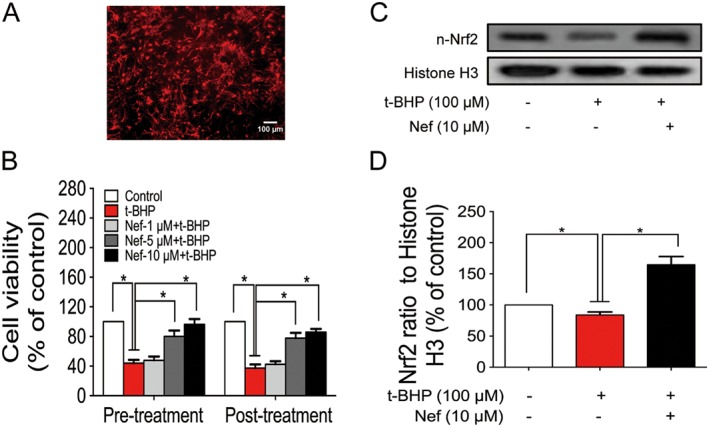
Effect of Nef on primary cortical neurons. Cell identification of primary cortical neuron was determined with MAP‐2 antibody (A). Cell viability was determined by the MTT assay (B). The expression of n‐Nrf2 was determined by Western blotting (C, D). Data are expressed as the mean ± SD and were analysed by ANOVA. *P < 0.05. n‐Nrf2, nucleus‐Nrf2.
Figure 6.
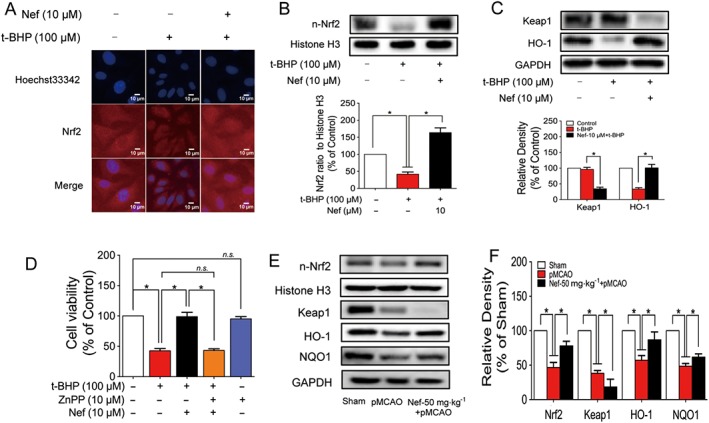
Nef activated the Nrf2 pathway in PC12 cells and rats subjected to pMCAO. The translocation of Nrf2 to the nucleus in PC12 cells was determined by immunofluorescence (n = 5) (A). The expressions of n‐Nrf2, Keap1 and HO‐1 in PC12 cells were determined by Western blotting (n = 5) (B, C). Cell viability with or without ZnPP and Nef was determined by MTT assay (n = 5) (D). The expressions of n‐Nrf2, Keap1, HO‐1 and NQO1 in rats were determined by Western blotting (n = 5) (E, F). Data are expressed as the mean ± SD and were analysed by ANOVA. *P < 0.05. n‐Nrf2, nucleus‐Nrf2; n.s., no significance; ZnPP, zinc protoporphyrin.
Nrf2 played a pivotal role in mitochondrial protection in PC12 cells subjected to t‐BHP
Nrf2 was knocked down in PC12 cells by si‐Nrf2 (Figure 7A). Nef alone increased mitochondrial membrane potentials (Figure 7B), decreased mitochondrial ROS (Figure 7C) and increased ATP content (Figure 7D) in the cells. After Nrf2 knockdown, the mitochondrial protective effect of Nef in PC12 cells was abolished.
Figure 7.
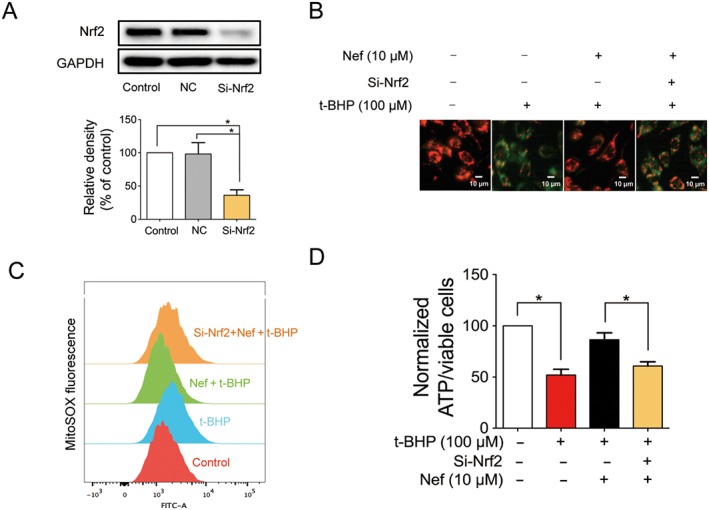
Nrf2 played a pivotal role in mitochondrial protection in PC12 cells subjected to t‐BHP. Nrf2 was knocked down by si‐Nrf2 in PC12 cells (n = 5) (A). Mitochondrial membrane potential (B) and mitochondrial ROS (C) were detected with JC‐1 and MitoSOX probes respectively (n = 5). ATP content was detected with a commercial kit (n = 5) (D). Data are expressed as the mean ± SD and were analysed by ANOVA. *P < 0.05.
Nrf2 played a pivotal role in mitochondrial protection in rats subjected to pMCAO
Nrf2 was knocked down in rats by si‐Nrf2 (Figure 8A). Nef alone decreased neurological scores and infarct volume. After Nrf2 knockdown, the protective effect of Nef was abolished in neurological scores and cerebral infarction (Figure 8B–D). Nef alone protected mitochondrial structures (Figure 8E) and increased both the reduced mitochondrial respiration (Figure 8F) and vitality (Figure 8G). After knockdown of the Nrf2, the mitochondrial protective effect of Nef in rats was abolished.
Figure 8.
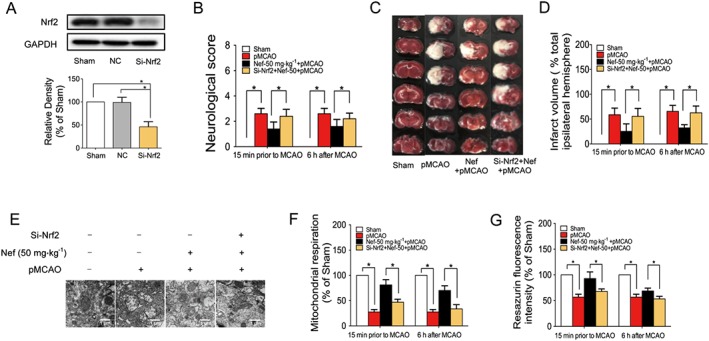
Nrf2 played a pivotal role in mitochondrial protection in rats subjected to pMCAO. Nrf2 was knocked down by si‐Nrf2 in rats (n = 5) (A). Neurological score (B) and infarct volume (C, D) were evaluated (n = 5). Mitochondrial structure was observed by TEM (n = 5) (E). Mitochondrial respiration was determined by Oxygraph‐2k (n = 5) (F). Mitochondrial health was determined by fluorescence dye resazurin (n = 5) (G). Data are expressed as the mean ± SD and were analysed by ANOVA. *P < 0.05.
Nef induced autophagy in PC12 cells subjected to t‐BHP and in rats subjected to pMCAO
The MDC staining results showed that Nef could increase green fluorescence; however, t‐BHP showed no influence on the intensity of the green fluorescence (Figure 9A). Nef alone could up‐regulate the expression of LC‐3II and down‐regulate the expression of p62 (Figure 9C). Nef co‐treatment with t‐BHP could also up‐regulate the expression of LC‐3II and down‐regulate the expression of p62 (Figure 9D). Nef also induced autophagy in rats (Figure 9B). Moreover, Nef decreased the expression of p62 and increased the expression of LC‐3II in rats (Figure 9E).
Figure 9.
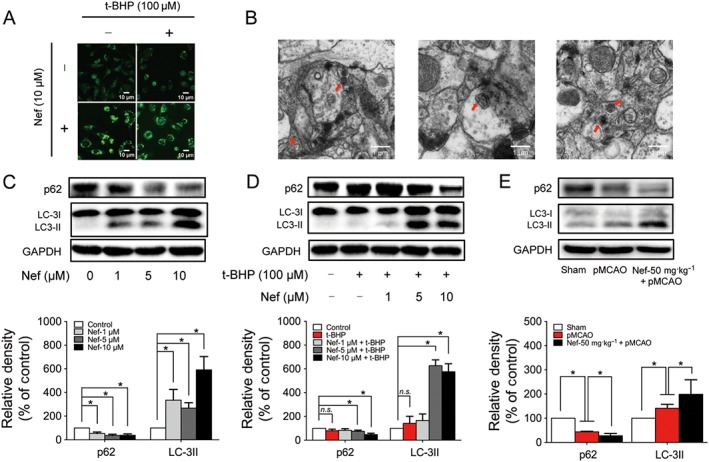
Nef induced autophagy in PC12 cells subjected to t‐BHP and rats subjected to pMCAO. Autophagic vacuoles were determined by MDC staining (A) and observed by TEM (B) (n = 5). The expressions of p62 and LC3 with or without t‐BHP in PC12 cells were determined by Western blotting (n = 5) (C, D). The expressions of p62 and LC3 in rats were determined by Western blotting (n = 5) (E). Data are expressed as the mean ± SD and were analysed by ANOVA. *P < 0.05. n.s., no significance.
Nef protected PC12 cells from t‐BHP injury through the activation of p62–Keap1–Nrf2
An accumulation of literature has reported that the activation of Nrf2 is linked to autophagy. Here, in this study, the autophagy inhibitors CQ and 3‐MA were used to confirm this. After co‐treatment with CQ and Nef, the expression of Nrf2 in the nucleus was further significantly increased compared with the Nef‐treated group. However, after co‐treatment with 3‐MA and Nef, the expression of Nrf2 in the nucleus did not remarkably increase compared to the Nef‐treated group (Figure 10A). The immunofluorescence results further confirmed these results (Figure 10B).
Figure 10.
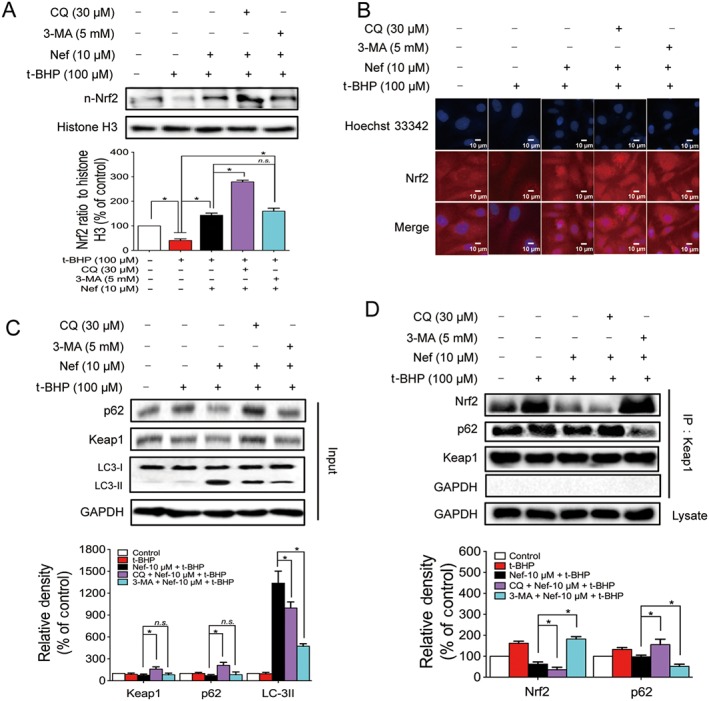
Nef protected PC12 cells from t‐BHP injury through the activation of p62–Keap1–Nrf2. The expressions of n‐Nrf2, p62, Keap1 and LC3 were detected by Western blotting (n = 5) (A, C). The translocation of Nrf2 to the nucleus was determined by immunofluorescence (n = 5) (B). Connections among p62, Keap1 and Nrf2 were detected by immunoprecipitation (n = 5) (D). Data are expressed as the mean ± SD and were analysed by ANOVA. *P < 0.05. n‐Nrf2, nucleus‐Nrf2; n.s., no significance.
Considering that there is relationship between the activation of Nrf2 and autophagy, we subsequently wanted to explore the underlying mechanisms of this relationship. Following pretreatment with the autophagy inhibitor, CQ after the treatment with Nef and t‐BHP, the expressions of p62 and Keap1 were both up‐regulated; however, the early‐phase autophagy inhibitor, 3‐MA, did not remarkably affect the expression of p62 or Keap1 compared with the Nef‐treated group (Figure 10C). The Keap1 IP results showed that, after co‐treatment with CQ and Nef, the p62 interaction with Keap1 increased. Meanwhile, the Nrf2 interaction with Keap1 decreased. After autophagy was completely inhibited by 3‐MA, the p62 interaction with Keap1 decreased significantly and was accompanied by a strong interaction between Nrf2 and Keap1 (Figure 10D).
p62 played a pivotal role in the activation of the Nrf2 pathway
p62 was knocked down in PC12 cells (Figure 11A) and in rats (Figure 11C). Nef alone increased the translocation of Nrf2 to the nucleus. After knockdown of the p62, the translocation of Nrf2 to the nucleus decreased in both PC12 cells (Figure 11B) and rats (Figure 11D).
Figure 11.
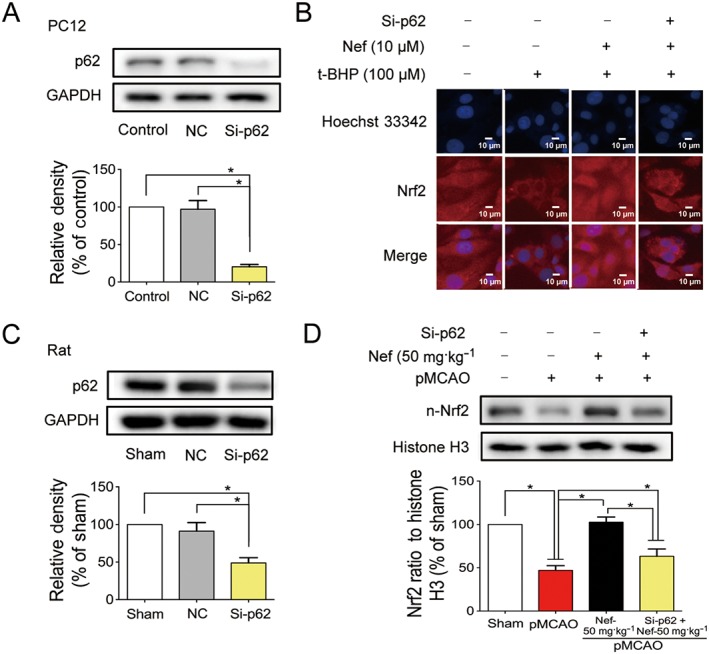
p62 played a pivotal role in the activation of Nrf2 pathway. p62 was knocked down by si‐p62 in both PC12 cell (A) and rats (C) (n = 5). Translocation of Nrf2 to the nucleus in PC12 cells was determined by immunofluorescence (n = 5) (B). The expression of n‐Nrf2 in rats was detected by Western blotting (n = 5) (D). Data are expressed as the mean ± SD and were analysed by ANOVA. *P < 0.05. n‐Nrf2, nucleus‐Nrf2.
Discussion
Stroke is the second most frequent cause of permanent disability that results in costs of approximately 3–7% of the total health care expenditure in high‐income countries (Feigin et al., 2014). The treatment of complex diseases gradually turned to the system‐integrated treatment, with the micro‐environment becoming the focus. Mitochondria are the core of the brain energy micro‐environment and play a role in determining cell death and survival. There is a pressing need to investigate new treatments for patients with acute ischaemic stroke, which classifies most strokes (Chamorro et al., 2016).
In this study, a cell model was used to determine the protective effects of Nef against ischaemic stroke in vitro at first. Oxidative stress was involved among several identified key players in ischaemic cell death within the penumbra (Lo et al., 2005). t‐BHP, a membrane‐permeable oxidant compound (Martin et al., 2001), was used as the oxidative stress stimulus in this cell‐based study. The results showed that Nef increased cell viability and decreased both the release of LDH and the generation of ROS. Moreover, Nef increased mitochondrial membrane potentials and ATP content and decreased mitochondrial ROS in PC12 cells.
Due to the significant effect of Nef on PC12 cells, then the in vivo anti‐cerebral ischaemic effects of Nef were subsequently explored in rats. After the 24 h pMCAO, Nef, at the dosages of 25 and 50 mg·kg−1, significantly decreased neurological scores and infarct volume both PM and AM. The statistical results revealed that pre‐treatment and post‐treatment with Nef were not significantly different. Nef, at the dosage of 50 mg·kg−1, exhibited more remarkable effects; thus, further experiments were performed with this dosage. The NMD results further confirmed that Nef increased the regional CBF and decreased the infarct volume in the acute phase against cerebral ischaemia in in vivo living status.
After the onset of ischaemic stroke, the redox environment was disrupted. The antioxidant enzymes GSH‐Px and SOD decreased, and the content of the oxidation product MDA increased. Nef increased the activity of GSH‐Px and SOD and reduced the content of MDA. Excessive free radicals further attacked the brain tissue, causing tissue damage. The neuronal nuclei condensed, and the electron densities of the neurons increased. The end‐feet of the astrocytes were swollen. Microvascular lumina were crushed and became narrow. Nef regulated the imbalanced neurovascular micro‐environment, namely, by improving neurons, astrocytes and the microvascular.
Accompanied by disturbances of the redox environment and neurovascular micro‐environment, the imbalance in the energy micro‐environment was not avoided under the condition of ischaemic attack. The structure and function of mitochondria in the brain were impaired, which seriously affected the energy supply to the brain and further disturbed the energy micro‐environment (Blomgren et al., 2003; Narne et al., 2017). Thus, a series of further protective effect experiments of Nef were conducted that focused on the mitochondria. Administration of Nef increased the mitochondrial viability, mitochondrial membrane potentials, mitochondrial respiration and the activity of Na+‐K+‐ATPase and Ca2+‐Mg2+‐ATPase both PM and AM. These findings suggested that Nef ameliorated the mitochondrial structural and viability defects and further restored the supply of ATP, which promoted the improvement of the energy micro‐environment in the brain.
Finally, considering the remarkable anti‐ischaemic stroke effects of Nef, in order to verify the energy micro‐environment regulatory effect of Nef, we investigated the underlying mitochondrial protective mechanisms. Nrf2 transcription factors are critically important for the health, homeostasis and longevity of multicellular organisms (Kensler et al., 2007; Sykiotis and Bohmann, 2010; Hayes and Dinkova‐Kostova, 2014). In recent years, one of the important roles of these transcription factors was reported to defend against mitochondrial dysfunction and suppress mitochondria‐related disorders (Holmstrom et al., 2016). The results showed that Nef increased the decreased expression of Nrf2 in the nuclei of PC12 cells, an occurrence that was accompanied by the increased expression of HO‐1 and NQO1, which is downstream of the Nrf2. In addition, by inhibiting the Nrf2–HO‐1 pathway with the HO‐1 inhibitor ZnPP, the protective effect of Nef was abolished. The results implied that the activation of the Nrf2 pathway might protect PC12 cells from oxidative stress injury (Figure 6). Consistent with this finding in cells, the Nrf2 pathway was also activated in rats subjected to pMCAO.
Considering the effects of Nef on activation of Nrf2 and mitochondrial protection, the relationship among these factors was subsequently investigated via Nrf2 knockdown (Figures 7 and 8). Interestingly, the mitochondrial protective effects of Nef were abolished once the Nrf2 had been knocked down. In addition, this result was confirmed both in vivo and in vitro. This revealed that the activation of Nrf2 might be crucial for the mitochondrial protective effect of Nef after ischaemic stroke. Consistent with the results in the PC12 cells, Nef protected against t‐BHP‐induced injury in primary cortical neurons and induced the translocation of Nrf2 to the nucleus. Considering the consistency of the experimental animal species, siRNA was used in Nrf2 knockdown in rats. Though we have obtained positive results in the acute stage of ischaemic stroke, this method could not provide a long duration of the knockout effect, which was a limitation of this study.
In addition to the canonical activation approach of Nrf2, there is still a non‐canonical activation approach that is closely related to autophagy. The autophagosome‐localized protein LC3 plays multiple roles in autophagy, including in membrane fusion, cargo selection and autophagosome transport (Pankiv et al., 2007). p62 contains an LC3‐interacting region that can interact with multiple sites on LC3 (Ichimura et al., 2008), and this interaction is indispensable for autophagic degradation of p62. Moreover, p62 plays pivotal roles in selective autophagy, namely, packaging of ubiquitinated cargo and activation of Nrf2. p62 competes with Nrf2 to interact with Keap1 and then precipitates p62–Keap1 interactions in autophagosomes, which promote the translocation of Nrf2 into the nucleus to induce a battery of Nrf2 target genes encoding antioxidant enzymes; this is the Nrf2 non‐canonical activation approach (Itoh et al., 1999; Fukutomi et al., 2014; Jiang et al., 2015).
Based on the above findings, we next explored the Nef‐induced Nrf2 activation mechanisms. An accumulation of literature has reported that Nef could induce autophagy in PC12 cells (Wong et al., 2015). In addition, this finding was also confirmed in this study. Nef induced autophagy both in PC12 cells and in rats. In PC12 cells pretreated with Nef for 24 h, immediately after the treatment with 100 μM t‐BHP for 1 h, the translocation of Nrf2 to the nucleus increased. The autophagy post‐phase inhibitor CQ further increased the translocation of Nrf2 to the nucleus, which implied the occurrence of Nrf2 non‐canonical activation. After inhibition of autophagy in the early phase, the translocation of Nrf2 did not increase significantly compared with the Nef‐treated group. However, the increase was significant compared with the t‐BHP‐treated group, which implied the occurrence of the Nrf2 canonical activation.
Accompanied by the Nrf2 translocation, there was a down‐regulation of p62 and Keap1. Pretreatment with the autophagy inhibitors CQ, after treatment with Nef and t‐BHP, resulted in up‐regulation of the expression of p62 and Keap1; however, the early‐phase autophagy inhibitor 3‐MA did not remarkably affect the expression of p62 or Keap1 compared with that in the Nef‐treated group. These results implied that there was an interaction between p62 and Keap1. IP was performed to further verify the effects of Nef on p62 and Keap1 interactions. A dramatic decrease in p62‐bound Keap1 was observed in the Nef‐treated group, and this decrease was increased after pretreatment with CQ but was abolished by 3‐MA in PC12 cells. The interaction between Nrf2 and Keap1 was also decreased in the Nef‐treated group, and this interaction was further decreased after pretreated with CQ. After pretreatment with 3‐MA, a strong increase in Nrf2‐bound Keap1 was observed. The IP results revealed that there was an accumulation of p62–Keap1 complexes after inhibition of autophagy; however, this accumulation was abolished by early inhibition by 3‐MA. These results further confirmed the occurrence of the Nrf2 canonical activation.
Consistent with the in vitro results, there existed an increase in Nrf2 and HO‐1 in MCAO rats pretreated with Nef. In addition, the expressions of Keap1 and p62 showed the same tendency in MCAO rats pretreated with Nef, which implied that the p62–Keap1–Nrf2 pathway was activated in vivo. We further confirmed this result via p62 knockdown both in PC12 cells and in rats. The results revealed that, after knockdown of p62, the translocation of Nrf2 to the nucleus was significantly decreased, implying the activation of p62–Keap1–Nrf2 both in vivo and in vitro.
In conclusion, this study provided comprehensive evidence supporting the potential effects of Nef on ischaemic stroke and the underlying protective mechanisms of this alkaloid. The data supported the idea that Nef exerts its anti‐ischaemic effects not only through routine vascular protection (increased the regional CBF) but also through multi‐target protection. Clearly, the effects of Nef are not limited to one pathway, but the therapeutic effects in this study could be expressed mainly via mitochondrial protection. In addition, this protection was attributed to Nrf2 signalling activation (Figure 12). The results showed that Nef might be a promising neuroprotective agent against ischaemic stroke, and further study is needed for clinical use in the future.
Figure 12.
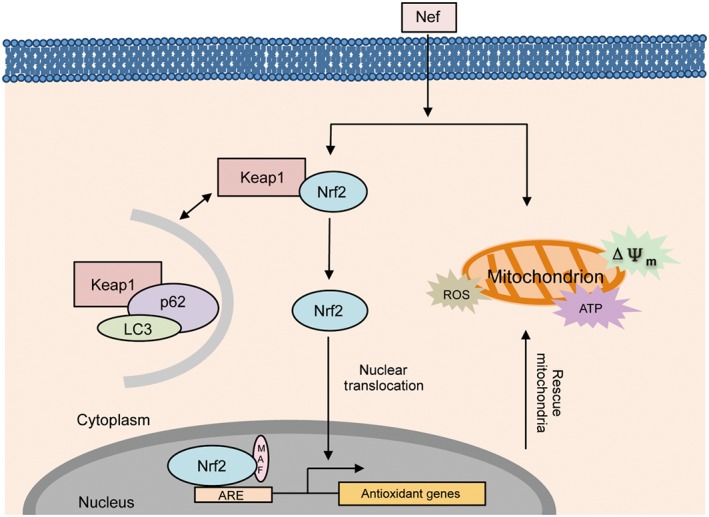
Nef has a protective effect on mitochondria through activation of the p62–Keap1–Nrf2 pathway in cerebral ischaemia. Upon the onset of the ischaemic stroke, the mitochondria were damaged. Nef increased the translocation of Nrf2 to the nucleus through the activation of the p62–Keap1–Nrf2 pathway and further rescued mitochondria.
Author contributions
C.H.W., S.J.L. and X.P.C. conceived and designed the experiments. C.H.W., R.C.Y. and F.P.D. performed the experiments. C.H.W. and J.X.C. collected, analysed and interpreted the data. C.H.W. wrote the manuscript. S.J.L. and X.P.C. supervised the study.
Conflict of interest
The authors declare no conflicts of interest.
Declaration of transparency and scientific rigour
This Declaration acknowledges that this paper adheres to the principles for transparent reporting and scientific rigour of preclinical research recommended by funding agencies, publishers and other organisations engaged with supporting research.
Supporting information
Figure S1 Influence of Nef alone on PC12 cells
Figure S2 Morphology change of PC12 cells after differentiated by NGF
Acknowledgements
This study was supported by grants from the National Natural Science Foundation of China (nos 81303261, 81473521 and 81274133), the Major Scientific and Technological Special Project for ‘Significant New Drugs Creation’ (no. 2012ZX09103‐201‐055), the Fundamental Research Funds for the Central public welfare research institutes of China (ZZ2014060 and ZXKT17040), the Science and Technology Development Fund of Macau Special Administrative Region (FDCT) (no. 078/2016/A2) and the Research Fund of University of Macau (MYRG2016‐00043‐ICMS‐QRCM); Beijing Nova Program (2011069); and Foundation of Beijing University of Chinese Medicine Basic Scientific Research Business Expenses (2011‐CXTD‐06).
Wu, C. , Chen, J. , Yang, R. , Duan, F. , Li, S. , and Chen, X. (2019) Mitochondrial protective effect of neferine through the modulation of nuclear factor erythroid 2‐related factor 2 signalling in ischaemic stroke. British Journal of Pharmacology, 176: 400–415. 10.1111/bph.14537.
Contributor Information
Shaojing Li, Email: shaojingli2004@126.com.
Xiuping Chen, Email: xpchen@umac.mo.
References
- Alexander SPH, Fabbro D, Kelly E, Marrion NV, Peters JA, Faccenda E et al (2017a). The Concise Guide to PHARMACOLOGY 2017/18: Enzymes. Br J Pharmacol 174: S272–S359. [DOI] [PMC free article] [PubMed] [Google Scholar]
- Alexander SP, Kelly E, Marrion NV, Peters JA, Faccenda E, Harding SD et al (2017b). The Concise Guide to PHARMACOLOGY 2017/18: overview. Br J Pharmacol 174: S1–S16. [DOI] [PMC free article] [PubMed] [Google Scholar]
- Alexander SPH, Kelly E, Marrion NV, Peters JA, Faccenda E, Harding SD et al (2017c). The Concise Guide to PHARMACOLOGY 2017/18: Transporters. Br J Pharmacol 174: S360–S446. [DOI] [PMC free article] [PubMed] [Google Scholar]
- Baird L, Swift S, Lleres D, Dinkova‐Kostova AT (2014). Monitoring Keap1‐Nrf2 interactions in single live cells. Biotechnol Adv 32: 1133–1144. [DOI] [PMC free article] [PubMed] [Google Scholar]
- Baxter P, Chen Y, Xu Y, Swanson RA (2014). Mitochondrial dysfunction induced by nuclear poly (ADP‐ribose) polymerase‐1: a treatable cause of cell death in stroke. Transl Stroke Res 5: 136–144. [DOI] [PMC free article] [PubMed] [Google Scholar]
- Blomgren K, Zhu C, Hallin U, Hagberg H (2003). Mitochondria and ischemic reperfusion damage in the adult and in the developing brain. Biochem Biophys Res Commun 304: 551–559. [DOI] [PubMed] [Google Scholar]
- Chamorro A, Dirnagl U, Urra X, Planas AM (2016). Neuroprotection in acute stroke: targeting excitotoxicity, oxidative and nitrosative stress, and inflammation. Lancet Neurol 15: 869–881. [DOI] [PubMed] [Google Scholar]
- Chen SD, Yang DI, Lin TK, Shaw FZ, Liou CW, Chuang YC (2011). Roles of oxidative stress, apoptosis, PGC‐1α and mitochondrial biogenesis in cerebral ischemia. Int J Mol Sci 12: 7199–7215. [DOI] [PMC free article] [PubMed] [Google Scholar]
- Dixon SJ, Lemberg KM, Lamprecht MR, Skouta R, Zaitsev EM, Gleason CE et al (2012). Ferroptosis: an iron‐dependent form of nonapoptotic cell death. Cell 149: 1060–1072. [DOI] [PMC free article] [PubMed] [Google Scholar]
- Donnan GA, Fisher M, Macleod M, Davis SM (2008). Stroke. Lancet 371: 1612–1623. [DOI] [PubMed] [Google Scholar]
- Duleh S, Wang X, Komirenko A, Margeta M (2016). Activation of the Keap1/Nrf2 stress response pathway in autophagic vacuolar myopathies. Acta Neuropathol Commun 4: 115. [DOI] [PMC free article] [PubMed] [Google Scholar]
- Feigin VL, Forouzanfar MH, Krishnamurthi R, Mensah GA, Connor M, Bennett DA et al (2014). Global and regional burden of stroke during 1990–2010: findings from the Global Burden of Disease Study 2010. Lancet 383: 245–254. [DOI] [PMC free article] [PubMed] [Google Scholar]
- Field KJ, White WJ, Lang CM (1993). Anaesthetic effects of chloral hydrate, pentobarbitone and urethane in adult male rats. Lab Anim. 27: 258–269. [DOI] [PubMed] [Google Scholar]
- Fuhrmann DC, Brune B (2017). Mitochondrial composition and function under the control of hypoxia. Redox Biol 12: 208–215. [DOI] [PMC free article] [PubMed] [Google Scholar]
- Fukutomi T, Takagi K, Mizushima T, Ohuchi N, Yamamoto M (2014). Kinetic, thermodynamic, and structural characterizations of the association between Nrf2‐DLGex degron and Keap1. Mol Cell Biol 34: 832–846. [DOI] [PMC free article] [PubMed] [Google Scholar]
- Furukawa H (1965). On the alkaloids of Nelumbo nucifera Gaertn. IX. Alkaloids of loti embryo. (2). Structure of neferine, a new biscoclaurine alkaloid. Yakugaku Zasshi 85: 335–338. [PubMed] [Google Scholar]
- Hancock R, Schaap M, Pfister H, Wells G (2013). Peptide inhibitors of the Keap1‐Nrf2 protein‐protein interaction with improved binding and cellular activity. Org Biomol Chem 11: 3553–3557. [DOI] [PubMed] [Google Scholar]
- Hanley PC, Zinsmeister AR, Clements IP, Bove AA, Brown ML, Gibbons RJ (1989). Gender‐related differences in cardiac response to supine exercise assessed by radionuclide angiography. J Am Coll Cardiol 13: 624–629. [DOI] [PubMed] [Google Scholar]
- Harding SD, Sharman JL, Faccenda E, Southan C, Pawson AJ, Ireland S et al (2018). The IUPHAR/BPS Guide to PHARMACOLOGY in 2018: updates and expansion to encompass the new guide to IMMUNOPHARMACOLOGY. Nucl Acids Res 46: D1091–D1106. [DOI] [PMC free article] [PubMed] [Google Scholar]
- Hayes JD, Dinkova‐Kostova AT (2014). The Nrf2 regulatory network provides an interface between redox and intermediary metabolism. Trends Biochem Sci 39: 199–218. [DOI] [PubMed] [Google Scholar]
- Holmstrom KM, Baird L, Zhang Y, Hargreaves I, Chalasani A, Land JM et al (2013). Nrf2 impacts cellular bioenergetics by controlling substrate availability for mitochondrial respiration. Biol Open 2: 761–770. [DOI] [PMC free article] [PubMed] [Google Scholar]
- Holmstrom KM, Kostov RV, Dinkova‐Kostova AT (2016). The multifaceted role of Nrf2 in mitochondrial function. Curr Opin Toxicol 1: 80–91. [DOI] [PMC free article] [PubMed] [Google Scholar]
- Hu L, Magesh S, Chen L, Wang L, Lewis TA, Chen Y et al (2013). Discovery of a small‐molecule inhibitor and cellular probe of Keap1‐Nrf2 protein‐protein interaction. Bioorg Med Chem Lett 23: 3039–3043. [DOI] [PMC free article] [PubMed] [Google Scholar]
- Hui L, Chen Y (2015). Tumor microenvironment: sanctuary of the devil. Cancer Lett 368: 7–13. [DOI] [PubMed] [Google Scholar]
- Ichimura Y, Kumanomidou T, Sou YS, Mizushima T, Ezaki J, Ueno T et al (2008). Structural basis for sorting mechanism of p62 in selective autophagy. J Biol Chem 283: 22847–22857. [DOI] [PubMed] [Google Scholar]
- Ichimura Y, Waguri S, Sou YS, Kageyama S, Hasegawa J, Ishimura R et al (2013). Phosphorylation of p62 activates the Keap1‐Nrf2 pathway during selective autophagy. Mol Cell 51: 618–631. [DOI] [PubMed] [Google Scholar]
- Itoh K, Wakabayashi N, Katoh Y, Ishii T, Igarashi K, Engel JD et al (1999). Keap1 represses nuclear activation of antioxidant responsive elements by Nrf2 through binding to the amino‐terminal Neh2 domain. Genes Dev 13: 76–86. [DOI] [PMC free article] [PubMed] [Google Scholar]
- Jiang T, Harder B, Rojo de la Vega M, Wong PK, Chapman E, Zhang DD (2015). p62 links autophagy and Nrf2 signaling. Free Radic Biol Med 88: 199–204. [DOI] [PMC free article] [PubMed] [Google Scholar]
- Jiang WL, Zhang SP, Zhu HB, Jian H, Tian JW (2010). Cornin ameliorates cerebral infarction in rats by antioxidant action and stabilization of mitochondrial function. Phytother Res: PTR 24: 547–552. [DOI] [PubMed] [Google Scholar]
- Jung HA, Karki S, Kim JH, Choi JS (2015). BACE1 and cholinesterase inhibitory activities of Nelumbo nucifera embryos. Arch Pharm Res 38: 1178–1187. [DOI] [PubMed] [Google Scholar]
- Kensler TW, Wakabayashi N, Biswal S (2007). Cell survival responses to environmental stresses via the Keap1‐Nrf2‐ARE pathway. Annu Rev Pharmacol Toxicol 47: 89–116. [DOI] [PubMed] [Google Scholar]
- Kilkenny C, Browne W, Cuthill IC, Emerson M, Altman DG (2010). Animal research: reporting in vivo experiments: the ARRIVE guidelines. Br J Pharmacol 160: 1577–1579. [DOI] [PMC free article] [PubMed] [Google Scholar]
- Lin TN, He YY, Wu G, Khan M, Hsu CY (1993). Effect of brain edema on infarct volume in a focal cerebral ischemia model in rats. Stroke 24: 117–121. [DOI] [PubMed] [Google Scholar]
- Liu Y, Zhang L, Liang J (2015). Activation of the Nrf2 defense pathway contributes to neuroprotective effects of phloretin on oxidative stress injury after cerebral ischemia/reperfusion in rats. J Neurol Sci 351: 88–92. [DOI] [PubMed] [Google Scholar]
- Lo EH, Moskowitz MA, Jacobs TP (2005). Exciting, radical, suicidal: how brain cells die after stroke. Stroke 36: 189–192. [DOI] [PubMed] [Google Scholar]
- Longa EZ, Weinstein PR, Carlson S, Cummins R (1989). Reversible middle cerebral artery occlusion without craniectomy in rats. Stroke 20: 84–91. [DOI] [PubMed] [Google Scholar]
- Martin C, Martinez R, Navarro R, Ruiz‐Sanz JI, Lacort M, Ruiz‐Larrea MB (2001). tert‐Butyl hydroperoxide‐induced lipid signaling in hepatocytes: involvement of glutathione and free radicals. Biochem Pharmacol 62: 705–712. [DOI] [PubMed] [Google Scholar]
- Michelson DJ, Ashwal S (2004). The pathophysiology of stroke in mitochondrial disorders. Mitochondrion 4: 665–674. [DOI] [PubMed] [Google Scholar]
- Moretti A, Ferrari F, Villa RF (2015). Neuroprotection for ischaemic stroke: current status and challenges. Pharmacol Ther 146: 23–34. [DOI] [PubMed] [Google Scholar]
- Mozaffarian D, Benjamin EJ, Go AS, Arnett DK, Blaha MJ, Cushman M et al (2016). Heart disease and stroke statistics – 2016 update: a report from the American Heart Association. Circulation 133: e38–e360. [DOI] [PubMed] [Google Scholar]
- Narayana Moorthy NS, Ramos MJ, Fernandes PA (2013). Human ether‐a‐go‐go‐related gene channel blockers and its structural analysis for drug design. Curr Drug Targets 14: 102–113. [DOI] [PubMed] [Google Scholar]
- Narne P, Pandey V, Phanithi PB (2017). Interplay between mitochondrial metabolism and oxidative stress in ischemic stroke: an epigenetic connection. Mol Cell Neurosci 82: 176–194. [DOI] [PubMed] [Google Scholar]
- Nguyen T, Nioi P, Pickett CB (2009). The Nrf2‐antioxidant response element signaling pathway and its activation by oxidative stress. J Biol Chem 284: 13291–13295. [DOI] [PMC free article] [PubMed] [Google Scholar]
- Pankiv S, Clausen TH, Lamark T, Brech A, Bruun JA, Outzen H et al (2007). p62/SQSTM1 binds directly to Atg8/LC3 to facilitate degradation of ubiquitinated protein aggregates by autophagy. J Biol Chem 282: 24131–24145. [DOI] [PubMed] [Google Scholar]
- Poornima P, Weng CF, Padma VV (2013). Neferine from Nelumbo nucifera induces autophagy through the inhibition of PI3K/Akt/mTOR pathway and ROS hyper generation in A549 cells. Food Chem 141: 3598–3605. [DOI] [PubMed] [Google Scholar]
- Sims NR, Muyderman H (2010). Mitochondria, oxidative metabolism and cell death in stroke. Biochim Biophys Acta 1802: 80–91. [DOI] [PubMed] [Google Scholar]
- Sugimoto Y, Furutani S, Itoh A, Tanahashi T, Nakajima H, Oshiro H et al (2008). Effects of extracts and neferine from the embryo of Nelumbo nucifera seeds on the central nervous system. Phytomedicine 15: 1117–1124. [DOI] [PubMed] [Google Scholar]
- Sugimoto Y, Furutani S, Nishimura K, Itoh A, Tanahashi T, Nakajima H et al (2010). Antidepressant‐like effects of neferine in the forced swimming test involve the serotonin1A (5‐HT1A) receptor in mice. Eur J Pharmacol 634: 62–67. [DOI] [PubMed] [Google Scholar]
- Sykiotis GP, Bohmann D (2010). Stress‐activated cap'n'collar transcription factors in aging and human disease. Sci Signal 3: re3. [DOI] [PMC free article] [PubMed] [Google Scholar]
- Wolinski P, Glabinski A (2013). Chemokines and neurodegeneration in the early stage of experimental ischemic stroke. Mediators Inflamm 2013: 727189. [DOI] [PMC free article] [PubMed] [Google Scholar]
- Wong VKW, Wu AG, Wang JR, Liu L, Law BY‐K (2015). Neferine attenuates the protein level and toxicity of mutant huntingtin in PC‐12 cells via induction of autophagy. Molecules 20: 3496–3514. [DOI] [PMC free article] [PubMed] [Google Scholar]
- Xin W, Huang C, Zhang X, Xin S, Zhou Y, Ma X et al (2014). Methyl salicylate lactoside inhibits inflammatory response of fibroblast‐like synoviocytes and joint destruction in collagen‐induced arthritis in mice. Br J Pharmacol 171: 3526–3538. [DOI] [PMC free article] [PubMed] [Google Scholar]
- Xu Y, Fang F, Miriyala S, Crooks PA, Oberley TD, Chaiswing L et al (2013). KEAP1 is a redox sensitive target that arbitrates the opposing radiosensitive effects of parthenolide in normal and cancer cells. Cancer Res 73: 4406–4417. [DOI] [PMC free article] [PubMed] [Google Scholar]
- Yin S, Cao W (2015). Toll‐like receptor signaling induces Nrf2 pathway activation through p62‐triggered Keap1 degradation. Mol Cell Biol 35: 2673–2683. [DOI] [PMC free article] [PubMed] [Google Scholar]
- Zhao J, Zhang X, Dong L, Wen Y, Zheng X, Zhang C et al (2015). Cinnamaldehyde inhibits inflammation and brain damage in a mouse model of permanent cerebral ischaemia. Br J Pharmacol 172: 5009–5023. [DOI] [PMC free article] [PubMed] [Google Scholar]
- Zhou YJ, Xiang JZ, Yuan H, Liu H, Tang Q, Hao HZ et al (2013). Neferine exerts its antithrombotic effect by inhibiting platelet aggregation and promoting dissociation of platelet aggregates. Thromb Res 132: 202–210. [DOI] [PubMed] [Google Scholar]
Associated Data
This section collects any data citations, data availability statements, or supplementary materials included in this article.
Supplementary Materials
Figure S1 Influence of Nef alone on PC12 cells
Figure S2 Morphology change of PC12 cells after differentiated by NGF


