

Abstract
Objective:
To examine the effect of the diagnosis of asymptomatic disease on health-related quality of life (HRQoL).
Design:
Secondary analysis of a national dataset.
Method:
We analyzed adult participants in the 2011–2012 National Health and Nutrition Examination Survey (NHANES) of the civilian non-institutionalized United States general population. Across three asymptomatic diseases (glucose intolerance, hyperlipidemia, hypertension), we examined four groups (without disease; with disease but no diagnosis; with disease and diagnosis but no treatment; with disease, diagnosis, and treatment). For each asymptomatic disease, we examined group differences in self-rated health (ordinal logistic regression) and Healthy Day outcomes (number of the last 30 days that physical health was not good, mental health was not good, or inactive; regression). Models were adjusted for age, sex, smoking status, insurance status, income, education, race, body mass index, and comorbid conditions.
Results:
Analyses included 6012 respondents (glucose intolerance), 2772 respondents (hyperlipidemia), and 5524 respondents (hypertension). In adjusted models, those who did not know about their disease had the same self-rated health scores as those without the disease, those with the disease without treatment, and those with disease and treatment. In adjusted analyses of the Healthy Days questions, those with unknown disease reported the same number of unhealthy days as those without disease with the exception of glucose intolerance. Conversely, in four of the nine possible comparisons, those with known disease without treatment reported more unhealthy days that those with who did not know about their disease.
Conclusions:
In adjusted analyses, individuals knowing about their asymptomatic disease are more likely to experience decrements in healthy days compared to those without knowledge of their asymptomatic disease.
Keywords: HRQoL, diagnosis, glucose intolerance, hyperlipidemia, hypertension
Introduction
Asymptomatic disease is common among adults in the United States, as there are an estimated 71 million with hyperlipidemia, 67 million with hypertension, 29 million with diabetes, and 86 million with pre-diabetes (Centers for Disease Control and Prevention [CDC], 2014; CDC, 2015a; CDC, 2015b). Screening for these diseases is part of routine health care because early detection and treatment of these diseases reduces morbidity and mortality later in life. For example, early detection and treatment of hypertension reduces future risk of stroke. There are a wide variety of considerations taken into account with the initiation of screening programs for asymptomatic diseases, including economic costs of screening, treatment options, and benefits of early treatment (Harris et al., 2001).
While early treatment of these diseases can reduce the risk of negative health outcomes later in life, being labeled with a disease and undergoing medical interventions can introduce the risk of adverse physical, mood, and cognitive effects. Medication side effects are common for many of the leading treatments for asymptomatic illness (Bailey & Turner, 1996; Armitage, 2007; Kaplan, 1992). For individuals who experience adverse effects from medication, treatment of an asymptomatic illness could, ironically, result in lower health-related quality of life (HRQoL) compared to individuals who do not receive treatment until a substantial sequela (e.g., stroke or vision loss) occurs. Empirical evidence from research on the psychology of illness supports the notion that awareness of a diagnosis may reduce general health perceptions by change in illness identity (Hagger & Orbell, 2003) or perception of symptoms (Petersen, van den Berg, Janssens, & Van den Bergh, 2011). In a classic health psychology experiment conducted by Baumann and colleagues (1989), participants were randomly assigned to receive bogus diagnostic feedback that their blood pressure was high. These participants were more likely to report experiencing physical symptoms associated with high blood pressure than the group who received diagnostic feedback that their blood pressure was normal. Additionally, being labeled with an illness has potential cognitive consequences, such as increased worry or rumination (Hagger & Orbell, 2003), and introduces the societal judgment of illness stigma (Martinez & Hinshaw, 2016; Quinn & Earnshaw, 2011). Among individuals living with chronic illness, anticipated illness stigma is associated with lower in quality of life via increases in stress (Earnshaw, Quinn, & Park, 2011). Experimental research has demonstrated physiological changes of stigma activation. Among a sample of 122 veterans living with hypertension, using a subtle manipulation to activate their hypertensive label associated with acute increases in anxiety and acute increases in blood pressure among older individuals who were invested in living independently (Auman, Bosworth, & Hess, 2005).
There has been sparse evaluation of the association between diagnosis of asymptomatic diseases and HRQoL in population studies. Previous studies comparing individuals who do and do not know their diagnosis have included patients receiving treatment in the group aware of their diagnosis, which impedes the ability to isolate the effects of diagnosis from the effects of treatment (Edelman, Olsen, Dudley, Harris, & Oddone, 2002; Erickson, Williams, & Gruppen, 2001; Jørgensen, Langhammer, Krokstad, & Forsmo, 2014; Lawrence, Fryback, Martin, Klein, & Klein, 1996). The most commonly used large dataset for such analyses has been the National Health and Nutrition Examination Survey (NHANES), which combines diagnostic and survey information. Previous NHANES studies focused on a single condition (i.e., hypertension) have found that the diagnosis of hypertension was associated with lower self-rated health than the treatment of hypertension (Hayes, Denny, Keenan, Croft, & Greenlund, 2008; Barger & Muldoon, 2006). In this report, we expand upon prior work to examine three asymptomatic diseases which were detected during the physical and laboratory examination of the 2011–2012 NHANES survey: hypertension, as in previous reports, as well as the first examination of glucose intolerance and hyperlipidemia. Using a combination of objective information and participants’ self-reports we categorized individuals into four groups: those living with (1) no disease; (2) undiagnosed asymptomatic disease; (3) diagnosed, untreated asymptomatic disease; and (4) diagnosed, treated asymptomatic disease. We included all four groups to allow for detailed comparisons, but specifically hypothesized that individuals in group 3 would report lower HRQoL than individuals in group 2. That is, we predict that individuals who are aware of their asymptotic disease (and are not receiving treatment) would report lower HRQoL than individuals who are living with asymptomatic disease, and are unaware of it.
Method
Participant Dataset
We used publicly available data from the 2011–2012 NHANES (CDC, 2010). NHANES samples civilian, non-institutionalized residents of the United States. It is a continuous annual survey with a complex, stratified, multistage probability sample design. All persons are interviewed in their home and asked to have a health examination at a mobile examination center. We used all respondents age 18 and older in the 2011–2012 NHANES with examination data as this was the last year that the healthy days outcomes were collected. The unweighted response rate in 2011–2012 was 67.3% for the adult interviewed sample and 64.5% for the adult examined sample.
Measures
Asymptomatic disease classifications.
Three diseases captured by NHANES fulfilled the following criteria: (1) the disease is generally asymptomatic, (2) the disease can be diagnosed using physiological measurements from NHANES, (3) participants are directly asked if they have been diagnosed with the disease, and (4) participants are directly asked if they are currently being treated for the disease with medications. The three diseases that met these criteria were hyperlipidemia, diagnosed by low-density lipoprotein higher than 190 mg/dL in a fasting venipuncture sample (Report of the National Cholesterol Education Program, 2001); glucose intolerance/diabetes mellitus (hereafter referred to as “glucose intolerance”), diagnosed by hemoglobin A1C greater than 5.6 mmol/L from any venipuncture sample (American Diabetes Association, 2010); and hypertension, diagnosed by average of three blood pressure measurements with average systolic blood pressure greater than 140 mmHg or average diastolic blood pressure greater than 90 mmHg (Chobanian et al., 2003). We excluded individuals from the glucose intolerance group with a hemoglobin A1C greater than 10, given that these levels of glucose can result in physical symptoms.
Diagnostic groups.
Using the asymptomatic disease classifications, we created the following four groups of respondents for each disease (1) No Disease referred to those who reported not being diagnosed with the disease and did not meet criteria for diagnosis, (2) Unknown Disease referred to those who reported not being diagnosed with the condition and met the criteria for diagnosis, (3) Known Disease without Treatment indicated those who reported being diagnosed with the disease but not prescribed medications for it, and (4) Known Disease with Treatment was assigned to those who reported being diagnosed with the condition and prescribed medications for it.
Health related Quality of Life outcomes.
HRQoL is a complex, multi-dimensional concept (Wilson & Cleary, 1995) which has been quantified in several ways. For this analysis, we use the standard measures of HRQoL as measured by the Center for Disease Control for population health measurement; self-rated health and the Heathy Days Measures (https://www.cdc.gov/hrqol/methods.htm). Self-rated health is one of the most basic and fundamental HRQoL measures. It is a well-studied outcome and is predictive of a wide range of other outcomes, including mortality and medical expenditures (DeSalvo, Bloser, Reynolds, He, & Muntner, 2006; DeSalvo et al, 2009). The Healthy Days questions ask how many days in the last 30 physical health was not good, mental health was not good, and poor health kept someone from their usual activities.
Self-rated health.
The primary outcome of interest was response to the statement, “In general, my health is: excellent, very good, good, fair, poor.”
Healthy days.
Participants responded to three items regarding their functioning over the previous 30 days: (1) the number of days physical health was not good in the last 30 days, (2) the number of days mental health was not good in the last 30 days, and (3) the number of inactive days due to physical or mental health.
Demographic and health history variables.
Adjusted models included other personal factors that could influence HRQoL: age in years; sex; smoking status (yes/no); insurance status (yes/no); income (0-$19 999; $20 000-$44 999; $45 000-$99 999; and $100 000 or more); education (less than high school, high school graduated/GED or equivalent, some college or associates degree, and college graduate or above); race/ethnicity (Non-Hispanic White, Mexican American, Other Hispanic, Non-Hispanic Black, Non-Hispanic Asian, Other); and body mass index (BMI). Additionally, other chronic health conditions were included as an additional control variable. Chronic health conditions were operationalized as a sum of the self-reported presence of the following health conditions: angina, arthritis, asthma, cancer, chronic bronchitis, emphysema, heart attack, heart disease, heart failure, liver condition, psoriasis, stroke, and thyroid problem. The number of comorbid chronic conditions was analyzed as 0, 1, 2, or 3 or more.
Analyses
Self-rated health was analyzed using ordinal logistic regression models. The three health conditions were analyzed separately using diagnostic group while adjusted for demographic and other chronic health conditions. Self-rated health was coded such that the results are the odds of reporting worse self-rated health; odds above 1.0 represent worse self-rated health. Healthy days measures were analyzed using multivariate regression. The three health conditions were analyzed separately using diagnostic group while adjusted for demographic and medical variables. In these models, parameter estimates represent number of unhealthy days; positive numbers represent worse health. All regression analyses included the weights, strata, and clusters provided in NHANES so that results are representative of the USA. Analyses were performed with SAS 9.4 (PROC FREQ, PROC SURVEYLOGISTIC, and PROC SURVEYREG).
The funding organizations had no role in the design and conduct of the study; in the collection, analysis, and interpretation of the data; or in the preparation, review, or approval of the manuscript. These analyses did not require IRB approval as they are a secondary analysis of publicly available, deidentified data.
Results
The number of respondents analyzed for each disease was 6104 for glucose intolerance, 2773 for hyperlipidemia, and 5524 for hypertension (Table 1). Ninety-eight percent of respondents with hyperlipidemia had been diagnosed by a health care provider, 85% of respondents with hypertension, and only 40% of respondents with glucose intolerance, consistent with prior reports (Bowen, Xuan, Halm, 2014). Demographic information by disease and diagnosis category is in the Appendix. Respondents without the diseases tended to be younger, non-smokers, have lower BMI, and less comorbidity than respondents with the diseases.
Table 1.
Demographics for Three Asymptomatic Diagnostic Conditions
| Glucose Intolerance | Hyperlipidemia | Hypertension | |
|---|---|---|---|
| Total No. Respondents | 6012 | 2772 | 5524 |
| No disease, No. (%) | 3805 (63.3) | 1566 (56.5) | 3478 (63.0) |
| Unknown disease, No. (%) | 1329 (22.1) | 26 (0.9) | 302 (5.5) |
| Known disease without treatment, No. (%) | 322 (5.4) | 254 (9.2) | 223 (4.0) |
| Known disease with treatment, No. (%) | 556 (9.2) | 926 (33.4) | 1521 (27.5) |
| Age, mean ± SD | 42.5 ± 20.6 | 51.9 ± 17.9 | 46.3 ± 19.5 |
| Female, No. (%) | 3023 (50.2) | 1426 (51.4) | 2805 (50.8) |
| Ever smoker, No. (%) | 2084 (34.6) | 1227 (44.2) | 2119 (38.3) |
| Income | |||
| $0 – $19 999 | 1366 (22.7) | 682 (24.6) | 1320 (23.9) |
| $20 000 – $44 999 | 1906 (31.7) | 871 (31.4) | 1726 (31.2) |
| $45 000 – $99 999 | 1446 (24.0) | 648 (23.3) | 1305 (23.6) |
| $100 000 and more | 996 (16.5) | 422 (15.2) | 884 (16.0) |
| Education, No. (%) | |||
| Less than high school | 2063 (34.3) | 682 (24.6) | 1566 (28.3) |
| High school graduate or GED | 1102 (18.3) | 592 (21.3) | 1107 (20.0) |
| Some college or associates degree | 1575 (26.2) | 822 (29.6) | 1575 (28.5) |
| College graduate or above | 1270 (21.1) | 674 (24.3) | 1273 (23.0) |
| Race/ethnicity, No. (%) | |||
| Mexican American | 671 (11.1) | 257 (9.2) | 560 (10.1) |
| Other Hispanic | 631 (10.5) | 293 (10.5) | 560 (10.1) |
| Non-Hispanic White | 2085 (34.6) | 1076 (38.8) | 1956 (35.4) |
| Non-Hispanic Black | 1593 (26.5) | 688 (24.8) | 1515 (27.4) |
| Non-Hispanic Asian | 844 (14.0) | 389 (14.0) | 772 (13.9) |
| Other race including multi-racial | 188 (3.1) | 69 (2.49) | 161 (2.9) |
| Body mass index, mean ± SD | 27.8 ± 7.0 | 28.9 ± 6.8 | 28.3 ± 6.9 |
| Number of comorbidities, mean ± SD | 0.8 ± 1.1 | 1.1 ± 1.4 | 0.8 ± 1.2 |
Self-rated Health
Unadjusted response frequencies for all four diagnostic groups (No Disease, Unknown Disease, Known Disease without Treatment, and Known Disease with Treatment) for each condition (glucose intolerance, hyperlipidemia, and hypertension) for the primary outcome are presented in Figure 1. For all three conditions, the proportion of respondents who reported “excellent” or “very good” health decreased across the four diagnostic groups from No Disease, to Unknown Disease, to Known Disease without Treatment, to Known Disease with Treatment. The proportion of those in “good” health was similar across the diagnostic groups. The proportion of those in “fair” or “poor” health increased from No Disease, to Unknown Disease, to Known Disease without Treatment, to Known Disease with Treatment groups.
Figure 1:
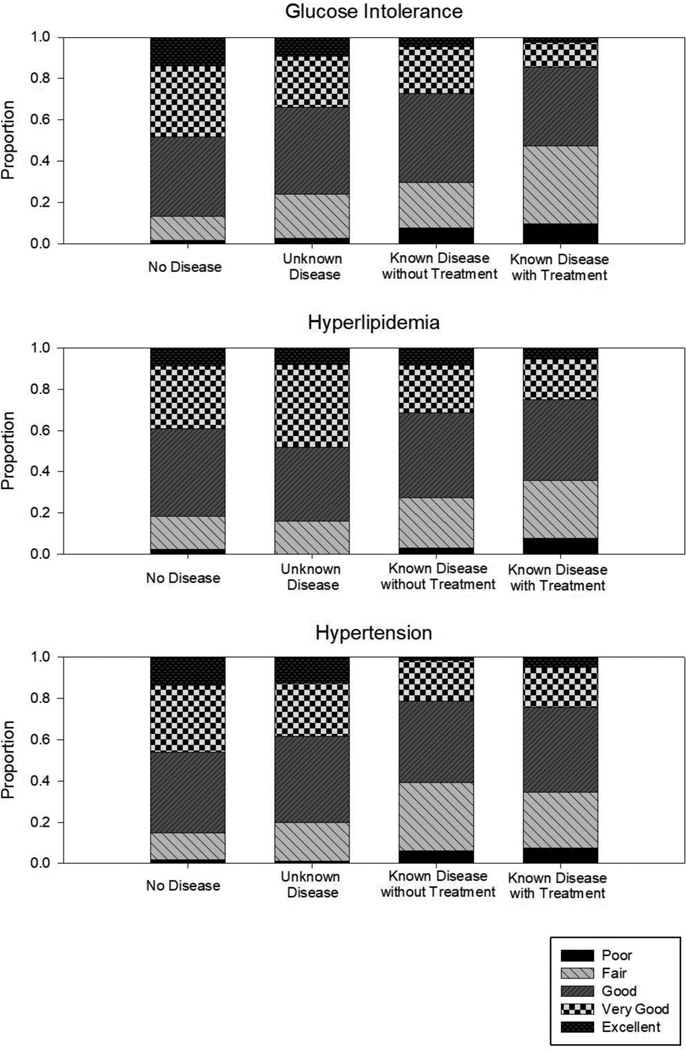
Unadjusted responses to the question, “Would you say your health in general is: excellent, very good, good, fair, or poor?” by disease and diagnostic group.
Adjusted odds ratios for reporting worse self-rated health in each health condition are presented in Table 2. Compared to the Unknown Disease reference group, there were no statistically significant differences in self-rated health by diagnostic category. There were several other factors that were statistically significant predictors of self-rated health which are available in the Appendix. The odds of reporting worse self-rated health increased with female sex, lower income, and lower education, any race/ethnicity that was not non-Hispanic White, being a smoker, and increasing number of comorbidities.
Table 2.
Adjusted Odds Ratio Estimates for Responses to the Question, “Would You Say Your Health in General is: Excellent, Very Good, Good, Fair, or Poor?” By Disease And Diagnostic Group.
| Glucose Intolerance | Hyperlipidemia | Hypertension | |||||||
|---|---|---|---|---|---|---|---|---|---|
| Effect | Point Estimate | 95% Wald Confidence Limits | Point Estimate | 95% Wald Confidence Limits | Point Estimate | 95% Wald Confidence Limits | |||
| No disease | 0.894 | 0.772 | 1.035 | 1.013 | 0.468 | 2.194 | 0.897 | 0.701 | 1.147 |
| Unknown disease | Reference | ||||||||
| Known disease without treatment | 1.057 | 0.820 | 1.362 | 1.103 | 0.492 | 2.472 | 1.110 | 0.782 | 1.575 |
| Known disease with treatment | 1.065 | 0.862 | 1.316 | 1.053 | 0.480 | 2.310 | 1.119 | 0.868 | 1.442 |
Model adjusted for sex, age, income, body mass index, education, race/ethnicity, and number of comorbid conditions. Full model results are available in the Appendix.
Healthy Days
Unadjusted healthy days question responses for each condition and diagnostic group are reported in Table 3. In general, the Unknown Disease group reported the fewest number of poor health or inactive days. The Known Disease without Treatment and Known Disease with Treatment groups reported having poorer health and more inactive days than the No Disease and Unknown Disease groups.
Table 3.
Unadjusted Responses to the Healthy Days Questions by Disease And Diagnostic Group
| No Diasease | Unknown Disease | Known Disease without tretment | Known Disease with Treatment | |
|---|---|---|---|---|
| Mean ± SD | Mean ± SD | Mean ± SD | Mean ± SD | |
| Hypertension | ||||
| Number of days physical health was not good | 2.7 ± 6.4 | 2.9 ± 7.4 | 6.0 ± 9.9 | 5.9 ± 9.9 |
| Number of days mental health was not good | 3.8 ± 7.7 | 2.6 ± 6.4 | 5.3 ± 8.7 | 4.2 ± 8.2 |
| Number of inactive days due to physical or mental health | 1.4 ± 4.9 | 1.2 ± 4.9 | 3.5 ± 8.0 | 3.2 ± 7.9 |
| Hyperlipidemia | ||||
| Number of days physical health was not good | 3.0 ± 6.8 | 0.9 ± 2.3 | 4.6 ± 8.6 | 6.1 ± 10.1 |
| Number of days mental health was not good | 3.8 ± 7.6 | 3.5 ± 8.4 | 5.4 ± 9.5 | 4.1 ± 8.2 |
| Number of inactive days due to physical or mental health | ± 5.2 | 1.0 ± 2.9 | 2.4 ± 6.7 | 3.2 ± 7.9 |
| Glucose Intolerance | ||||
| Number of days physical health was not good | 2.4 ± 6.0 | 4.1 ± 8.3 | 5.7 ± 9.3 | 6.6 ± 10.5 |
| Number of days mental health was not good | 3.7 ± 7.4 | 3.6 ± 7.4 | 5.4 ± 9.3 | 4.7 ± 8.9 |
| Number of inactive days due to physical or mental health | 1.4 ± 4.6 | 1.7 ± 5.5 | 3.8 ± 8.4 | 3.7 ± 8.6 |
The estimates from the adjusted model for the healthy days questions are reported in Table 4 with full model results in the Appendix. Compared to the Unknown Disease reference group, those without disease did not have statistically significantly different numbers of healthy days except that those without glucose intolerance reported 0.79 less physically unhealthy days (p=0.010) than those with Unknown glucose intolerance. In contrast, four of the nine comparisons (three diseases with three healthy days questions each) of Known Disease without Treatment to the Unknown Disease reference had statistically significantly larger numbers of unhealthy days (range 1.4 to 2.5 more unhealthy days). Three of these are in hypertension and one is in glucose intolerance (inactive days). These statistically significant differences remained for the same questions and diseases except mental health days in hypertension when comparing Known Disease with Treatment to Unknown disease with a smaller magnitude (range 0.9 to 1.1 more unhealthy days).
Table 4.
Adjusted Multivariate Model Results for the Healthy Day Questions by Disease and Diagnostic Group.
| No Disease | Unknown Disease | Known Disease without Treatment | Known Disease with Treatment | |
|---|---|---|---|---|
| Estimate (P) | Estimate (P) | Estimate (P) | ||
| Hypertension | ||||
| Number of days physical health was not good | 0.562 (0.29) | ref | 2.453 (0.001) | 1.102 (0.041) |
| Number of days mental health was not good | 0.676 (0.20) | ref | 1.905 (0.010) | 0.702 (0.19) |
| Number of inactive days due to physical or mental health | 0.571 (0.16) | ref | 1.816 (0.001) | 1.0432 (0.012) |
| Hyperlipidemia | ||||
| Number of days physical health was not good | 1.595 (0.34) | ref | 2.445 (0.1653) | 2.760 (0.11) |
| Number of days mental health was not good | −0.391 (0.81) | ref | 1.235 (0.4776) | −0.085 (0.96) |
| Number of inactive days due to physical or mental health | 0.332 (0.80) | ref | 0.705 (0.6010) | 0.727 (0.58) |
| Glucose Intolerance | ||||
| Number of days physical health was not good | −0.789 (0.010) | ref | 0.329 (0.53) | 0.443 (0.31) |
| Number of days mental health was not good | 0.069 (0.83) | ref | 0.989 (0.07) | 0.666 (0.14) |
| Number of inactive days due to physical or mental health | 0.267 (0.25) | ref | 1.424 (0.0003) | 0.852 (0.010) |
Model adjusted for sex, age, income, body mass index, education, race/ethnicity, and number of comorbid conditions. Full model results are available in the Appendix.
In addition to diagnostic group, more days in poor health and more inactive days were generally associated with female sex, younger age, lower income, increasing numbers of comorbid conditions, and being a smoker.
Discussion
We analyzed a nationally representative sample of the United States adult population and found that diagnosis of glucose intolerance or hypertension, even without potential treatment side effects, negatively associated with healthy days when compared to individuals who have these diseases but do not know about them. The diagnosis of these diseases was associated with more days that physical and mental health was not good (hypertension) and more days of inactivity due to poor physical or mental health (hypertension and glucose intolerance). These findings support the idea that the diagnosis of asymptomatic disease affects general health perceptions and HRQoL. While the direction of the effects were the same in the hyperlipidemia cohort, their differences were not statistically significant. This may be due to the smaller sample size of the undiagnosed hyperlipidemia group compared to the other two diagnostic groups.
We selected diseases believed to be asymptomatic in the early stages to test our hypothesis that the undiagnosed group would have the same HRQoL as those without the health condition, and that the diagnosis itself would negatively impact HRQoL. Consistent with our assumptions, most models did not show any difference between the No Disease and the Unknown Disease groups. The exception was for glucose intolerance, in which those who were in the No Disease group had fewer days when physical health was not good (−0.79; P = 0.010) when compared to those without the condition. This may be because those with glucose intolerance may have some symptoms (e.g., polydipsia, fatigue), or that we did not have access to covariates to adequately adjust for diabetes risk factors, which are also associated with lower HRQoL (e.g., physical activity).
Taken together, these findings suggest that there is an effect of diagnosing an asymptomatic disease which influences an individual’s general health perceptions and reported HRQoL. This effect of labelling a disease in an individual could have several mechanisms which include changes in an individual’s identity (e.g., illness identity) and the way an individual interprets symptoms. While the majority of research on illness representations and identity of illness focuses on how individuals evaluate their HRQoL and how they label particular symptoms (Hagger & Orbell, 2003; Leventhal, Leventhal, & Contrada, 1998), the current findings encourage further research to explore how an individual’s illness identity and symptom experience are impacted by receiving a diagnosis. Investigating a causal pathway and potential mediators (e.g., general health perceptions, cognitive or affective experiences of symptoms) after receiving an asymptomatic diagnosis could reveal a potential mediator connecting diagnoses to overall HRQoL.
Further characterization of the pathways from diagnosis to change in HRQoL may provide insights which could be used to support patients diagnosed with these diseases. There are many possible mediators of this pathway, such as emotive and cognitive mediators (e.g., anger, fear, worry, anxiety); attentional focus to symptomology, which is confirmed by symptom-seeking biases; or identifying as a member of an ill or stigmatized community. The unforeseen consequences of changing general health perceptions could include changes in medication adherence, interactions with medical community, reductions in self-efficacy for health promoting behaviors (e.g., I can’t exercise because I am hypertensive), or increased engagement in negative coping patterns (e.g., stress eating, substance use). Characterizing and intervening on these pathways would allow patients to maximize their current HRQoL and may improve a variety of long-term outcomes.
Several limitations of this study merit comment. First, the data are cross-sectional, and there are a variety of potential confounders which were not available in the dataset (e.g., treatment side effects). Second, the diseases explored in this study do have long-term sequela, which may be present in the Unknown Disease groups. If present, this would dampen the difference of the effect of diagnosis between the Unknown Disease and Known Disease (with or without treatment) groups and bias toward not finding a difference. Lastly, the Unknown Disease group may not be diagnosed because they do not receive regular health care, which itself may be an indicator of personal, social, or structural mediators of HRQoL and health.
Screening and diagnosing asymptomatic disease has myriad benefits including avoiding and delaying sequela, such as stroke, vision loss, heart attack, kidney failure, and neuropathy. While we have found evidence that HRQoL is diminished by the diagnosis and subsequent treatment of asymptomatic diseases, we are not advocating to change screening guidelines as there is substantial benefit to early detection and treatment (Sullivan, Lawrence, & Ghushchyan, 2005). While self-rated health is related to mortality (DeSalvo, Bloser, Reynolds, He, & Muntner, 2006), this relationship is not known to be causal, and it would be inappropriate to assume that diagnosis of asymptomatic disease increases mortality.
Our study’s findings are strengthened by exploring multiple health conditions, separating the effects of diagnosis from the effects of treatment, and controlling for a wide variety of factors influencing HRQoL. This research is the first to examine whether the diagnosis of three different asymptomatic diseases is associated with decrement in HRQoL in a nationally representative sample from the United States. Our findings suggest that diagnosing an asymptomatic condition negatively impacts an individual’s HRQoL. Clinicians should be cognizant of the potential for decreases in HRQoL in those diagnosed with a health condition, even when no treatment is required. Future work should elicit the mediators of this relationship to guide interventions for patients and clinicians.
Supplementary Material
Acknowledgements
We gratefully acknowledge the individuals who participated in, and conducted, the National Health and Examination Survey; without their contributions, this work would not be possible.
Funding:
Dr. Hanmer was supported by the National Institutes of Health through Grant Number KL2 TR000146. Dr. Kavalieratos is supported by K12HS022989 from AHRQ and a Junior Faculty Career Development Award from the National Palliative Care Research Center. Dr. Peterson was supported by T32 HL007560 from NHLBI. The funders had no role in study design, data collection and analysis, decision to publish, or preparation of the manuscript.
References
- American Diabetes Association. (2010). Standards of medical care in diabetes—2010. Diabetes care, 33(Supplement 1), S11–S61. 10.2337/dc10-S011 [DOI] [PMC free article] [PubMed] [Google Scholar]
- Armitage J (2007). The safety of statins in clinical practice. The Lancet,370(9601), 1781–1790. 10.1016/S0140-6736(07)60716-8 [DOI] [PubMed] [Google Scholar]
- Auman C, Bosworth HB, & Hess TM (2005). Effect of health-related stereotypes on physiological responses of hypertensive middle-aged and older men. The Journals of Gerontology Series B: Psychological Sciences and Social Sciences, 60(1), P3–P10. [DOI] [PubMed] [Google Scholar]
- Bailey CJ, & Turner RC (1996). Metformin. The New England Journal of Medicine, 334(9), 574 10.1056/NEJM199602293340906 [DOI] [PubMed] [Google Scholar]
- Barger SD, & Muldoon MF (2006). Hypertension labelling was associated with poorer self-rated health in the Third US National Health and Nutrition Examination Survey. Journal of Human Hypertension, 20(2), 117–123. https://dx.doi.org/10.1007%2Fs00467-015-3262-8 [DOI] [PubMed] [Google Scholar]
- Baumann LJ, Cameron LD, Zimmerman RS, & Leventhal H (1989). Illness representations and matching labels with symptoms. Health Psychology,8(4), 449 http://psycnet.apa.org/doi/10.1037/0278-6133.8.4.449 [DOI] [PubMed] [Google Scholar]
- Bowen ME, Xuan L, Halm E (2014) The hunt for diabetes: Characteristics and risk factors associated with undiagnosed diabetes and prediabetes in NHANES. Journal of General Internal Medicine 29(S1) 226–226. https://dx.doi.org/10.1007%2Fs11606-014-2834-9 [Google Scholar]
- Centers for Disease Control and Prevention (CDC). National Center for Health Statistics (NCHS). National Health and Nutrition Examination Survey Data Hyattsville, MD: U.S. Department of Health and Human Services, Centers for Disease Control and Prevention, 2010–2011, http://www.cdc.gov/nchs/nhanes/nhanes_questionnaires.htm. Accessed June 18, 2015. [Google Scholar]
- Centers for Disease Control and Prevention. Diabetes Latest. June 17, 2014 http://www.cdc.gov/features/diabetesfactsheet/ Accessed June 18, 2015.
- Centers for Disease Control and Prevention. Cholesterol Facts. March 17, 2015. http://www.cdc.gov/cholesterol/facts.htm Accessed June 18, 2015.
- Centers for Disease Control and Prevention. High Blood Pressure Facts. February 19, 2015. http://www.cdc.gov/bloodpressure/facts.htm Accessed June 18, 2015.
- Chobanian AV, Bakris GL, Black HR, Cushman WC, Green LA, Izzo JL Jr,… & National High Blood Pressure Education Program Coordinating Committee. (2003). The seventh report of the joint national committee on prevention, detection, evaluation, and treatment of high blood pressure: the JNC 7 report. Jama, 289(19), 2560–2571. 10.1001/jama.289.19.2560 [DOI] [PubMed] [Google Scholar]
- DeSalvo KB, Bloser N, Reynolds K, He J, & Muntner P (2006). Mortality prediction with a single general self‐rated health question. Journal of General Internal Medicine, 21(3), 267–275. https://dx.doi.org/10.1111%2Fj.1525-1497.2005.00291.x [DOI] [PMC free article] [PubMed] [Google Scholar]
- DeSalvo KB, Jones TM, Peabody J, McDonald J, Fihn S, Fan V,… & Muntner P (2009). Health care expenditure prediction with a single item, self-rated health measure. Medical Care, 47(4), 440–447. 10.1097/MLR.0b013e318190b716 [DOI] [PubMed] [Google Scholar]
- Earnshaw VA, Quinn DM, & Park CL (2012). Anticipated stigma and quality of life among people living with chronic illnesses. Chronic Illness, 8(2), 79–88. [DOI] [PMC free article] [PubMed] [Google Scholar]
- Edelman D, Olsen MK, Dudley TK, Harris AC, & Oddone EZ (2002). Impact of diabetes screening on quality of life. Diabetes Care, 25(6), 1022–1026. 10.2337/diacare.25.6.1022 [DOI] [PubMed] [Google Scholar]
- Erickson SR, Williams BC, & Gruppen LD (2001). Perceived symptoms and health-related quality of life reported by uncomplicated hypertensive patients compared to normal controls. Journal of Human Hypertension, 15(8), 539–548. 10.1038/sj.jhh.1001236. [DOI] [PubMed] [Google Scholar]
- Hagger MS, & Orbell S (2003). A meta-analytic review of the common-sense model of illness representations. Psychology and Health, 18(2), 141–184. 10.1080/088704403100081321 [DOI] [Google Scholar]
- Harris RP, Helfand M, Woolf SH, Lohr KN, Mulrow CD, Teutsch SM,… & Force ST (2001). Current methods of the US Preventive Services Task Force: a review of the process. American Journal of Preventive Medicine,20(3), 21–35. 10.1016/S0749-3797(01)00261-6 [DOI] [PubMed] [Google Scholar]
- Hayes DK, Denny CH, Keenan NL, Croft JB, & Greenlund KJ (2008). Health-related quality of life and hypertension status, awareness, treatment, and control: National Health and Nutrition Examination Survey, 2001–2004. Journal of Hypertension, 26(4), 641–647. 10.1097/HJH.0b013e3282f3eb50 [DOI] [PubMed] [Google Scholar]
- Jørgensen P, Langhammer A, Krokstad S, & Forsmo S (2014). Is there an association between disease ignorance and self-rated health? The HUNT Study, a cross-sectional survey. BMJ open, 4(5), e004962 10.1136/bmjopen-2014-004962 [DOI] [PMC free article] [PubMed] [Google Scholar]
- Kaplan NM (1992). The appropriate goals of antihypertensive therapy: Neither too much nor too little. Annals of Internal Medicine, 116(8), 686–690. http://doi: 10.7326/0003-4819-116-8-686 [DOI] [PubMed] [Google Scholar]
- Lawrence WF, Fryback DG, Martin PA, Klein R, & Klein BE (1996). Health status and hypertension: A population-based study. Journal of Clinical Epidemiology, 49(11), 1239–1245. 10.1016/S0895-4356(96)00220-X [DOI] [PubMed] [Google Scholar]
- Leventhal H, Leventhal EA, & Contrada RJ (1998). Self-regulation, health, and behavior: A perceptual-cognitive approach. Psychology and Health, 13(4), 717–733. 10.1080/08870449808407425 [DOI] [Google Scholar]
- Martinez AG, & Hinshaw SP (2016). Mental health stigma: Theory, developmental issues, and research priorities In Cicchetti D (Ed.), Developmental psychopathology (pp. 997–1039). Hoboken, NJ: John Wiley & Sons, Inc. doi: 10.1002/9781119125556 [DOI] [Google Scholar]
- Petersen S, van den Berg RA, Janssens T, & Van den Bergh O (2011). Illness and symptom perception: A theoretical approach towards an integrative measurement model. Clinical Psychology Review, 31(3), 428–439. 10.1016/j.cpr.2010.11.002 [DOI] [PubMed] [Google Scholar]
- Quinn DM, & Earnshaw VA (2011). Understanding concealable stigmatized identities: The role of identity in psychological, physical, and behavioral outcomes. Social Issues and Policy Review, 5(1), 160–190. [Google Scholar]
- Report of the National Cholesterol Education Program (NCEP)(3: 2001). (2001). Detection, evaluation, and treatment of high blood cholesterol in adults (Adult Treatment Panel III).
- Sullivan PW, Lawrence WF, & Ghushchyan V (2005). A national catalog of preference-based scores for chronic conditions in the United States. Medical Care, 43(7), 736–749. https://doi:10.1001/jama.285.19.2486 [DOI] [PubMed] [Google Scholar]
- Wilson IB, & Cleary PD (1995). Linking clinical variables with health-related quality of life: a conceptual model of patient outcomes. Jama, 273(1), 59–65. https://doi:10.1001/jama.1995.03520250075037 [PubMed] [Google Scholar]
Associated Data
This section collects any data citations, data availability statements, or supplementary materials included in this article.