

Summary
Chemotherapy results in a frequent yet poorly understood syndrome of long-term neurological deficits. Neural precursor cell and white matter dysfunction are thought to contribute to this debilitating syndrome. Here, we demonstrate persistent depletion of oligodendrocyte lineage cells in humans who received chemotherapy. Developing a mouse model of methotrexate chemotherapy-induced neurological dysfunction, we find a similar depletion of white matter OPCs, increased but incomplete OPC differentiation and a persistent deficit in myelination. OPCs from chemotherapy-naïve mice similarly exhibit increased differentiation when transplanted into the microenvironment of previously methotrexate-exposed brains, indicating an underlying microenvironmental perturbation. Methotrexate results in persistent activation of microglia and subsequent astrocyte activation that is dependent upon inflammatory microglia. Microglial depletion normalizes oligodendroglial lineage dynamics, myelin microstructure and cognitive behavior after methotrexate chemotherapy. These findings indicate that methotrexate chemotherapy exposure is associated with persistent tri-glial dysregulation and identify inflammatory microglia as a therapeutic target to abrogate chemotherapy-induced neurological dysfunction.
Keywords: chemotherapy, chemobrain, chemotherapy-related cognitive impairment, OPC, oligodendrocyte, myelin, astrocyte, microglia
eTOC blurb (In Brief):
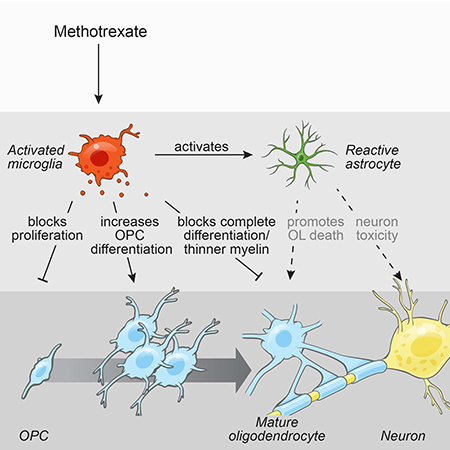
Microglial activation by methotrexate leads to a persistent disruption of oligodendrocyte lineage dynamics and astrocyte reactivity, resulting in the long-term cognitive impairment associated with chemotherapy.
Graphical Abstract
Introduction
Chemotherapy causes a syndrome of neurological dysfunction characterized by impaired attention, speed of information processing, multitasking, fine motor and executive function (Bisen-Hersh et al., 2013; Gibson and Monje, 2012; Green et al., 2013). The consequences of this syndrome, also called chemotherapy-related cognitive impairment (CRCI) or colloquially known as “chemobrain”, can be debilitating (Ellenberg et al., 2009). This post-chemotherapy neurological syndrome is well described across numerous populations treated for various adult and pediatric cancers and is particularly prominent when chemotherapeutic regimens include anti-metabolite agents such as methotrexate (MTX) (Aukema et al., 2009; Gibson and Monje, 2012; Pierson et al., 2016). While the incidence, severity and duration of CRCI varies between patient populations and chemotherapeutic regimens, it affects the majority of people treated for cancer, with some studies reporting long-term cognitive dysfunction in over three quarters of patients (reviewed in (Wefel and Schagen, 2012)). Currently 15.5 million cancer survivors live in the U.S. alone, with this number projected to increase to 20.3 million by 2026 (American Cancer Society, 2016). CRCI thus represents a major source of morbidity during and after cancer therapy and a great unmet need to be addressed (Horowitz et al., 2018).
The lasting neurological impact of cancer therapy on survivors, especially of childhood cancer, is not surprising in light of the protracted period of human postnatal neurodevelopment and ongoing cellular neuroplasticity. Myelination, the generation of oligodendrocytes by proliferating oligodendrocyte precursor cells (OPCs) and the formation of the insulating myelin sheath by oligodendrocytes, extends over more than three decades of life (Benes, 1989; Lebel et al., 2012; Yakovlev, 1967) and continues well into adulthood as a form of neuroplasticity (Gibson et al., 2014; McKenzie et al., 2014; Mitew et al., 2018). The constellation of symptoms associated with chemotherapy exposure localize largely to white matter, composed chiefly of myelinated axons. Agents that can, in severe cases, cause clinically-evident white matter injury such as MTX are particularly associated with long-term neurological deficits (Anderson et al., 2000; Han et al., 2008; Moore et al., 1992; Morioka et al., 2013; Pierson et al., 2016; Winocur et al., 2006).
The mechanisms mediating CRCI have been incompletely understood. Proliferative neural precursor cell populations are sensitive to chemotherapeutic agents (Dietrich et al., 2006; Hyrien et al., 2010; Morris et al., 1995). One robustly cycling population, OPCs (Dawson et al., 2003; Geha et al., 2010), is particularly sensitive to chemotherapeutic agents (Dietrich et al., 2006; Han et al., 2008). However, OPCs rapidly reconstitute to maintain strictly regulated homeostatic population levels in the healthy brain (Hughes et al., 2013). The long-term effects of chemotherapy on oligodendroglial lineage cell dynamics and myelination remain poorly understood. We hypothesized that long-term OPC population dysregulation or depletion could underlie chemotherapy-associated white matter dysfunction and the associated neurological sequelae of chemotherapy exposure.
Results
Altered oligodendrocyte lineage cell dynamics in children and young adults exposed to chemotherapy
To determine if chemotherapy treatment alters human oligodendrocyte lineage cell populations, we examined post-mortem frontal lobe tissue of children and young adults treated with multi-agent chemotherapy in comparison to age-matched control subjects with no history of chemotherapy (Figure 1A; Table S1). We found that human oligodendrocyte lineage cells, identified by Olig2 expression, are depleted in subjects with a history of chemotherapy exposure (control: 14893±2063 cells/mm3 vs. chemo: 4150±876 cells/mm3). This decrease in Olig2+ cell density is largely accounted for by deficits in subcortical white matter Olig2+ cells (Figure 1B). In contrast, grey matter Olig2+ cells are relatively preserved (Figure 1B). In the frontal subcortical white matter of subjects with chemotherapy exposure, Olig2+ oligodendroglial lineage cell density is markedly lower compared to age-matched control subjects with no chemotherapy exposure (Figure 1B-C). The aforementioned human samples represent archival human brain formalin-fixed, paraffin-embedded specimens amenable to light microscopy. To assess the effects of chemotherapy on oligodendroglial lineage cells using higher-resolution confocal microscopy, we prospectively collected a frontal lobe sample at the time of autopsy from a 3-year-old child treated with a high-dose methotrexate (MTX) chemotherapy regimen (as per protocol SJYC07 (Robinson et al., 2018) with a peak serum MTX measured at 82 μM). When compared to that of a 10-year-old child who received no chemotherapy, the frontal subcortical white matter of the child treated with high-dose MTX exhibited stark depletion of PDGFRα+/NG2+ OPCs (Figure 1D).
Figure 1:

Frontal lobe white matter depletion of oligodendrocyte lineage cells following early life chemotherapy
A) Photomicrographs of Olig2+ (brown) cells in frontal cortex white matter of a child exposed to chemotherapy at 3 years old and non-chemotherapy exposed aged-matched control
B) Chemotherapy exposure selectively depletes Olig2+ cells in frontal lobe white matter (p=0.0211; n=4) but not grey matter (p=0.0913; n=4)
C) Olig2+ cells throughout early life and young adulthood following chemotherapy treatment compared to age-matched controls
D) Confocal photomicrographs of PDGFRα+/NG2+ cells in the frontal lobe subcortical white matter of a 10 year old male who received no chemotherapy (left) and a 3 year old male treated with high-dose methotrexate (MTX) chemotherapy in the same anatomical region (right)
Data shown as mean±SEM, n.s. = p>0.05, * p<0.05 by paired t-test; n=4/group. Scale bars=20 μm. See also Table S1
Methotrexate exposure disrupts oligodendroglial lineage cell dynamics
To further elucidate the effect of chemotherapy exposure on myelin-forming cells, we developed a mouse model of juvenile high-dose MTX exposure to mimic the histological and functional deficits observed in children after chemotherapy (Figure 2A; Aukema et al., 2009; Gibson and Monje, 2012). MTX was administered intraperitoneally (i.p.) at 100 mg/kg weekly for three consecutive weeks to mice (starting at P21; Figure 2A). To validate that 100 mg/kg MTX recapitulates the concentrations observed in clinical regimens (Bratlid and Moe, 1978), we used liquid chromatography-tandem mass spectrometry (LC-MS/MS) to assess the concentration of MTX in serum, brain, kidney and liver 30-min following a single 100 mg/kg injection. We found serum concentrations of MTX in our mouse model (118±13 μM) within the range of those measured in children following high-dose MTX administration (80–400 μM; Figure S1A). MTX can directly affect cell viability, so we assessed the IC50 of MTX for a variety of cell types. The MTX IC50 of mouse PDGFRα+ OPCs (Figure S1B-C; 0.14 μM at 24-hrs) and mouse neural precursor cells (Figure S1F) is within the concentration range achieved in the brain (Figure S1A; 0.68 μM) using our dosage paradigm. By comparison, the MTX IC50 of pediatric brain tumor cultures that do not respond to MTX treatment (Figure S1D-E) are unaffected by clinically relevant MTX concentrations. Given the demonstrated concentration of MTX achieved in brain and the OPC IC50, the number of surviving OPCs would be expected to rapidly repopulate the brain to normal numbers in the absence of other pathophysiology (Hughes et al., 2013).
Figure 2:

MTX chemotherapy exposure disrupts oligodendrocyte lineage cell dynamics
A) Schematic illustration of juvenile MTX exposure paradigm and area of the premotor (M2) circuit analyzed (shaded in grey)
B) Total cell density of newly proliferated EdU+/PDGFRα+ cells at P63 in the corpus callosum of mice exposed to PBS or MTX on P21, 28, and 35 and injected with 40 mg/kg of EdU on P61, 62, and 63 (p=0.0465; n=4 mice/group)
C) Schematic illustration of oligodendrocyte lineage cells. OPCs express PDGFRα and begin to express the transcription factor Olig1 in a nuclear and then perinuclear pattern as they progress through differentiation. As differentiation completes, mature, myelinating oligodendrocytes express the marker CC1.
D-F) Effect of MTX exposure on OPCs (D; PDGFRα+ cells p<0.0001), PDGFRα+/Olig1+ late OPCs (E; p=0.0003) and CC1+ mature oligodendrocytes (F; p<0.0001) in the corpus callosum at P63 (n=8 mice PBS and n=7 mice MTX)
G-I) Photomicrographs of PDGFRα+ OPC (G), late PDGFRα+/Olig1+ cells (H) and CC1+ mature oligodendrocyte (I)
J-L) Mice (n=6 PBS; n=7 MTX) exposed to juvenile chemotherapy were allowed to age 6 months (P203) post-treatment. MTX-exposed mice exhibit a decrease in white matter OPC cell density (J; p=0.002) and CC1+ oligodendrocytes (L; p=0.008) with an increase in late OPCs (K; p=0.003).
Data shown as mean±SEM, * p<0.05, ** p<0.01, *** p<0.001 by unpaired two-tailed Student’s t-test; Scale bar=10 μm. See also Figure S1 and S2
To ascertain if chemotherapy treatment affected OPC proliferation in vivo, we treated mice with MTX or PBS starting at P21 (Figure 2A) and then administered the thymidine analogue EdU daily from P61–63 to mark newly proliferating cell populations one month after the termination of treatment. The number of newly proliferated EdU+/PDGFRα+ OPCs was decreased in the corpus callosum of MTX-exposed mice compared to PBS controls (Figure 2B), although the percentage of OPCs proliferating at this time did not differ (PBS: 12.1±1.4% vs. MTX: 11.34±2.95%; p=0.85). Similar to the decreased oligodendroglial cell density found in the human frontal lobe, mice exhibit deficits in the total density of frontal OPCs (PDGFRα+/Olig1− cells). This decrease is predominately driven by deficits in white matter (corpus callosum; 8618±469 cells/mm3 vs. 3181±259 cells/mm3 in control or MTX-treated mice, respectively; Figures 2C-D,G and S2A) and deep cortical grey matter OPCs (Figure S2B) with preservation of superficial cortical grey matter OPCs in the premotor cortex (Figure S2C). Concomitant with the observed decrease in white matter OPCs, MTX-exposed mice exhibited an increase in PDGFRα+/Olig1+ cells of intermediate differentiation that we will henceforth call “late OPCs” (Figure 2C,E,H). Here we have used Olig1 expression to distinguish earlier OPCs from more differentiated OPCs that co-express Olig1 in a nuclear pattern; if all PDGFRα+ cells irrespective of differentiation state are considered together, a substantial reduction in total OPC density remains evident (PBS: 10986±619 cells/mm3 vs. MTX: 7798±338 cells/mm3, p<0.0008). The observed increased OPC differentiation appears incomplete as the density of CC1+ and perinuclear Olig1+ mature oligodendrocytes in the corpus callosum is significantly decreased following MTX chemotherapy treatment (Figures 2C,F,I and S2D). While we observed a significant increase in apoptotic cells, as identified by cleaved caspase-3 24-hrs following a single MTX injections, levels of apoptosis were drastically reduced 4 weeks following MTX and none of the identified apoptotic cells co-expressed PDGFRα (Figure S2E-F). Thus, in contrast to the expected homeostatic behavior of healthy OPCs (Hughes et al., 2013), the white matter OPC population does not repopulate to normal levels following MTX chemotherapy exposure due in part to decreased OPC proliferation and increased OPCdifferentiation, but not attributable to ongoing OPC apoptosis.
Since many cancer patients report cognitive deficits following chemotherapy that can persist for years after the termination of treatment (Aukema et al., 2009; Pierson et al., 2016), we followed a cohort of mice that were treated with MTX or PBS vehicle for 6 months following the end of treatment (P203). Similar to the 4-week time point (P63), at P203 mice exposed to juvenile MTX exhibit decreases in PDGFRα+ OPCs (Figure 2J) and CC1+ mature oligodendrocytes (Figure 2L) with concomitant increases in PDGFRα+/Olig1+ late OPCs (Figure 2K) compared to controls. Thus, oligodendroglial lineage dynamics are consistently perturbed for at least 6 months following MTX chemotherapy.
Juvenile chemotherapy exposure disrupts myelination and behavioral function
Standard neuroimaging of patients who are experiencing chemotherapy-related neurological impairments typically exhibit no evidence of overt demyelination. Concordantly, we found that gross myelin appearance in the corpus callosum following MTX exposure remained intact as assessed by the presence and distribution of myelin basic protein (MBP; Figures 3A-B and S3A-B). Corpus callosum volume was unchanged between PBS and MTX-treated mice, indicating that the observed changes in OPC density were not a result of altered volume of the corpus callosum (Figure 3C). However, using transmission electron microscopy (TEM) to evaluate myelin microstructure, we observed a substantial decrease in myelin sheath thickness as indicated by an increased g-ratio of axons in the premotor circuit of MTX-exposed mice at four weeks following treatment compared to vehicle controls (g-ratio=diameter of axon/diameter of entire fiber; PBS; 0.746±0.0049; MTX: 0.801±0.00785; Figures 3D-G and S3C). Axons of all caliber exhibited decreased myelin thickness in mice at both four weeks (Figure 3G) and 6 months (Figures 3H-I and S3G) following MTX exposure. These data indicate that MTX chemotherapy is associated with lasting changes to myelin microstructure.
Figure 3:

Persistent myelin and neurological deficits following juvenile chemotherapy exposure
A-B) Confocal photomicrograph of myelin basic protein (MBP) in the frontal cortex of PBS (A) and MTX (B) exposed mice
C) Corpus callosum volume of P63 mice exposed to PBS or MTX (p=0.592; n=5 PBS; n=4 MTX)
D) Schematic illustration of the premotor cortex and the region assessed using transmission electron microscopy (TEM; red box).
E) Representative TEM images of cortical and subcortical premotor (M2) projections in PBS and MTX exposed mice (4000X; Scale bar=2 μm)
F) Scatter plots of g-ratio as a function of axon diameter of M2 projections in the corpus callosum at P63 (PBS: g-ratio 0.7464±0.0049, n=5 mice; MTX: g-ratio 0.801±0.00785, n=8 mice; p=0.0003)
G) The increase in g-ratio in MTX- compared to PBS-exposed mice at P63 occurs in small (<0.5 μm; p<0.0001), medium (0.5–1.0 μm; p=0.0097) and large (>1.0 μm; p=0.0220) caliber axons. n=5 mice PBS; n=8 mice MTX
H) Scatter plots of g-ratio as a function of axon diameter of M2 projections in the corpus callosum at P203 (PBS: g-ratio 0.7073±0.0037, n=4 mice; MTX: g-ratio 0.7697±0.0073, n=4 mice; p=0.0003)
I) The increase in g-ratio in MTX- compared to PBS-exposed mice at P203 occurs in small (<0.5 μm; p<0.0001), medium (0.5–1.0 μm; p<0.0001) and large (>1.0 μm; p=0.0188) caliber axons. n=4 mice PBS; n=4 mice MTX
J) P63 PBS and MTX mice spent equivalent amounts of time exploring Object 1 and Object 2 during the training phase of NORT (PBS: p=0.59, n=9; MTX: p=0.58, n=7).
K) During the testing phase of NORT, PBS-exposed mice spent significantly more time exploring the novel object compared to the familiar object (p=0.004) while MTX-exposed mice did not discriminate between the objects (p=0.18).
L-M) P203 PBS and MTX mice spent equivalent amounts of time exploring Object 1 and Object 2 during the training phase of NORT (L; PBS: p=0.45, n=4; MTX: p=0.69, n=7) but during the testing phase (M), PBS-exposed mice spent significantly more time exploring the novel compared to the familiar object (p=0.047) while the MTX-exposed mice did not discriminate between the objects (p=0.62).
Data shown as mean±SEM, * p<0.05, ** p<0.01, *** p<0.001, n.s. p>0.05 by unpaired two-tailed Student’s t-test. See also Figure S3
The dysregulation of OPC lineage dynamics and myelination in this mouse model are accompanied by behavioral deficits characteristic of chemotherapy sequelae, including decrements in motor function (Green et al., 2013). Forepaw swing speed, a measure of limb movement speed sensitive to alterations in the motor system broadly, is modulated by changes in myelin microstructure in the premotor circuit (Gibson et al., 2014). Forepaw swing speed was decreased in MTX-exposed mice four weeks following chemotherapy treatment (101.6±4.6 cm/s vs. 74.4±7.8 cm/s, Figure S3D). Other parameters of gait such as stride length were not altered (Figure S3E). Anxiety, a neuropsychiatric symptom associated with chemotherapy exposure (Bray et al., 2017), was also evident in this model. MTX-exposed mice spent less time in the middle of an open field than PBS vehicle-treated controls (Figure S3F). The hallmark neurological symptoms following chemotherapy treatment are cognitive deficits (Bisen-Hersh et al., 2013; Seigers et al., 2009; Winocur et al., 2006; Zhou et al., 2016), especially those associated with attention-based tasks (Pierson et al., 2016). To determine if cognitive behavior was compromised following juvenile chemotherapy treatment, we assessed attention and short-term memory using a modified novel object recognition task (NORT) four weeks after MTX treatment in which we shortened the time between the training and testing phases to skew the test towards attentional function. Both PBS- and MTX-exposed mice explored the objects an equivalent amount of time during the training phase (Figure 3J). During the testing phase, the control animals exhibited a preference towards the novel object while MTX-treated mice did not discern between the two objects (Figure 3K). At P203, mice exposed to juvenile MTX continued to exhibit deficits in the ability to discriminate between the novel and familiar objects at 6 months post-treatment, consistent with a persistent cognitive deficit following MTX exposure (Figure 3L-M). Collectively, these data demonstrate that this mouse model exhibits behavioral deficits similar to the symptoms humans experience after chemotherapy.
Perturbations of the gliogenic microenvironment persist long after exposure to methotrexate
We next tested the extent to which the changes in oligodendroglial lineage dynamics reflect microenvironmental alterations after MTX. Chemotherapy-naïve PDGFRα+ cells isolated by FACS from GFP+ transgenic mice were transplanted into the cingulum of the corpus callosum of P63 mice previously treated with MTX or PBS vehicle (Figure 4A-B). The sorted population of GFP+/PDGFRα+ cells obtained had a purity of 98%, with little contamination of other cell types, including Iba1+ microglia (Figure S4). Analysis of the transplanted GFP+ cells at 10 days following transplantation revealed that 84±6.4% remained PDGFRα+ OPCs in PBS-exposed mice, while only 45.5±7.7% remained OPCs in the brains of mice previously exposed to MTX (%GFP+/PDGFRα+: p=0.0117). An equivalent proportion of GFP+ cells represented late OPCs (%GFP+/PDGFRα+/Olig1nuclear) at this time point in both PBS- and MTX-exposed brains, with significantly more GFP+ cells differentiating into perinuclear Olig1+ oligodendrocytes in mice exposed to MTX (%GFP+/Olig1perinuclear; Figure 4C). These data reveal that MTX chemotherapy exerts sustained changes to the gliogenic microenvironment that foster OPC differentiation. While increased OPC differentiation of the transplanted cells at this time point can be attributed to microenvironmental changes induced by MTX, the transplanted OPCs did not exhibit a blockade in full oligodendrocyte maturation. One interpretation is that the deficit in full oligodendrocyte maturation exhibited by endogenous OPCs reflects changes induced by either exposure to the MTX-altered microenvironment from the time of initial drug treatment and/or previous direct MTX toxicity.
Figure 4:

Microenvironmental perturbation drives differentiation of oligodendrocyte precursor cells
A) Schematic illustration of juvenile chemotherapy paradigm and syngeneic transplantation of GFP+/PDGFRα+ cells
B) Confocal photomicrograph of transplanted GFP/PDGFRα cells in the corpus callosum 10 days-post transplantation (GFP=green; PDGFRα=red; Olig1=white; Scale bar=20 μm)
C) Syngeneic transplantation of GFP/PDGFRα cells into previously MTX- (n=3 mice) or PBS-exposed (n=4 mice) corpus callosi. Percent of cells GFP/PDGFRα (p=0.01167), GFP/PDGFRα/Olig1nuclear (p=0.259), and GFP/Olig1perinuclear oligodendrocytes (p=0.00295) in MTX- and PBS-exposed mice 10 days-post transplantation. Data shown as mean±SEM; unpaired two-tailed Student’s t-test. See also Figure S4
Chemotherapy-induced activation of white matter microglia
Previous work has shown that disruptions in the microenvironment, including neuroinflammatory microglia, can alter precursor cell populations (Briones and Woods, 2014; Monje et al., 2003; Seigers et al., 2009). To investigate this possibility following chemotherapy exposure, we analyzed microglial populations in our juvenile MTX exposure model. We found that activated CD68+/Iba1+ microglia are increased in the white matter (PBS: 3242±474 cells/mm3 vs. MTX: 6504±529 cells/mm3) but not the grey matter of the premotor circuit at P63 in MTX-treated mice compared to vehicle controls (Figure 5A-B,D). This chemotherapy-induced increase in white matter microglial activation persisted at least 6 months after MTX (Figure 5C). To confirm the activation state of microglia four weeks after the cessation of chemotherapy treatment, Iba1+ microglia were sorted by FACS from frontal deep cortex and corpus callosum of P63 mice that were previously exposed to PBS or MTX. MTX-exposed microglia expressed increased levels of activation gene transcripts, as determined by microfluidic qPCR (Figure 5E). We then isolated microglia from P5 animals and exposed them in vitro to 0.68 μM of MTX for 24 hours to determine if MTX directly regulated microglial activation. MTX-treated microglia exhibited increased activation compared to control-treated microglia (Figure 5F), indicating a direct mechanism of neuroinflammatory microglial activation by MTX.
Figure 5:

Chronic microglial activation is secondary to MTX exposure
A-C) Activation of microglia (CD68+/Iba1+) following early-life chemotherapy exposure in the superficial grey matter (A; p=0.2570) and corpus callosum (B; p=0.0018) of the premotor circuit at P63 (n=5 mice/group) and P203 (C; p=0.01; n=7 mice/group). Data shown as mean±SEM, * p<0.05, ** p<0.01, n.s. p>0.05 by unpaired two-tailed Student’s t-test
D) Confocal photomicrographs of CD68+/Iba1+ activated microglia in the corpus callosum at P63 (Iba1=red, CD68=green, DAPI=white). Scale bar=50 μm
E) Iba+ microglia were sorted using FACS at P63 from frontal lobe deep cortex and corpus callosum of previously PBS- or MTX-exposed mice (n=2–6 mice/condition/sort). Heat map of activated transcripts indicate a significant increase in activation following MTX exposure (p<0.0001).
F) Immunopanned microglia exposed to 0.68 μM of MTX for 24 hours in vitro indicate significant activation compared to vehicle control (p<0.0001).
E-F) All experiments analyzed by two-way ANOVA with Tukey post-hoc tests and performed with n=3 biological replicates
Activated microglia induce reactivity in astrocytes following methotrexate exposure
Recent work has shown that activated microglia can induce reactivity in astrocytes and may be associated with long-term deficits in some neurological diseases (Liddelow et al., 2017). To determine if the persistent MTX-induced microglial activation resulted in astrocyte reactivity, we first exposed astrocytes in vitro to physiologically relevant concentrations of MTX for 24 hours (Figure S1A). MTX, even at high concentrations (1.36 μM), did not directly induce reactivity of astrocytes in vitro (Figure 6A). However, when we induced reactivity in microglia in vitro through MTX exposure and placed the conditioned medium from these MTX-induced activated microglia (MTX-MCM) on astrocytes for 24 hours, we initiated broad reactivity of astrocytes compared to PBS vehicle-treated medium. This astrocyte reactive phenotype was not constrained to a single subtype of reactive response (A1, A2 and pan-reactive; Zamanian et al., 2012) (Figure 6A). We next investigated the reactive state of astrocytes from our mouse model. ALDH1L1::eGFP astrocyte reporter mice (Yang et al., 2011) were treated with MTX or PBS as above. At P63 we sorted astrocytes from frontal deep cortex and corpus callosum by FACS. Astrocytes exposed to MTX in vivo exhibited increased reactivity as indicated by an upregulation of pan and A2 but not A1 genes (Figure 6B).
Figure 6:

Chemotherapy-exposed activated microglia induce astrocyte reactivity
A-B) Heat maps depicting mRNA expression levels of actrocyte reactivity gene transcripts
A) Immunopanned astrocytes exposed to physiologically high (1.36 μM) concentrations of MTX directly do not become reactive, but when exposed to conditioned medium from MTX-induced activated microglia in vitro (0.68 μM MTX-MCM) astrocytes become broadly reactive compared to PBS controls (pan p=0.0004, A1 p=0.0193, A2 p=0.0144).
B) Astrocytes were sorted using FACS from ALDH1L1::eGFP mice at P63 that were previously exposed to juvenile PBS or MTX. MTX exposure results in broad astrocyte reactivity compared to PBS exposure (n=4–5 mice/condition/sort; pan p=0.0011, A1 p=0.075, A2 p=0.0097).
All experiments analyzed by two-way ANOVA with Tukey post-hoc tests and performed with n=3 biological replicates.
Microglial depletion reverses the deleterious effects of chemotherapy-induced glial dysregulation
We next aimed to determine if activated microglia are necessary for MTX chemotherapy-induced alterations to oligodendrocyte lineage cell dynamics and function. Mice underwent the same juvenile chemotherapy treatment paradigm described above, and at P38 half of the MTX- and PBS-exposed mice received chow containing PLX5622, a small molecule compound that inhibits microglial colony-stimulating factor 1 receptor (CSF1R), required for microglial survival. The other half received control chow (Figure 7A). PLX5622 administration has been shown to significantly deplete microglia within 7 days (Dagher et al., 2015; Elmore et al., 2014). As expected, the MTX-exposed mice exhibited an increase in Iba1+ microglia compared to PBS-treated controls (Figure 7C) when fed control chow. Both MTX- and PBS-exposed cohorts that received PLX5622 chow for the 26 days following treatment exhibited a 70–80% reduction in Iba1+ microglia in the corpus callosum compared to animals fed control chow (Figure 7B-C).
Figure 7:

Microglial depletion rescues chemotherapy-induced deficits in oligodendroglial lineage cell and astrocytic dynamics, myelination, and cognitive behavior
A) Schematic of juvenile chemotherapy exposure paradigm plus microglial depletion with PLX5622
B) Confocal photomicrographs of Iba1+ microglia in the corpus callosum of PBS-exposed mice fed control or PLX5622 chow; Scale bar=50 μm
C) Iba1+ microglia are decreased by 70–80% in PBS and MTX mice following 26 days of PLX5622 (PBS-Control n=3 vs. MTX-Control n=4, p=0.0092; PBS-Control vs. PBSPLX5622 n=5 mice/group, p<0.0001; MTX-Control vs. MTX-PLX5622 n=5, p<0.0001) by two-way ANOVA with Tukey post-hoc analyses.
D) Microglial depletion normalizes the percentage of GLAST+ astrocytes with high CXCL10+ pan reactive puncta in MTX- compared to PBS-exposed mice (PBS-Control n=3 vs. MTX-Control n=3, p=0.0053; MTX-Control vs. MTX-PLX5622 n=6, p=0.0207; PBS-Control vs. PBS-PLX5622 n=3; p=0.28).
E) Microglial depletion increases OPC (p=0.0002) and mature oligodendrocyte (p=0.0106) while decreases late OPC cell density (p=0.0174) in MTX mice fed PLX5622 chow compared to MTX mice fed control chow. The CC1+ mature oligodendrocyte population is partially recovered to PBS levels (p=0.0128) by one-way ANOVA. PBS-Control n=3 mice; MTX-Control n=4 mice; PBS-PLX5622 and MTX-PLX5622 n=5 mice/group
F, H) Representative TEM images of cortical projections to corpus callosum at the level of the cingulum in PBS and MTX mice treated with PLX5622 or control chow; Scale bar=2 μm
G, I) Scatter plots of individual axons as a function of axon diameter for PBS and MTX mice fed control or PLX5622 chow. g-ratio: PBS-Control (n=3) 0.7151±0.014; MTX-Control (n=3) 0.7953±0.015, p=0.0014; PBS-PLX5622 (n=4) 0.7331±0.0035; MTXPLX5622 (n=3) 0.735±0.0023, p>0.05; MTX-Control vs. MTX-PLX5622 p=0.0089
J-K) NORT on PBS- or MTX-exposed mice at P63 following treatment with control or PLX5622 chow
J) During the training phase, mice spent equivalent time exploring Object 1 and Object 2 regardless of juvenile chemotherapy treatment or post-treatment microglial state; PBS-Control (n=5), p=0.057; MTX-Control (n=3), p=0.32; PBS-PLX5622 (n=3), p=0.10; MTX-PLX5622 (n=5), p=0.08
K) During the testing phase, PBS-Control (p=0.02), PBS-PLX5622 (p=0.027), and MTXPLX5622 (p=0.047) mice explored the novel object significantly more than the familiar object while MTX-Control mice (p=0.59) did not discriminate between the novel and familiar objects by unpaired two-tailed Student’s t-test.
Data shown as mean±SEM, * p<0.05, ** p<0.01, *** p<0.001, n.s. p>0.05. See also Figure S5
To determine if astrocyte reactivity due to MTX-induced microglial activation is normalized with microglial depletion, pan-astrocyte reactivity in PBS and MTX mice with and without PLX5622 exposure was assessed using RNAScope for the pan-reactive marker CXCL10 and the astrocytic marker GLAST. Following MTX exposure, we found a significant increase in the percentage of GLAST+ astrocytes with high numbers of CXCL10 puncta (>8 puncta/cell) in MTX- compared to PBS-exposed mice (27.2±6.5% vs. 1.49±0.24%; Figures 7D and S5A). The percentage of reactive astrocytes is substantially reduced when microglia are depleted following MTX exposure (9.17±2.7%; Figures 7D and S5A), indicating microglial depletion can reduce astrocyte reactivity following chemotherapy.
Similarly, treatment with PLX5622 normalized the MTX-induced decrease in PDGFRα+ OPC density (PBS-Control 10221±1446 cells/mm3 vs. MTX-PLX5622 11113±351 cells/mm3, p=0.9996) and increase in PDGFRα+/Olig1+ late OPCs (PBS-Control 2083±367 cells/mm3 vs. MTX-PLX5622 2930±746 cells/mm3, p=0.5437) to levels seen in PBS control animals (Figure 7E). Microglial depletion also partially restored CC1+ oligodendrocyte density compared to MTX-Control levels (Figure 7E). Taken together, these data reveal that MTX chemotherapy-induced microglial activation is necessary for persistent alterations to oligodendrocyte lineage cell populations following chemotherapy exposure.
To determine if inhibition of microglia can rescue chemotherapy-induced myelin deficits, PBS- or MTX-exposed animals were fed control or PLX5622 chow from P38–63 and sacrificed for analysis using TEM at P63. Microglial depletion following chemotherapy treatment normalized overall myelin sheath thickness in MTX-exposed/PLX5622-treated mice to control levels (Figure 7F-I). The normalization of myelin sheath thickness to PBS-Control levels occurred in small, medium, and large caliber axons (Figure S5B). The average axon diameter did not differ between groups (Figure S5C).
To evaluate possible functional consequences of increased myelin thickness in MTX-exposed mice following microglial depletion with PLX5622, we assessed cognitive behavior at P63 using the modified NORT described above (Figure 7J-K). As above, MTX-exposed mice fed control chow, allowing for persistent microglial activation, exhibited an inability to discriminate between the novel and familiar objects during the testing phase (Figure 7K). In contrast, microglial depletion with PLX5622 in MTX-exposed mice rescued this chemotherapy-induced behavioral deficit (Figure 7K). Taken together, these data indicate that microglial activation is necessary for the persistent dysregulation of oligodendrocyte lineage cells, myelin and astrocytes as well as the behavioral deficits observed following MTX chemotherapy exposure.
Discussion
Dysregulation of the OPC population in white matter diseases
While previous work has demonstrated broad neural precursor cell population sensitivity to chemotherapy exposure (Dietrich et al., 2006; Han et al., 2008; Hyrien et al., 2010; Morris et al., 1995), this lasting depletion of the OPC population after MTX chemotherapy was unexpected; OPCs typically maintain a precise homeostatic density and can rapidly repopulate after injury (Baxi et al., 2017; Hughes et al., 2013). The inability of the residual OPC population to replenish to normal levels suggests a long-term dysregulation of OPC homeostasis in the post-chemotherapy microenvironment. Typically, MTX is cleared from CSF by 72 hours after administration (Bratlid and Moe, 1978), however the possibility that very low levels remain in tissue long-term cannot be completely excluded. While the inability of the OPC population to recover following MTX chemotherapy was surprising, the differential response to chemotherapy between grey and white matter supports an emerging principle of glial heterogeneity in the healthy and diseased brain (Baxi et al., 2017; Vigano et al., 2013). The functional consequences of the observed accumulation of intermediate oligodendrocyte progenitors following MTX exposure is highlighted by the continued decrement in mature, myelinating oligodendrocytes at both one and 6 months after treatment. This blockade of full differentiation mirrors dysregulation of OPC differentiation in white matter lesions associated with multiple sclerosis (for review see (Miron et al., 2011)). OPCs transplanted to the brains of previously MTX-exposed mice exhibit a similar increase in OPC differentiation, but unlike resident OPCs these transplanted cells continue through the maturation process. Full maturation of the transplanted, chemotherapy-naïve OPCs suggests that the chemotherapy-induced blockade of full differentiation exhibited by endogenous cells may be due to cell-intrinsic changes following MTX treatment and/or more extensive exposure to the MTX-altered microenvironment from the time of the initial insult. The partial rescue of normal oligodendrocyte numbers and rescue of myelin microstructure following a period of microglial depletion underscores the importance of the microenvironmental perturbations after MTX. The mechanism(s) mediating the inability of OPCs to fully differentiate into mature oligodendrocytes in neuroinflammatory disease states such as CRCI and MS remain a pressing question in the field.
Oligodendrocyte dynamics in health and disease
Adult-born mature oligodendrocytes exhibit lasting stability throughout much of the lifespan of healthy animals (Hill et al., 2018; Hughes et al., 2018; Tripathi et al., 2017). This protracted survival of mature oligodendrocytes results in a dramatic cellular accumulation throughout adulthood that is thought to contribute to ongoing changes in myelin microstructure (Tripathi et al., 2017). The production of new oligodendrocytes is required for learning new motor skills during adulthood (McKenzie et al., 2014; Xiao et al., 2016), and plasticity of myelin may contribute more broadly to learning and cognition (for discussion see, (Mount and Monje, 2017)). The persistent chemotherapy-induced decrement in myelinating oligodendrocytes and associated behavioral deficits further underscores the importance of maintaining proper oligodendroglial dynamics to support healthy neurological functioning.
Neuroinflammatory microglia disrupt precursor cell populations
The persistent disruption of the gliogenic microenvironment following MTX exposure is concordant with a developing principle of cancer therapy-induced neural precursor cell dysfunction (Gibson and Monje, 2012). Cranial radiation decreases hippocampal neurogenesis (Monje et al., 2002; Monje et al., 2007; Parent et al., 1999) by inducing chronic microglial inflammation (Monje et al., 2003). MTX chemotherapy exposure has been previously shown to increase microglial inflammation in adult rats (Seigers et al., 2010), which we have demonstrated in this murine model to be largely restricted to the white matter. The regional heterogeneity observed in microglial responses to MTX chemotherapy are consistent with our understanding of regional heterogeneity in microglia throughout the brain (Hagemeyer et al., 2017) (Grabert et al., 2016). Long-term microglial inflammation following chemotherapy treatment may vary amongst agents, as microglial activation has been described following exposure to some chemotherapeutic agents such as MTX (Seigers et al., 2010) and carboplatin (Acharya et al., 2015), but not with others such as cisplatin and 5-FU (Han et al., 2008; Zhou et al., 2016). Thus, while the neurotoxic pathophysiology of many commonly used cancer therapies such as radiation and MTX include a central role for activated microglia, it is important to note that diverse cancer therapies will involve a range of pathophysiological mechanisms.
Microglial depletion strategies to address cancer therapy-associated cognitive impairment will need to be carefully studied in a tumor-specific fashion. Ideal timing of microglial depletion, whether during or following completion of cancer therapy, may vary with unique pathophysiology of specific tumor types. Microglia and macrophages are important components of the tumor microenvironment, and tumor-associated macrophages play complex roles in cancer pathophysiology and therapy, particularly in the context of immunotherapeutic strategies (Lin et al., 2018; Pyonteck et al., 2013; Quail et al., 2016).
Microglia influence neural cell populations in health and disease
Microglial interactions with neural cell populations are important to neurodevelopment and homeostasis in health (Bialas and Stevens, 2013; Schafer et al., 2012), and are key cellular mediators of neural dysfunction in disease (Liddelow et al., 2017). In prenatal and early postnatal development, loss of microglia disrupts neural precursor cell fate choice, with increases in neurons and astrocytes and decreases in oligodendroglial cell populations (Erblich et al., 2011). Microglia regulate early postnatal myelinogenesis and oligodendroglial cell density in a white matter-specific manner, and continue to influence OPC density maintenance in the healthy brain during adulthood (Hagemeyer et al., 2017; Janova et al., 2018). Our findings here that MTX chemotherapy-induced microglial inflammation is central to the disruption of glial cell homeostasis after chemotherapy exposure is consistent with an emerging role for microglia in a range of nervous system diseases associated with myelin dysfunction, including catatonia (Janova et al., 2018), Alzheimer’s disease (Dagher et al., 2015), and multiple sclerosis (Zrzavy et al., 2017). Supporting the data presented here, previous work has shown that the chemotherapy drug combination of cyclophosphomide, MTX, and 5-FU (CMF) induces elevated inflammatory cytokines in the brains of aged rats that correlate with behavioral and myelin deficits (Briones and Woods, 2014).
Recently, neuroinflammatory microglia were shown to induce astrocyte reactivity. This reactivity can subsequently cause neuronal and oligodendroglial cell death, as well as inhibit oligodendroglial differentiation (Liddelow et al., 2017). Consistently, we find that the ongoing neuroinflammatory microglial response following MTX chemotherapy exposure induces astrocytic reactivity secondary to chemotherapy-induced microglial activation. The persistent decrement in mature oligodendrocytes observed following chemotherapy exposure may therefore be a result of both incomplete OPC differentiation as well as reactive astrocyte-induced oligodendroglial death. Microglia may thus influence oligodendroglial lineage cell function directly (Hagemeyer et al., 2017; Miron et al., 2013) or indirectly through neurotoxic astrocyte activation (Liddelow et al., 2017), illustrating a complex balance between these glial populations.
In addition to the demonstrated changes in microglial-macroglial interactions, the interplay between neurons and glia following chemotherapy exposure remains to be fully determined. Chemotherapy exposure is associated with decreased dendritic spines and neuronal arborizations (Zhou et al., 2016), although the relationship to microglial pathology has not yet been explored. In addition to neurotoxic influences of activated astrocytes on mature neurons (Liddelow et al., 2017), proinflammatory astrocytes have also recently been shown to decrease hippocampal neurogenesis (Garber et al., 2018). Healthy hippocampal astrocytes influence long-term potentiation of synaptic activity and memory allocation (Adamsky, 2018), and the extent to which astrocytic contributions to cognition are disrupted by proinflammatory activation following MTX chemotherapy is unknown. Alterations in the ability of oligodendroglia to metabolically support axons (Simons and Nave, 2015) following chemotherapy exposure also remain to be elucidated. Collectively, these studies suggest complex cellular interactions are central to changes in brain structure and function following chemotherapy.
Conclusions
Here we show that the persistence of methotrexate chemotherapy-related cognitive impairment is associated with tri-glial dysfunction of oligodendrocyte lineage cells, astrocytes, and microglia. Activation of microglia is necessary for this cellular and functional dysregulation. The complex interplay between glial cells underscores the importance of these cells in a range of pathologies. As microglial activation is necessary for this dysregulation, our work suggests a potential therapeutic approach relying on CSF1R inhibitors such PLX5622 and similar agents currently in clinical trials for other indications. This work presents a promising therapeutic avenue to ameliorate the long-term neurological consequences of chemotherapy exposure, a debilitating syndrome that affects a great number of cancer survivors.
STAR Methods:
Contact for Reagent and Resource Sharing
Further information and requests for reseources and reagents should be directed to and will be fulfilled by the Lead Contact, Michelle Monje (mmonje@stanford.edu).
Experimental Model and Subject Details:
Human tissue analyses
Human samples were collected as part of a routine autopsy protocol from a standardized location of frontal cortex/subcortical white matter in individuals treated with multi-agent chemotherapy during childhood/young adulthood and from age-matched, non-chemotherapy exposed control cases. No cases received cerebral radiotherapy. Samples were obtained in collaboration with the Department of Pathology at Stanford University (see Supplemental Table 1). FFPE samples were stained immunohistochemically according to standard procedures on paraffin embedded sections (5 μm) (Monje et al., 2011). A control stain of Nestin was used to ensure quality of tissue samples. The following antibodies were used: Olig-2 (1:100, Cell Marque, 387M-16) and Nestin (1:20000, Millipore, MAB5326). For each sample, 200X frames were captured using a Nikon Eclipse E1000 microscope with a SPOT Flex camera in both grey matter and white matter regions, for a total of 10 images/case. The total density of Olig2+ cells was determined by extrapolating number of Olig2+ cells by the total volume of tissue assessed. For fluorescent immunohistochemistry, frontal lobe samples from both cases were obtained as part of a rapid autopsy protocol for tumor tissue donation, fixed in 4% paraformadehyde and embedded in 30% sucrose. Tissue was then sectioned at 40 μm and processed for confocal microscopy as described below. Tissue was processed with goat anti-PDGFRα (1:250, R&D Systems, AF1062) and rabbit anti-NG2 (1:200, Sigma, HPA002951) and imaged at 400X using a Zeiss LSM 700.
Mouse Maintenance
Wild-type CD57BL/6 mice (Charles River) were bred with CD1 mice (Charles River) for all experiments unless otherwise noted. All animals were housed in a 12-hour light:dark cycle with ad libitum access to food and water. Animals were housed 2–5 per cage. Both sexes were used equally for all studies. No animals were manipulated other than as reported for that experimental group, i.e. there was no history of drug exposures, surgeries or behavioral testing for the animals used other than that reported for the given experimental group. All procedures were performed in accordance with guidelines set in place by the Stanford University Institutional Care and Use Committee.
Isolation of Cells from Mouse Brain and Human Pediatric Brain Tumors
Cell Culture for IC50
Neural precursor cells (NPCs) were cultured as followed: Base cell medium for neural precursor cells was made using Neurobasal(-A) (Invitrogen, 10888–022), antibiotic-antimycotic (Invitrogen, 15240096), and B27(-A) (Invitrogen, 12587010). Mouse neural precursor cells (NPCs) of low passage number (10–15) were acquired. These cells were thawed from −80°C in a 37°C water bath and transferred to a 15 mL centrifuge tube where 10 mL of Hank’s Balanced Salt Solution without Calcium and Magnesium (HBSS, Fischer Scientific) was added to dilute the cryogenic protecting agent, DMSO. Cells were centrifuged for 5 min (300g). The supernatant was removed and replaced with 10 mL of base cell medium. This cell mixture was transferred to a T75cm2 flask (Nunc™ Cell Culture Treated 75 cm2 EasYFlask™, Fisher Scientific) along with Epidermal Growth Factor (at 20 ng/mL complexed to Alexa Fluor 647 Stretavidin, Life Technologies, E-35351), Fibroblast Growth Factor (20 ng/mL Stretavidin, PeproTech, 450–33), and heparin (2 ng/mL, Stem Cell Technologies, 07980). The NPCs were then used for IC50 experiments. Mouse OPCs were obtained by FACS (see below) and cultured in DMEM with Glutamax (Invitrogen, 35050–061), sodium pyruvate (Thermo Fisher, 11360070), MEM NEAAs (Invitrogen, 11140050), antibiotic-antimycotic with N21-MAX (R&D systems, AR012) and Trace Elements B (Corning, 25–022-CI) (all the aforementioned supplemented to 1X) and Insulin (5 μg/mL, Sigma, 19278), N-acetyl cysteine (5 μg/mL, Sigma, A9165), PDGFAA (10 ng/mL, PeproTech, 315–17), CNTF (10 ng/mL, PeproTech, 450–13), and NT-3 (1 ng/mL, PeproTech, 450–03). OPCs were then used for IC50 experiments. Pediatric cortical glioblastoma (SU-pcGBM) and diffuse intrinsic pontine glioma IV (DIPG IV) maintained in our lab were acquired. The SU-pcGBM and DIPG IV cells were cultured in a T75cm2 flask (Nunc™ Cell Culture Treated 75 cm2 EasYFlask™, Fisher Scientific). A defined, serum-free medium designated “Tumor Stem Media (TSM)” was used throughout, consisting of Neurobasal(-A), B27(-A), human-bFGF (20 ng/mL, Shenandoah Biotech,100–146), human-EGF (20 ng/mL, Shenandoah Biotech, 100–26), human PDGF-AA (10 ng/mL) and PDGF-BB (10 ng/mL) (Shenandoah, Biotech, 100–16 and 100–18) and heparin (2 ng/mL). When neurospheres and minimal space between growing cells were visible in the primary culture, the concentration of each cell line was determined using a hemocytometer (Hausser Scientific, Horsham, PA). NPCs were passaged every 4 days while SU-pcGBM and DIPG IV cells were passaged every 2 weeks.
Isolation of OPCs, microglia, and astrocytes by fluorescence-activated cell sorting
(FACS) For OPC transplantation sorts or OPC IC50, whole forebrains were removed from P6–8 GFP+ (C57BL/6-Tg(CAG-EGFP)1Osb/J; The Jackson Laboratory) or CD57BL/6:CD1 mice pups, respectively, of both sexes. For microglia and astrocyte sorts, frontal lobe deep cortex and subjacent corpus callosum was microdissected at P63–65. Tissue was then minced in Hibernate-A to approximately 1 mm3 pieces and pelleted at 200xg for 2 min. Supernatant was removed and tissue was resuspended in 25 μg/mL Liberase-H (Roche, 05401054001) solution in HBSS with Ca2+/Mg2+. Tissue was enzymatically dissociated for 30 min, rotating at 37°C. Samples were then triturated, and passed through a 100 μm filter. Dissociated tissue was pelleted then resuspended in 30% sucrose/HBSS solution and centrifuged at 2000 rpm for 10 min at 4°C without brake to remove myelin debris. Pellets were washed once in cold HBSS without Ca2+/Mg2+ and resuspended in Neurobasal-A + Hoechst 33342 (10 μg/ml final). Cells were then incubated at 37°C for 30 min to label nuclei. Samples were pelleted and resuspended in FACS Buffer (2% BSA/HBSS + 10 mM HEPES). Samples were blocked using rat IgG (8 μg/mL final, R&D Systems, 6–001-A) for 10 min on ice and then stained with preconjugated antibodies for 30 to 45 min. For OPC sorts, cells were stained with anti-CD140a (APA5, BioLegend, 135902). For microglial sorts, anti-CD11b (M1/70, BioLegend, 101216) was used. For astrocyte sorts, ALDH1L1-eGFP reporter mice were used (Tg(Aldh1l1-eGFP)OFC789Gsat/Mmucd mice were backcrossed onto a C57Bl/6 black background (Chung et al., 2013) a gift from the B. Barres and S. Liddelow).
Antibody stains were washed out and cells were resuspended in cold HBSS with 1:1000 Near IR LIVE/DEAD (Life Technologies, L10119). Following a 20 to 30 min incubation on ice to label dead cells, samples were washed once with cold HBSS, resuspended in FACS Buffer, and sorted on a BD FACS Aria by sequential yield and purity sorts. OPCs were isolated as the CD140a+ (PDGFRα+) population, microglia as the CD11b+ population, and astrocytes as the eGFP+ population. Microglia and astrocytes were sorted directly in RLT Plus Lysis Buffer.
Immunopanning and cell culture
Astrocytes were purified by immunopanning from P5 rat (Sprague Dawley rats obtained from Charles River) forebrains of both sexes and cultured as previously described (Foo et al., 2011). Briefly, cortices were enzymatically (papain) then mechanically dissociated to generate a single cell suspension that was incubated on successive negative immunopanning plates to remove microglia, endothelial cells, and oligodendrocyte lineage cells before positively selecting for astrocytes with an Itgb5-coated panning plate. Isolated astrocytes were cultured in a defined, serum-free base medium containing 50% neurobasal, 50% DMEM, 100 U/mL penicillin, 100 μg/mL streptomycin, 1 mM sodium pyruvate, 292 μg/mL L-glutamine, 1X SATO and 5 μg/mL of N-acetyl cysteine. This medium was supplemented with the astrocyte-required survival factor HBEGF (Peprotech, 100–47) at 5ng/mL as previously described (Foo et al., 2011). Microglia were purified by dounce homogenization on ice and grown in serum-free base medium containing DMEM/F12 containing 100 units/mL penicillin, 100 mg/mL streptomycin, 2mM glutamine, 5 mg/ml N-acetyl cysteine, 5 mg/mL insulin, 100 mg/mL apo-transferrin, and 100 ng/mL sodium selenite, all from GIBCO or Sigma. This medium was supplemented with the microglia-required survival factors: human TGFβ2 (2 ng/mL, Peprotech), murine IL34 (100 ng/mL, R&D Systems), and ovine wool cholesterol (1.5 mg/mL, Avanti Polar Lipids) (Bohlen et al., 2017). Both astrocyte and microglia cultures were treated with methotrexate dissolved in DMSO for 24 hrs, before collection and microfluidic analysis of activation (see below).
Method Details:
Liquid chromatography tandem mass spectrometry (LC-MS/MS)
Blood, kidney, liver, and frontal cortex were acquired 30 min post a single 100 mg/kg methotrexate injection from 5 mice. Mice were transcardially perfused with cold PBS followed by tissue sample dissection. Tissues samples were weighed and 1 volume of bullet blender beads (Next Advance) and 3 volume of Milli-Q water were added. Tissues were homogenized by a bullet blender (Next Advance) at 4°C according to manufacturer’s instruction. The neat stock solution of MTX was dissolved in DMSO at 5 mg/mL and further diluted in 50% methanol to prepare spiking solutions. To prepare spiked calibration curve, 25 μl of MTX spiking solutions (1–200 ng/mL for brain samples and 0.2–50 μg/ml for serum, kidney and liver samples) was mixed with 25 μl of blank tissue homogenate or serum. To prepare samples, the spiking solution was replaced by 25 μl of 50% methanol to make up the volume. After vortexing all standards and samples, 150 μl of methanol/acetonitrile 20:80 (v/v) containing the internal standard MTX-d3 was added to the mixture and vortexed vigorously for 1 min followed by centrifugation at 3,000 g for 10 min. The supernatant was diluted 3 times in Milli-Q water with 0.1% formic acid for brain samples and 50 times in 25% methanol with 0.1% formic acid for serum, kidney and liver samples.
The LC-MS/MS system consisted of a QTRAP 4000 mass spectrometer (AB SCIEX) coupled to a Shimadzu UFLC system. LC separation was carried out on an Acclaim 120 C8 column (2.1 mm × 50 mm, 5 μm) (Dionex) at room temperature. The analysis time was 2.6 min. The injection volume was 10 μl. The flow rate was 0.3 mL/min. Mobile phase A consisted of 2 mM ammonium acetate and 0.2% formic acid in LCMS grade water. Mobile phase B consisted of 0.1% formic acid in LCMS grade acetonitrile. The HPLC elution program was as follows: 10% B (0.5 min)→40% B (linear increase in 1 min)→10% B (linear decrease in 0.1 min)→10% B (1 min). The mass spectrometer was operated in the positive mode with multiple-reaction monitoring (MRM) with the transition m/z 455.2→175.1 for MTX and m/z 458.2→311.1 for MTX-d3. Data acquisition and analysis were performed using the Analyst 1.6.1 software (AB SCIEX).
Chemotherapy treatment paradigm
CD57BL/6:CD1 mice were given an i.p. injection of 100 mg/kg methotrexate (MTX) dissolved in PBS obtained from the pharmacy at Lucile Packard Children’s Hospital at Stanford University on P21, P28, and P35. For assessment of the effect of chemotherapy on proliferation, animals additionally received i.p. injections of the thymadine analogue 5-ethynyl-2’-deoxyuridine (EdU; 40 mg/kg, Invitrogen, E10187) on P61, P62, and P63. Animals were then sacrificed (30 min post EdU injection) or assessed (see below) on P63 or P203.
Perfusion and immunohistochemistry
Animals assessed using fluorescent immunohistochemistry were anesthetized with avertin and transcardially perfused with 10–15 mL PBS. Brains were post-fixed in 4% paraformaldehyde (PFA) overnight at 4°C prior to cryoprotection in 30% sucrose. Brains were embedded in O.C.T. (Tissue-Tek) and sectioned at 40 μm in the coronal plane using a sliding microtome (Leica, HM450). For immunohistochemistry involving EdU, sections were stained using the Click-iT EdU cell proliferation kit (Thermo Fisher, C10424) and protocol to expose EdU labeling prior to blocking. For all other stains, sections were incubated directly in blocking solution (3% normal donkey serum, 0.3% Triton X-100 in TBS) for 1 hr at room temperature and then incubated in primary antibodies overnight. Goat anti-PDGFRα (1:500; R&D Systems AF1062), rabbit anti-Iba1 (1:2000; Wako 019–19741), rat anti-CD68 (1:200; Abcam AB53444), rabbit anti-Olig1 and mouse anti-Olig1 (1:5000; 1:5:00, respectively, a generous gift from Dr. John Alberta), mouse anti-CC1 (1:20 and incubated for 7–10 days; Millipore OP-80), rabbit anti-cleaved caspase-3 (1:500; Cell Signaling 9661S) and rat anti-MBP (1:200; Abcam AB7349) were diluted in 1% blocking solution (normal donkey serum in 0.3% Triton X-100 in TBS) and incubated overnight at 4°C. All antibodies have been validated in the literature and/or in Antibodypedia for use in mouse immunohistochemistry. To further validate the antibodies in our hands, we confirmed that each antibody stained in the expected cellular patterns and brain-wide distributions. Secondary-only stains were performed as negative controls. The following day, sections were rinsed 3 times in 1X TBS and incubated in secondary antibody solution (1:500) and DAPI (1:1000) in 1% blocking solution at 4°C overnight. The following secondary antibodies were used, Alexa 488 donkey anti-goat (Jackson ImmunoResearch), Alexa 594 donkey anti-goat (Jackson ImmunoResearch), Alexa 647 donkey anti-mouse (Invitrogen) or Alexa 647 donkey anti-rabbit (Jackson ImmunoResearch). The next day, sections were rinsed 3 times in TBS and mounted with Prolong Gold plus DAPI mounting medium (Invitrogen).
RNAScope
Animals were sacrificed at P62–64 and perfused with HBSS. Brains were removed and immediately placed in OCT and frozen in liquid nitrogen. Tissue was stored at −80°C until sectioned on a cryostat at a thickness of 16 μm. Before performing RNAScope, slides were transferred directly from −80°C to 4% PFA/HBSS on ice for 15 min. Sections were then successively dehydrated in 50% ethanol, 70% ethanol, and twice in 100% ethanol for 5 min each and allowed to dry before treatment for 5 min with Protease IV from the RNAScope Fluorescent Multiplex Reagent Kit (Advanced Cell Diagnostics, 320850). Slides were washed twice with HBSS before proceeding to probe hybridization. RNAScope was performed according to Fluorescent Multiplex Reagent Kit protocol using RNAScope probes against Slc1a3 (GLAST; Advanced Cell Diagnostics, 430781) and Cxcl10 (Advanced Cell Diagnostics, 408921-C2). Slides were mounted in Prolong Gold and imaged on either a Zeiss LSM700 or LSM800 at 400X magnification within 72 hrs of hybridization. Z-stacks were acquired for three counting frames throughout the corpus callosum of the frontal cortex and a maximum intensity image was generated for each image. The number of CXCL10 puncta per GLAST+ cell was quantified by a blind rater for each image. Those GLAST+ astrocytes with more than 8 CXCL10 puncta/cell were considered highly pan reactive.
Confocal imaging
For fluorescent immunohistochemistry, two representative sections, one anterior and one posterior to the formation of the genu of the corpus callosum were selected for each animal. Z-stacks were acquired using a Zeiss LSM 700 or LSM 800 for five counting frames taken at 200X (320 μm x 320 μm frame) between the two sections and a maximum intensity image was generated for each image. For each section, a superficial frame was captured to include layers I and II of the premotor cortex (M2) and a deep cortical frame was captured to include layers V and VI of the premotor cortex. For the white matter quantification, each section was imaged at the cingulum of the corpus callosum and half-way to midline within the corpus callosum. The posterior section included a frame taken at the genu of the corpus callosum.
Volume measures
Estimated volume measurements for the corpus callosum were obtained using the Cavalieri Estimator function on a MBF Bioscience StereoInvestigator version 11.01.2. A 1:6 series of coronal brain sections were stained with MBP antibody (myelin basic protein). Using the 10X objective, the Cavalieri Estimator probe was used to trace the corpus callosum; the boundaries were determined using published mouse anatomical guides. A total of 13 sections were analyzed per treatment group.
Electron microscopy
Four weeks (P63) or 6 months (P203) after the cessation of treatment, mice were sacrificed by transcardial perfusion with Karnovsky’s fixative: 2% glutaraldehyde (EMS 16000) and 4% paraformaldehyde (EMS 15700) in 0.1M sodium cacodylate (EMS 12300), pH 7.4. Region containing premotor cortex (M2) and projections to the corpus callosum was resected from the brain and post-fixed in Karnovsky’s fixative for at least 2 weeks. Transmission electron microscopy was performed in the region of the M2 subcortical fibers as they leave cortical layer VI and enter the corpus callosum. The samples were then post-fixed in 1% osmium tetroxide (EMS 19100) for 1 hr at room temperature, washed 3 times with ultrafiltered water, then en bloc stained for 2 hrs at room temperature. Samples were then dehydrated in graded ethanol (50%, 75%, and 95%) for 15 min each at 4°C; the samples were then allowed to equilibrate to room temperature and were rinsed in 100% ethanol 2 times, followed by acetonitrile for 15 min. Samples were infiltrated with EMbed-812 resin (EMS 14120) mixed 1:1 with acetonitrile for 2 hrs followed by 2:1 EMbed-812:acetonitrile for 2 hrs. The samples were then placed into EMbed-812 for 2 hrs, then placed into TAAB capsules filled with fresh resin, which were then placed into a 65°C oven overnight. Sections were taken between 75 and 90 nm on a Leica Ultracut S (Leica, Wetzlar, Germany) and mounted on Formvar/carbon coated slot grids (EMS FCF2010-Cu) or 100 mesh Cu grids (EMS FCF100-Cu). Grids were contrast stained for 30 sec in 3.5% uranyl acetate in 50% acetone followed by staining in 0.2% lead citrate for 30 sec. Samples were imaged using a JEOL JEM-1400 TEM at 120kV and images were collected using a Gatan Orius digital camera. With experimenters blinded to sample identity and condition, axons were analyzed for g-ratios calculated by dividing the axonal diameter by the corresponding axonal-plus-sheath diameter (diameter of axon/diameter of axon + myelin sheath) at 4000X using ImageJ software. For each animal, approximately 100 axons were scored. Statistics for g-ratios were calculated on a per animal basis.
IC50
96 well plates (Corning Life Sciences, Corning, NY) were coated with 50 μL of PLL (Poly-L-Lysine, 10 g/mL, Sigma-Aldrich, St. Louis, MO) for 30 min, and then rinsed 3 times with PBS, each rinse at least 5 min in duration. After the last rinse with PBS, the plates were stored in the incubator at 37°C for at least 3 hrs. Cells were plated at concentration of 5000 cells/well in 100 μL of their respective medium. Triplicates for each concentration of MTX (diluted in cell medium appropriate for each cell line) from 10 mM of MTX to 10 pM (decreasing in concentration by an order of magnitude for every triplicate), were tested to best determine the IC50 for each cell line. The cells were then incubated for 24 or 48 hrs at 37°C. CellTiter-Glo reagent (Promega, G9243) was added at a 1:1 ratio (100 μL) and allowed to incubate for 10 min at room temperature before measuring luminescence using a plate reader (Thermoscientic Varioskan™ LUX multimode microplate reader). Average luminescence for each cell line at every concentration of MTX tested was normalized to the controls (no MTX exposure (positive control) and no cells plated (negative control)). Using this procedure, it was possible to determine the extent of cell death for every concentration of MTX tested and extrapolate the concentration of MTX exposure leading to 50% cell death of each cell line.
Syngeneic Transplantation of OPCs
eGFP (C57BL/6-Tg(CAG-EGFP)1Osb/J) mice (The Jackson Laboratory) on a CD57/BL6 background were bred with CD1 mice to produce animals that were syngeneic with the juvenile MTX or PBS treated mice used in this study. P6–8 GFP+ mice were used to sort PDGFRα+ cells by FACS from the frontal cortex (see above). Sorted GFP+/PDGFRα+ cells were immediately stereotactically transplanted unilaterally into deep cortical M2/cingulum of the corpus callosum (A-P: +0.7 mm; M-L: 0.9 mm; D-V: −2.0 mm) of previously treated MTX or PBS animals at P63 (four weeks post-treatment). Cells were injected at a concentration of 20,000 cells/μl. Cells were allowed to engraft for 10 days before animals were transcardially perfused (see above).
Behavioral analysis
CatWalk:
To investigate the effect of juvenile chemotherapy exposure on motor output, the CatWalk gait analysis system (Noldus, Netherlands) was used. To ensure consistent running, mice were acclimated to handling for several weeks before recording, and all tests were run in a dark room. Animals were tested four weeks (P63) after the cessation of the chemotherapy treatment paradigm previously described. No behavioral training on the CatWalk apparatus was performed. Behavioral testing was performed during the light cycle in a dark room with red light. Four successful runs (with success being characterized by variation under 60%, lasting no more than 5 sec, and consistent movement) were processed with the CatWalk XT 9.0 software.
Our previous work suggests that swing speed, as a sensitive measure of motor system function, is selectively altered if myelination is affected within the premotor circuit. We did not expect to see a difference in stride length. In this study, only the following parameters were analyzed:
Swing speed: the speed (cm/s) of the paw during limb swinging. Swing speed was calculated as the average of the left and right forepaw swing speeds.
Stride length: the distance (cm) between successive placements of the same paw. Calculation of stride length is based on the X-coordinates of the center of the paw print of two consecutive placements of the same paw during maximum contact of the paw with the glass floor.
Open Field test:
Social anxiety was analyzed using a modified version of the open field test that focused on an animal’s willingness to explore objects placed in the center of an open field. All mice were exposed to the same MTX/PBS paradigm at P21–35 as described above. Animals were handled at P62 for 10 min. After handling, the mice were placed in the experimental chamber to acclimate for 20 min. The experimental chamber was 61cm x 61cm x 61cm made of opaque Plexiglas. A camera was mounted 115 cm above the chamber to record the animal’s behavior. The test was conducted during the animal’s light phase, in a dark room with only red light.
On the day of testing (P63) the mice were handled for two min, and then placed in the experimental chamber with two identical Lego® objects (of approx. 5 cm in height). The mouse was allowed to explore the arena for 5 min. After the testing was completed the mice were weighed, as a measure of health, to allow the groups to be compared. The camera footage was then analyzed (using CowLog analysis software). The animal’s willingness to explore the center of the arena with the objects was assessed.
Novel Object Recognition Test:
Cognition was analyzed using a modified version of the novel object recognition task (NORT) that focused on the attentional component of the task. The test was modified so that the duration between the training and testing phase was shortened, this was to ensure that the test placed a greater cognitive load on short-term memory, attention and frontal lobe function rather than long-term memory and hippocampal function. All mice were exposed to the same MTX/PBS paradigm at P21–35 as described above. Animals were handled daily for the week leading up to the test for 2 min. After handling, the mice were then placed in the experimental chamber on P62 or P202 to acclimatize for 20 min prior to testing on P63 or P203, respectively. The set up consisted of an opaque Plexiglas experimental chamber 61cm x 61cm x 61cm, and a camera mounted 115 cm above the chamber. The test was conducted during the animal’s light phase, in a dark room illuminated with only red light.
On the day of testing (P63 or P203) the mice were handled for 2 min and then placed in the chamber to acclimate for 20 min before being returned to the home cage for another 5 min. Mice were then placed in the experimental chamber with two identical Lego objects (of approx. 5 cm). Each time the mouse was placed into the chamber, the mouse was facing the opaque wall, with the animal’s tail in the direction of the objects. During the training phase, the mouse was allowed to explore the identical objects for 5 min. The mouse was once again returned to the home cage for 5 min and the experimental chamber and the objects were cleaned with 70% ethanol. During this time, one cleaned object from the sample phase was placed back into the experimental chamber along with a new Lego® object (of approx. 5 cm) for the novel object phase. During the testing phase, the mouse was returned to the experimental chamber and allowed to explore for 10 min.
The objects used as novel and familiar were counterbalanced, as was the position of the novel object from trial to trial, animal to animal. All of the Lego® objects used in the behavioral paradigm were piloted to ensure that there was no bias, or object preference for the animals. The camera footage was then analyzed (using CowLog analysis software), and any exploratory head gestured within 2 cm of the Lego® object, including sniffing and biting were considered object investigation, but not sitting on the object, or casual touching of the object in passing (Leger et al., 2013). Only animals that explored the objects for a minimum of 20 sec for P63 or 10 sec for P203 were included in the analysis. After the testing was completed the mice were weighed, as a measure of health, to allow the groups to be compared. The Recognition Ratio was determined by taking the ratio of the amount of time spent investigating one object compared to the total time spent investigating both objects (i.e. time spent with Novel Object / (time spent with Novel Object + time spent with Familiar Object)).
Microfluidic qRT-PCR
Total RNA was extracted from immunopanned cells using the RNeasy Plus kit (Qiagen) and cDNA synthesis performed using the High-Capacity RNA-to-cDNA™ Kit (Applied Biosystems) according to supplier protocols. We designed primers using NCBI primer blast software (http://www.ncbi.nlm.nih.gov/tools/primer-blast/) and selected primer pairs with least probability of amplifying nonspecific products as predicted by NCBI primer blast. We tested the specificity of the primer pairs by PCR with rat and mouse whole-brain cDNA (prepared fresh), and examined PCR products by agarose gel electrophoresis. For microfluidic qRT-PCR, 1.25 μL of each cDNA sample was pre-amplified using 2.5 μL of 2x Taqman pre-amplification master mix (Applied Biosystems) and 1.25 μL of the primer pool (0.2 pmol each primer/ μL). Pre-amplification was performed using a 10 min 95°C denaturation step and 14 cycles of 15 sec at 95°C and 4 min at 60°C. Reaction products were diluted 1:5 in TE Buffer (Teknova). Five microliters from a sample mix containing pre-amplified cDNA and amplification Master mix (20 mm Mgcl2, 10 mm dNTPs, FastStart Taq polymerase, DNA binding Dye loading reagent, 50× ROX, 20× Evagreen) was loaded into each sample inlet of a 96.96 Dynamic Array chip (Fluidigm) and 5 μL from an assay mix containing DNA assay loading reagent, as well as forward and reverse primers (10 pmol/μL) was loaded into each detector inlet. The chip was then placed in the NanoFlexTM 4-IFC Controller (Fluidigm) for loading and mixing. After loading, the chip was processed in the BioMarkTM Real-Time PCR System (Fluidigm) using a cycling program of 10 min at 95°C followed by 40 cycles of 95°C for 15 sec and 60°C for 30 sec and 72°C for 30 sec. After completion of qPCR, a melting curve of amplified products was determined. Data were collected using BioMarkTM Data Collection Software 2.1.1 build 20090519.0926 (Fluidigm) as the cycle of quantification (Cq), where the fluorescence signal of amplified DNA intersected with background noise. Data were corrected for differences in input RNA using the geometric mean of the reference gene Rplp0. Data preprocessing and analysis was completed using Fluidigm Melting Curve Analysis Software 1.1.0 build 20100514.1234 (Fluidigm) and Real-time PCR Analysis Software 2.1.1 build 20090521.1135 (Fluidigm) to determine valid PCR reactions. Invalid reactions were removed from later analysis. All primer sequences for rat and mouse were used previously (Liddelow et al., 2017; see Table S2).
Standard qRT-PCR.
Total RNA was extracted and cDNA synthesized as above. Quantitative RT-PCR was run using 2 μL cDNA and SYBR green chemistry (Applied Biosystems/ThermoFisher Scientific) using supplier protocol and a cycling program of 2 min at 95°C followed by 40 cycles of 95°C for 3 sec and 60°C for 30 sec on a Mastercycler epgradient S (Eppendorf). After completion of qPCR, a melting curve of amplified products was determined. Data were collected using a Mastercycler ep realplex v2.2 (Eppendorf). All primer sequences for rat and mouse were used previously (Liddelow et al., 2017; see Table S2).
Depletion of microglia using PLX5622
PLX5622, an inhibitor of colony-stimulating factor 1 receptor, was administered to mice ad libitum from P38–63. PLX5622 was provided by Plexxikon Inc. (Berkeley, CA) and formulated in AIN-76A standard chow with 1,200 mg of PLX5622 by Research Diets Inc. Animals then underwent behavioral testing using the NORT or perfusion for immunohistochemical analysis, transmission electron microscopy analysis, or RNAScope analysis as described above.
Quantification and Statistical Analyses:
For fluorescent immunohistochemistry of mouse tissue, total number of PDGFRα+ only, PDGFRα+/Olig1nuclear, Olig1perinuclear, CC1+, EdU+/PDGFRα+, CD68+/Iba1+, cleaved caspase-3+ cells were quantified by a blinded rater for all 5 frames/animal (taken at 200X). Cells were considered co-labeled when they co-localized on the same plane. The density of cells was determined by dividing the total number of cells quantified for each lineage by the total volume of the imaged frames (mm3). For transplantation of syngeneic PDGFRα+ cells, 30–50 GFP+ cells/animal were counted in the corpus callosum and assessed for co-localization with PDGFRα+, PDGFRα+/Olig1+, and Olig1+. Only GFP+ cells distant from the needle tract and within the corpus callosum were quantified to avoid any confounding inflammatory effects of activated microglia in response to the needle stick injury.
All statistical analyses were conducted using GraphPad Prism statistical software, including Tests of Normality. For density of PDGFRα+ with and without EdU, PDGFRα+ Olig1nuclear, Olig1perinuclear, CC1+, CD68+/Iba1+, cleaved caspase-3, corpus callosum volume measures, g-ratios, behavioral tests, and syngeneic transplantation of GFP+ cells group mean differences were assessed using unpaired, two-tailed Student’s t-tests. For microglia and astrocyte reactivity states 2-way ANOVA with post-hoc analyses were used to assess main group differences. For analysis of the effect of PLX5622 chow on microglial and oligodendroglial cell densities and astrocyte reactivity, 2-way ANOVA plus Tukey post-hoc analyses or 1-way ANOVA were performed. For assessment of Olig2 immunohistochemistry in human samples, paired t-tests were used. For parametric data, ANOVAs were run with post-hoc analyses. For nonparametric data, Mann-Whitney statistical tests were implemented. A level of p < 0.05 was used to designate significant differences.
Data and Software Availability:
Data Resources: Raw data are available through Mendeley Data: doi:10.17632/wjhdwcrgct.1
Supplementary Material
Figure S1, Related to Figure 2:
A) Serum and tissue concentrations of methotrexate 30 min following a single 100 mg/kg i.p. dose of MTX using LC-MS/MS. Dots represent individual mice (n=5). The purple shaded region represents the range in serum concentrations detected in children following a single high-dose 6-hr infusion of MTX (Bratlid and Moe, 1978). Data shown as mean±SEM
B-F) MTX IC50 curves for various cells populations. Purple bars represent MTX concentrations achieved in the brain following a single 100 mg/kg i.p. injection of MTX. n=3 wells for each data point
B-C) PDGFRα+ cells were isolated from P6–8 mice using FACS and exposed to various MTX concentrations for 24 hrs (B) or 48 hrs (C). The 24-hr IC50 for mouse PDGFRα+ cells was 140.4 nM.
D-E) 48-hr MTX IC50 > 1 mM for patient-derived high-grade glioma cultures, pediatric cortical glioblastoma (SU-pcGBM, D) and diffuse intrinsic pontine glioma (SU-DIPG IV, E)
F) 48-hr MTX IC50 of neural precursor cells (NPC) derived from mouse brain is 12.4 nM
Figure S2, Related to Figure 2:
A) Low magnification photomicrographs of PDGFRα+ (green), Olig1+ (white), and CC1+ (red) cells in the corpus callosum of PBS or MTX mice. Scale bar=50 μm
B) Similar to white matter, MTX induces a decrease in PDGFRα+ OPCs (p=0.038; n=4/group) and concomitant increase in late PDGFRα+/Olig1+ cells (p=0.025; n=4/group) in the deep cortical grey matter of the premotor cortex without an increase in CC1+ mature oligodendrocytes (n=7/group; p=0.15).
C) Juvenile MTX treatment does not decrease the cell density of PDGFRα+ OPCs (p=0.68; n=4/group) or CC1+ mature oligodendrocytes (p=0.091; n=7/group) in the superficial grey matter but does increase late PDGFRα+/Olig1+ cell density (n=4/group; p=0.016).
D) MTX (n=7 mice) exposure decreases perinuclear Olig1+ cell density in the corpus callosum compared to PBS (n=8) treatment (p=0.0075).
E) Apoptotic cells as marked by cleaved caspase-3 with or without co-localization of PDGFRα, Olig1, or CC1 24 hrs following a single i.p. injection of MTX (n=7) or PBS (n=6) at P21 (p=0.0356)
F) Density of cleaved caspase-3+ cells in the corpus callosum 24 hrs following a single MTX injection at P21 (n=7) and four weeks following MTX (n=7) or PBS (n=8) injections at P21, 28, and 35 (MTX 24-hrs vs. MTX 4 wks; p=0.0048). No cleaved caspase-3 was detected in PDGFRa+ cells.
Data shown as mean±SEM, n.s. = p>0.05, * p<0.05, ** p<0.01 by unpaired two-tailed Student’s t-test or two-way ANOVA (E)
Figure S3, Related to Figure 3
A-B) High magnification photomicrographs (400X) of myelin basic protein (MBP; green) in the corpus callosum of PBS- (A) and MTX- (B) exposed mice at P63. Scale bar=20 μm
C) Average g-ratio of premotor circuit axons as they enter the cingulum of the corpus callosum in P63 PBS (0.7465±0.005; n=5) and MTX (0.8014±0.0079; n=8) exposed mice four weeks following treatment (p=0.0003)
D-E) Catwalk gait analysis was used to assess motor performance in mice at P63 following early life PBS or MTX exposure. MTX-exposed mice exhibit decreases in forepaw swing speed (D; p=0.0067) with no observed alterations to stride length (E; p=0.2986; n=9 mice PBS, n=6 mice MTX).
F) Anxiety following chemotherapy exposure was assessed using an open-field test at P63 (p=0.0082; n=12 mice PBS, n=10 mice MTX).
G) Average g-ratio of premotor circuit axons as they enter the cingulum of the corpus callosum in P203 PBS (0.7073±0.004; n=4) and MTX (0.7697±0.007; n=4) exposed mice 6 months following treatment (p=0.0003)
Data shown as mean±SEM, n.s. = p>0.05, ** p<0.01, *** p<0.001 by unpaired two-tailed Student’s t-test
Figure S4, Related to Figure 4:
Photomicrograph of cultured PDGFRα+ cells (green) sorted by FACS. Sort purity for PDGFRα+ cells is 98.03%, with very few Iba+ microglial cells (red). DAPI (blue); Scale bar=50 μm
Figure S5, Related to Figure 7:
A) Photomicrographs (400X) of CXCL10 puncta (green) on GLAST+ astrocytes (red) in PBS- and MTX-exposed mice with and without PLX5622; Scale bar=20 μm
B) Microglial depletion (PLX5622) rescues myelin deficits in mice exposed to juvenile MTX in small (<0.5μm; p<0.0001) and medium (0.5μm-1.0 μm; p=0.0084) caliber axons but not completely in large caliber axons (>1.0 μm; p=0.06) compared to MTXcontrol mice. PBS-control n=3 mice; MTX-control n=3 mice; PBS-PLX5622 n=5 mice; MTX-PLX5622 n=3 mice.
C) Average axon diameter in MTX and PBS mice with or without microglial depletion at P63
Data shown as mean±SEM, n.s. p>0.05, ** p<0.01, *** p<0.001 by two-way ANOVA with Tukey post-hoc testing
Highlights:
Chemotherapy depletes oligodendrocyte lineage (OL) cells in humans
Methotrexate chemotherapy disrupts OL dynamics, myelin and cognition in mice
Methotrexate induces chronic microglial activation and astrocyte reactivity
Microglial depletion rescues glial cell dysregulation and cognitive deficits
Acknowledgements:
We acknowledge support from the California Institute for Regenerative Medicine (CIRM RB4–06093 and RN3–06510), Unravel Pediatric Cancer, McKenna Claire Foundation, Virginia and D.K. Ludwig Fund for Cancer Research, Stanford Medical Scientist Training Program, Stanford Neuroscience Institute, the Child Health Research Institute, Anne T. and Robert M. Bass Endowed Faculty Scholarship in Pediatric Cancer and Blood Diseases, Stanford CTSA (UL1 RR025744), BioX Institute, McCormick Fellowship, Stanford MedScholars Program, Christopher and Dana Reeve Foundation, the Novartis Institute for Biomedical Research, Dr. Miriam and Sheldon G. Adelson Medical Research Foundation, the JPB Foundation, the Cure Alzheimer’s Fund, the Glenn Foundation, the Esther B O’Keeffe Charitable Foundation, Australian National Health and Medical Research Council (GNT1052961), and the Glenn Foundation Glenn Award. Special thanks to Sigrid Knemeyer for illustrations and Wenchao Sun for LC-MS/MS processing.
Footnotes
Publisher's Disclaimer: This is a PDF file of an unedited manuscript that has been accepted for publication. As a service to our customers we are providing this early version of the manuscript. The manuscript will undergo copyediting, typesetting, and review of the resulting proof before it is published in its final citable form. Please note that during the production process errors may be discovered which could affect the content, and all legal disclaimers that apply to the journal pertain.
Declaration of Interests:
The authors declare no competing interests.
References:
- Acharya MM, Martirosian V, Chmielewski NN, Hanna N, Tran KK, Liao AC, Christie LA, Parihar VK, and Limoli CL (2015). Stem cell transplantation reverses chemotherapy-induced cognitive dysfunction. Cancer Res 75, 676–686. [DOI] [PMC free article] [PubMed] [Google Scholar]
- Adamsky A,K. A; Kreisel T; Doron A; Ozeri-Engelhard N; Melcer T; Refaeli R; Horn H; Regev L; Groysman M; London M; Goshen I (2018). Astrocytic Activation Generates De Novo Neuronal Potentiation and Memory Enhancement. Cell 174, 1–13. [DOI] [PubMed] [Google Scholar]
- American Cancer Society (2016). Cancer Treatment & Survivorship Facts & Figures 2016–2017.
- Anderson VA, Godber T, Smibert E, Weiskop S, and Ekert H (2000). Cognitive and academic outcome following cranial irradiation and chemotherapy in children: a longitudinal study. British journal of cancer 82, 255–262. [DOI] [PMC free article] [PubMed] [Google Scholar]
- Aukema EJ, Caan MW, Oudhuis N, Majoie CB, Vos FM, Reneman L, Last BF, Grootenhuis MA, and Schouten-van Meeteren AY (2009). White matter fractional anisotropy correlates with speed of processing and motor speed in young childhood cancer survivors. Int J Radiat Oncol Biol Phys 74, 837–843. [DOI] [PubMed] [Google Scholar]
- Baxi EG, DeBruin J, Jin J, Strasburger HJ, Smith MD, Orthmann-Murphy JL, Schott JT, Fairchild AN, Bergles DE, and Calabresi PA (2017). Lineage tracing reveals dynamic changes in oligodendrocyte precursor cells following cuprizone-induced demyelination. Glia 65, 2087–2098. [DOI] [PMC free article] [PubMed] [Google Scholar]
- Benes FM (1989). Myelination of cortical-hippocampal relays during late adolescence. Schizophr Bull 15, 585–593. [DOI] [PubMed] [Google Scholar]
- Bennett ML, Bennett FC, Liddelow SA, Ajami B, Zamanian JL, Fernhoff NB, Mulinyawe SB, Bohlen CJ, Adil A, Tucker A, Weissman IL, Chang EF, Li G, Grant GA, Hayden Gephart MG, Barres BA (2016) New tools for studying microglia in the mouse and human CNS. Proc Natl Acad Sci U S A 113(12):E1738–1746. [DOI] [PMC free article] [PubMed] [Google Scholar]
- Bialas AR, and Stevens B (2013). TGF-beta signaling regulates neuronal C1q expression and developmental synaptic refinement. Nat Neurosci 16, 1773–1782. [DOI] [PMC free article] [PubMed] [Google Scholar] [Retracted]
- Bisen-Hersh EB, Hineline PN, and Walker EA (2013). Effects of early chemotherapeutic treatment on learning in adolescent mice: implications for cognitive impairment and remediation in childhood cancer survivors. Clinical cancer research : an official journal of the American Association for Cancer Research 19, 3008–3018. [DOI] [PMC free article] [PubMed] [Google Scholar]
- Bohlen CJ, Bennett FC, Tucker AF, Collins HY, Mulinyawe SB, and Barres BA (2017). Diverse Requirements for Microglial Survival, Specification, and Function Revealed by Defined-Medium Cultures. Neuron 94, 759–773 e758. [DOI] [PMC free article] [PubMed] [Google Scholar]
- Bratlid D, and Moe PJ (1978). Pharmacokinetics of high-dose methotrexate treatment in children. European journal of clinical pharmacology 14, 143–147. [DOI] [PubMed] [Google Scholar]
- Bray VJ, Dhillon HM, Bell ML, Kabourakis M, Fiero MH, Yip D, Boyle F, Price MA, and Vardy JL (2017). Evaluation of a Web-Based Cognitive Rehabilitation Program in Cancer Survivors Reporting Cognitive Symptoms After Chemotherapy. J Clin Oncol 35, 217–225. [DOI] [PubMed] [Google Scholar]
- Briones TL, and Woods J (2014). Dysregulation in myelination mediated by persistent neuroinflammation: possible mechanisms in chemotherapy-related cognitive impairment. Brain, behavior, and immunity 35, 23–32. [DOI] [PMC free article] [PubMed] [Google Scholar]
- Chung WS, Clarke LE, Wang GX, Stafford BK, Sher A, Chakraborty C, Joung J, Foo LC, Thompson A, Chen C, et al. (2013). Astrocytes mediate synapse elimination through MEGF10 and MERTK pathways. Nature 504, 394–400. [DOI] [PMC free article] [PubMed] [Google Scholar]
- Dagher NN, Najafi AR, Kayala KM, Elmore MR, White TE, Medeiros R, West BL, and Green KN (2015). Colony-stimulating factor 1 receptor inhibition prevents microglial plaque association and improves cognition in 3xTg-AD mice. Journal of neuroinflammation 12, 139. [DOI] [PMC free article] [PubMed] [Google Scholar]
- Dawson MR, Polito A, Levine JM, and Reynolds R (2003). NG2-expressing glial progenitor cells: an abundant and widespread population of cycling cells in the adult rat CNS. Mol Cell Neurosci 24, 476–488. [DOI] [PubMed] [Google Scholar]
- Dietrich J, Han R, Yang Y, Mayer-Proschel M, and Noble M (2006). CNS progenitor cells and oligodendrocytes are targets of chemotherapeutic agents in vitro and in vivo. J Biol 5, 22. [DOI] [PMC free article] [PubMed] [Google Scholar]
- Ellenberg L, Liu Q, Gioia G, Yasui Y, Packer RJ, Mertens A, Donaldson SS, Stovall M, Kadan-Lottick N, Armstrong G, et al. (2009). Neurocognitive status in long-term survivors of childhood CNS malignancies: a report from the Childhood Cancer Survivor Study. Neuropsychology 23, 705–717. [DOI] [PMC free article] [PubMed] [Google Scholar]
- Elmore MR, Najafi AR, Koike MA, Dagher NN, Spangenberg EE, Rice RA, Kitazawa M, Matusow B, Nguyen H, West BL, et al. (2014). Colony-stimulating factor 1 receptor signaling is necessary for microglia viability, unmasking a microglia progenitor cell in the adult brain. Neuron 82, 380–397. [DOI] [PMC free article] [PubMed] [Google Scholar]
- Erblich B, Zhu L, Etgen AM, Dobrenis K, and Pollard JW (2011). Absence of colony stimulation factor-1 receptor results in loss of microglia, disrupted brain development and olfactory deficits. PloS one 6, e26317. [DOI] [PMC free article] [PubMed] [Google Scholar]
- Foo LC, Allen NJ, Bushong EA, Ventura PB, Chung WS, Zhou L, Cahoy JD, Daneman R, Zong H, Ellisman MH, et al. (2011). Development of a method for the purification and culture of rodent astrocytes. Neuron 71, 799–811. [DOI] [PMC free article] [PubMed] [Google Scholar]
- Garber C, Vasek MJ, Vollmer LL, Sun T, Jiang X, and Klein RS (2018). Astrocytes decrease adult neurogenesis during virus-induced memory dysfunction via IL-1. Nature immunology 19, 151–161. [DOI] [PMC free article] [PubMed] [Google Scholar]
- Geha S, Pallud J, Junier MP, Devaux B, Leonard N, Chassoux F, Chneiweiss H, Daumas-Duport C, and Varlet P (2010). NG2+/Olig2+ cells are the major cycle-related cell population of the adult human normal brain. Brain Pathol 20, 399–411. [DOI] [PMC free article] [PubMed] [Google Scholar]
- Gibson E, and Monje M (2012). Effect of cancer therapy on neural stem cells: implications for cognitive function. Curr Opin Oncol 24, 672–678. [DOI] [PMC free article] [PubMed] [Google Scholar]
- Gibson EM, Purger D, Mount CW, Goldstein AK, Lin GL, Wood LS, Inema I, Miller SE, Bieri G, Zuchero JB, et al. (2014). Neuronal activity promotes oligodendrogenesis and adaptive myelination in the mammalian brain. Science 344, 1252304. [DOI] [PMC free article] [PubMed] [Google Scholar]
- Grabert K, Michoel T, Karavolos MH, Clohisey S, Baillie JK, Stevens MP, Freeman TC, Summers KM, and McColl BW (2016). Microglial brain region-dependent diversity and selective regional sensitivities to aging. Nat Neurosci 19, 504–516. [DOI] [PMC free article] [PubMed] [Google Scholar]
- Green JL, Knight SJ, McCarthy M, and De Luca CR (2013). Motor functioning during and following treatment with chemotherapy for pediatric acute lymphoblastic leukemia. Pediatric blood & cancer 60, 1261–1266. [DOI] [PubMed] [Google Scholar]
- Hagemeyer N, Hanft KM, Akriditou MA, Unger N, Park ES, Stanley ER, Staszewski O, Dimou L, and Prinz M (2017). Microglia contribute to normal myelinogenesis and to oligodendrocyte progenitor maintenance during adulthood. Acta neuropathologica 134, 441–458. [DOI] [PMC free article] [PubMed] [Google Scholar]
- Han R, Yang YM, Dietrich J, Luebke A, Mayer-Proschel M, and Noble M (2008). Systemic 5-fluorouracil treatment causes a syndrome of delayed myelin destruction in the central nervous system. J Biol 7, 12. [DOI] [PMC free article] [PubMed] [Google Scholar]
- Hill RA, Li AM, and Grutzendler J (2018). Lifelong cortical myelin plasticity and age-related degeneration in the live mammalian brain. Nat Neurosci. [DOI] [PMC free article] [PubMed] [Google Scholar]
- Horowitz TS, Suls J, and Trevino M (2018). A Call for a Neuroscience Approach to Cancer-Related Cognitive Impairment. Trends in neurosciences 41, 493–496. [DOI] [PubMed] [Google Scholar]
- Hughes EG, Kang SH, Fukaya M, and Bergles DE (2013). Oligodendrocyte progenitors balance growth with self-repulsion to achieve homeostasis in the adult brain. Nat Neurosci 16, 668–676. [DOI] [PMC free article] [PubMed] [Google Scholar]
- Hughes EG, Orthmann-Murphy JL, Langseth AJ, and Bergles DE (2018). Myelin remodeling through experience-dependent oligodendrogenesis in the adult somatosensory cortex. Nat Neurosci. [DOI] [PMC free article] [PubMed] [Google Scholar]
- Hyrien O, Dietrich J, and Noble M (2010). Mathematical and experimental approaches to identify and predict the effects of chemotherapy on neuroglial precursors. Cancer Res 70, 10051–10059. [DOI] [PMC free article] [PubMed] [Google Scholar]
- Janova H, Arinrad S, Balmuth E, Mitjans M, Hertel J, Habes M, Bittner RA, Pan H, Goebbels S, Begemann M, et al. (2018). Microglia ablation alleviates myelin-associated catatonic signs in mice. The Journal of clinical investigation 128, 734–745. [DOI] [PMC free article] [PubMed] [Google Scholar]
- Lebel C, Gee M, Camicioli R, Wieler M, Martin W, and Beaulieu C (2012). Diffusion tensor imaging of white matter tract evolution over the lifespan. NeuroImage 60, 340–352. [DOI] [PubMed] [Google Scholar]
- Leger M, Quiedeville A, Bouet V, Haelewyn B, Boulouard M, Schumann-Bard P, and Freret T (2013). Object recognition test in mice. Nature protocols 8, 2531–2537. [DOI] [PubMed] [Google Scholar]
- Liddelow SA, Guttenplan KA, Clarke LE, Bennett FC, Bohlen CJ, Schirmer L, Bennett ML, Munch AE, Chung WS, Peterson TC, et al. (2017). Neurotoxic reactive astrocytes are induced by activated microglia. Nature 541, 481–487. [DOI] [PMC free article] [PubMed] [Google Scholar]
- Lin GL, Nagaraja S, Filbin MG, Suva ML, Vogel H, and Monje M (2018). Non-inflammatory tumor microenvironment of diffuse intrinsic pontine glioma. Acta neuropathologica communications 6, 51. [DOI] [PMC free article] [PubMed] [Google Scholar]
- McKenzie IA, Ohayon D, Li H, de Faria JP, Emery B, Tohyama K, and Richardson WD (2014). Motor skill learning requires active central myelination. Science 346, 318–322. [DOI] [PMC free article] [PubMed] [Google Scholar]
- Miron VE, Boyd A, Zhao JW, Yuen TJ, Ruckh JM, Shadrach JL, van Wijngaarden P, Wagers AJ, Williams A, Franklin RJM, et al. (2013). M2 microglia and macrophages drive oligodendrocyte differentiation during CNS remyelination. Nat Neurosci 16, 1211–1218. [DOI] [PMC free article] [PubMed] [Google Scholar]
- Miron VE, Kuhlmann T, and Antel JP (2011). Cells of the oligodendroglial lineage, myelination, and remyelination. Biochimica et biophysica acta 1812, 184–193. [DOI] [PubMed] [Google Scholar]
- Mitew S, Gobius I, Fenlon LR, McDougall SJ, Hawkes D, Xing YL, Bujalka H, Gundlach AL, Richards LJ, Kilpatrick TJ, et al. (2018). Pharmacogenetic stimulation of neuronal activity increases myelination in an axon-specific manner. Nature communications 9, 306. [DOI] [PMC free article] [PubMed] [Google Scholar]
- Monje M, Mitra SS, Freret ME, Raveh TB, Kim J, Masek M, Attema JL, Li G, Haddix T, Edwards MS, et al. (2011). Hedgehog-responsive candidate cell of origin for diffuse intrinsic pontine glioma. Proceedings of the National Academy of Sciences of the United States of America 108, 4453–4458. [DOI] [PMC free article] [PubMed] [Google Scholar]
- Monje ML, Mizumatsu S, Fike JR, and Palmer TD (2002). Irradiation induces neural precursor-cell dysfunction. Nat Med 8, 955–962. [DOI] [PubMed] [Google Scholar]
- Monje ML, Toda H, and Palmer TD (2003). Inflammatory blockade restores adult hippocampal neurogenesis. Science 302, 1760–1765. [DOI] [PubMed] [Google Scholar]
- Monje ML, Vogel H, Masek M, Ligon KL, Fisher PG, and Palmer TD (2007). Impaired human hippocampal neurogenesis after treatment for central nervous system malignancies. Ann Neurol 62, 515–520. [DOI] [PubMed] [Google Scholar]
- Moore BD 3rd, Copeland DR, Ried H, and Levy B (1992). Neurophysiological basis of cognitive deficits in long-term survivors of childhood cancer. Archives of neurology 49, 809–817. [DOI] [PubMed] [Google Scholar]
- Morioka S, Morimoto M, Yamada K, Hasegawa T, Morita T, Moroto M, Isoda K, Chiyonobu T, Imamura T, Nishimura A, et al. (2013). Effects of chemotherapy on the brain in childhood: diffusion tensor imaging of subtle white matter damage. Neuroradiology 55, 1251–1257. [DOI] [PubMed] [Google Scholar]
- Morris GM, Hopewell JW, and Morris AD (1995). A comparison of the effects of methotrexate and misonidazole on the germinal cells of the subependymal plate of the rat. Br J Radiol 68, 406–412. [DOI] [PubMed] [Google Scholar]
- Mount CW, and Monje M (2017). Wrapped to Adapt: Experience-Dependent Myelination. Neuron 95, 743–756. [DOI] [PMC free article] [PubMed] [Google Scholar]
- Parent JM, Tada E, Fike JR, and Lowenstein DH (1999). Inhibition of dentate granule cell neurogenesis with brain irradiation does not prevent seizure-induced mossy fiber synaptic reorganization in the rat. The Journal of neuroscience : the official journal of the Society for Neuroscience 19, 4508–4519. [DOI] [PMC free article] [PubMed] [Google Scholar]
- Pierson C, Waite E, and Pyykkonen B (2016). A meta-analysis of the neuropsychological effects of chemotherapy in the treatment of childhood cancer. Pediatric blood & cancer 63, 1998–2003. [DOI] [PubMed] [Google Scholar]
- Pyonteck SM, Akkari L, Schuhmacher AJ, Bowman RL, Sevenich L, Quail DF, Olson OC, Quick ML, Huse JT, Teijeiro V, et al. (2013). CSF-1R inhibition alters macrophage polarization and blocks glioma progression. Nat Med 19, 1264–1272. [DOI] [PMC free article] [PubMed] [Google Scholar]
- Quail DF, Bowman RL, Akkari L, Quick ML, Schuhmacher AJ, Huse JT, Holland EC, Sutton JC, and Joyce JA (2016). The tumor microenvironment underlies acquired resistance to CSF-1R inhibition in gliomas. Science 352, aad3018. [DOI] [PMC free article] [PubMed] [Google Scholar]
- Robinson GW, Rudneva VA, Buchhalter I, Billups CA, Waszak SM, Smith KS, Bowers DC, Bendel A, Fisher PG, Partap S, et al. (2018). Risk-adapted therapy for young children with medulloblastoma (SJYC07): therapeutic and molecular outcomes from a multicentre, phase 2 trial. The Lancet Oncology 19, 768–784. [DOI] [PMC free article] [PubMed] [Google Scholar]
- Schafer DP, Lehrman EK, Kautzman AG, Koyama R, Mardinly AR, Yamasaki R, Ransohoff RM, Greenberg ME, Barres BA, and Stevens B (2012). Microglia sculpt postnatal neural circuits in an activity and complement-dependent manner. Neuron 74, 691–705. [DOI] [PMC free article] [PubMed] [Google Scholar]
- Seigers R, Schagen SB, Coppens CM, van der Most PJ, van Dam FS, Koolhaas JM, and Buwalda B (2009). Methotrexate decreases hippocampal cell proliferation and induces memory deficits in rats. Behavioural brain research 201, 279–284. [DOI] [PubMed] [Google Scholar]
- Seigers R, Timmermans J, van der Horn HJ, de Vries EF, Dierckx RA, Visser L, Schagen SB, van Dam FS, Koolhaas JM, and Buwalda B (2010). Methotrexate reduces hippocampal blood vessel density and activates microglia in rats but does not elevate central cytokine release. Behavioural brain research 207, 265–272. [DOI] [PubMed] [Google Scholar]
- Simons M, and Nave KA (2015). Oligodendrocytes: Myelination and Axonal Support. Cold Spring Harbor perspectives in biology 8, a020479. [DOI] [PMC free article] [PubMed] [Google Scholar]
- Tripathi RB, Jackiewicz M, McKenzie IA, Kougioumtzidou E, Grist M, and Richardson WD (2017). Remarkable Stability of Myelinating Oligodendrocytes in Mice. Cell reports 21, 316–323. [DOI] [PMC free article] [PubMed] [Google Scholar]
- Vigano F, Mobius W, Gotz M, and Dimou L (2013). Transplantation reveals regional differences in oligodendrocyte differentiation in the adult brain. Nat Neurosci 16, 1370–1372.23995069 [Google Scholar]
- Wefel JS, and Schagen SB (2012). Chemotherapy-related cognitive dysfunction. Current neurology and neuroscience reports 12, 267–275. [DOI] [PubMed] [Google Scholar]
- Winocur G, Vardy J, Binns MA, Kerr L, and Tannock I (2006). The effects of the anti-cancer drugs, methotrexate and 5-fluorouracil, on cognitive function in mice. Pharmacology, biochemistry, and behavior 85, 66–75. [DOI] [PubMed] [Google Scholar]
- Xiao L, Ohayon D, McKenzie IA, Sinclair-Wilson A, Wright JL, Fudge AD, Emery B, Li H, and Richardson WD (2016). Rapid production of new oligodendrocytes is required in the earliest stages of motor-skill learning. Nat Neurosci 19, 1210–1217. [DOI] [PMC free article] [PubMed] [Google Scholar]
- Yakovlev P (1967). The myelogenetic cycles of regional maturation of the brain in Minkowski A (ed): Regional Development of the Brain in Early Life Oxford, Blackwell Scientific Publications, 3– 70. [Google Scholar]
- Yang Y, Vidensky S, Jin L, Jie C, Lorenzini I, Frankl M, and Rothstein JD (2011). Molecular comparison of GLT1+ and ALDH1L1+ astrocytes in vivo in astroglial reporter mice. Glia 59, 200–207. [DOI] [PMC free article] [PubMed] [Google Scholar]
- Zamanian JL, Xu L, Foo LC, Nouri N, Zhou L, Giffard RG, and Barres BA (2012). Genomic analysis of reactive astrogliosis. The Journal of neuroscience : the official journal of the Society for Neuroscience 32, 6391–6410. [DOI] [PMC free article] [PubMed] [Google Scholar]
- Zhou W, Kavelaars A, and Heijnen CJ (2016). Metformin Prevents Cisplatin-Induced Cognitive Impairment and Brain Damage in Mice. PloS one 11, e0151890. [DOI] [PMC free article] [PubMed] [Google Scholar]
- Zrzavy T, Hametner S, Wimmer I, Butovsky O, Weiner HL, and Lassmann H (2017). Loss of ‘homeostatic’ microglia and patterns of their activation in active multiple sclerosis. Brain : a journal of neurology 140, 1900–1913. [DOI] [PMC free article] [PubMed] [Google Scholar]
Associated Data
This section collects any data citations, data availability statements, or supplementary materials included in this article.
Supplementary Materials
Figure S1, Related to Figure 2:
A) Serum and tissue concentrations of methotrexate 30 min following a single 100 mg/kg i.p. dose of MTX using LC-MS/MS. Dots represent individual mice (n=5). The purple shaded region represents the range in serum concentrations detected in children following a single high-dose 6-hr infusion of MTX (Bratlid and Moe, 1978). Data shown as mean±SEM
B-F) MTX IC50 curves for various cells populations. Purple bars represent MTX concentrations achieved in the brain following a single 100 mg/kg i.p. injection of MTX. n=3 wells for each data point
B-C) PDGFRα+ cells were isolated from P6–8 mice using FACS and exposed to various MTX concentrations for 24 hrs (B) or 48 hrs (C). The 24-hr IC50 for mouse PDGFRα+ cells was 140.4 nM.
D-E) 48-hr MTX IC50 > 1 mM for patient-derived high-grade glioma cultures, pediatric cortical glioblastoma (SU-pcGBM, D) and diffuse intrinsic pontine glioma (SU-DIPG IV, E)
F) 48-hr MTX IC50 of neural precursor cells (NPC) derived from mouse brain is 12.4 nM
Figure S2, Related to Figure 2:
A) Low magnification photomicrographs of PDGFRα+ (green), Olig1+ (white), and CC1+ (red) cells in the corpus callosum of PBS or MTX mice. Scale bar=50 μm
B) Similar to white matter, MTX induces a decrease in PDGFRα+ OPCs (p=0.038; n=4/group) and concomitant increase in late PDGFRα+/Olig1+ cells (p=0.025; n=4/group) in the deep cortical grey matter of the premotor cortex without an increase in CC1+ mature oligodendrocytes (n=7/group; p=0.15).
C) Juvenile MTX treatment does not decrease the cell density of PDGFRα+ OPCs (p=0.68; n=4/group) or CC1+ mature oligodendrocytes (p=0.091; n=7/group) in the superficial grey matter but does increase late PDGFRα+/Olig1+ cell density (n=4/group; p=0.016).
D) MTX (n=7 mice) exposure decreases perinuclear Olig1+ cell density in the corpus callosum compared to PBS (n=8) treatment (p=0.0075).
E) Apoptotic cells as marked by cleaved caspase-3 with or without co-localization of PDGFRα, Olig1, or CC1 24 hrs following a single i.p. injection of MTX (n=7) or PBS (n=6) at P21 (p=0.0356)
F) Density of cleaved caspase-3+ cells in the corpus callosum 24 hrs following a single MTX injection at P21 (n=7) and four weeks following MTX (n=7) or PBS (n=8) injections at P21, 28, and 35 (MTX 24-hrs vs. MTX 4 wks; p=0.0048). No cleaved caspase-3 was detected in PDGFRa+ cells.
Data shown as mean±SEM, n.s. = p>0.05, * p<0.05, ** p<0.01 by unpaired two-tailed Student’s t-test or two-way ANOVA (E)
Figure S3, Related to Figure 3
A-B) High magnification photomicrographs (400X) of myelin basic protein (MBP; green) in the corpus callosum of PBS- (A) and MTX- (B) exposed mice at P63. Scale bar=20 μm
C) Average g-ratio of premotor circuit axons as they enter the cingulum of the corpus callosum in P63 PBS (0.7465±0.005; n=5) and MTX (0.8014±0.0079; n=8) exposed mice four weeks following treatment (p=0.0003)
D-E) Catwalk gait analysis was used to assess motor performance in mice at P63 following early life PBS or MTX exposure. MTX-exposed mice exhibit decreases in forepaw swing speed (D; p=0.0067) with no observed alterations to stride length (E; p=0.2986; n=9 mice PBS, n=6 mice MTX).
F) Anxiety following chemotherapy exposure was assessed using an open-field test at P63 (p=0.0082; n=12 mice PBS, n=10 mice MTX).
G) Average g-ratio of premotor circuit axons as they enter the cingulum of the corpus callosum in P203 PBS (0.7073±0.004; n=4) and MTX (0.7697±0.007; n=4) exposed mice 6 months following treatment (p=0.0003)
Data shown as mean±SEM, n.s. = p>0.05, ** p<0.01, *** p<0.001 by unpaired two-tailed Student’s t-test
Figure S4, Related to Figure 4:
Photomicrograph of cultured PDGFRα+ cells (green) sorted by FACS. Sort purity for PDGFRα+ cells is 98.03%, with very few Iba+ microglial cells (red). DAPI (blue); Scale bar=50 μm
Figure S5, Related to Figure 7:
A) Photomicrographs (400X) of CXCL10 puncta (green) on GLAST+ astrocytes (red) in PBS- and MTX-exposed mice with and without PLX5622; Scale bar=20 μm
B) Microglial depletion (PLX5622) rescues myelin deficits in mice exposed to juvenile MTX in small (<0.5μm; p<0.0001) and medium (0.5μm-1.0 μm; p=0.0084) caliber axons but not completely in large caliber axons (>1.0 μm; p=0.06) compared to MTXcontrol mice. PBS-control n=3 mice; MTX-control n=3 mice; PBS-PLX5622 n=5 mice; MTX-PLX5622 n=3 mice.
C) Average axon diameter in MTX and PBS mice with or without microglial depletion at P63
Data shown as mean±SEM, n.s. p>0.05, ** p<0.01, *** p<0.001 by two-way ANOVA with Tukey post-hoc testing