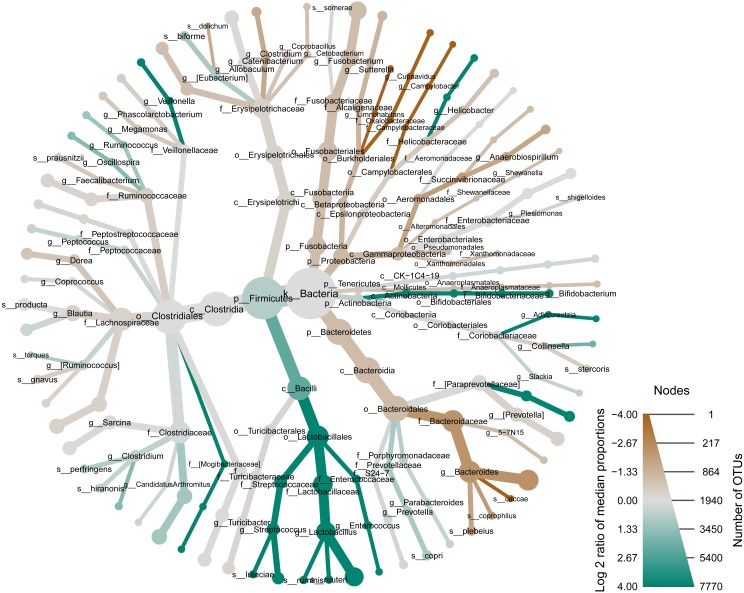
Figure 2. Many of the most relatively abundant phylotypes in our dog fecal samples are significantly different across aggressive and non-aggressive dogs.
A metacoder (Foster, Sharpton & Grünwald, 2017) heattree illustrates the variation in microbiome phylotypes between the aggressive and non-aggressive dog populations. Nodes in the heattree correspond to phylotypes, as indicated by node labels, while edges link phylotypes in accordance to the taxonomic hierarchy. Node sizes correspond to the number of OTUs observed within a given phylotype. Colors represent the log fold difference of a given phylotype’s median relative abundance in the aggressive dogs as compared to the non-aggressive dogs. Specifically, darker green represents higher relative abundance of aggressive OTUs and darker brown represents higher relative abundance of non-aggressive OTUs.

