

Abstract
Objective:
Limited evidence demonstrates pathways linking food insecurity (FI) to chronic disease. Allostatic load (AL) may elucidate potential pathways, capturing both primary (neuroendocrine, inflammation) and secondary (metabolic, cardiovascular) physiological disturbances. We examined the longitudinal association of FI with 5-year AL and primary and secondary subsystem dysregulation and tested moderation by Supplemental Nutrition Assistance Program (SNAP) participation.
Methods:
We analyzed data from the longitudinal Boston Puerto Rican Health Study among 733 adults aged 45 to 75 years. Participants categorized as food insecure (assessed by US survey module) experienced FI at baseline and/or year 5. AL score comprised 11 biological components (5 primary, 6 secondary). We classified participants as having high scores for AL (≥6 dysregulated components), primary system (≥3), and secondary system (≥4). Multivariate models estimated odds ratios (OR), adjusting for baseline AL, sociodemographic, cultural, and behavioral characteristics.
Results:
By study end, 33.8% had experienced FI, 65.5% had participated in SNAP, and 37.5% had high AL. In adjusted models, FI was not associated with AL (OR [95% confidence intervals] = 1.07 [0.70–1.64]) or secondary system (0.82 [0.48–1.40]) scores, but was associated with high primary system scores (1.71 [1.25–2.36]). SNAP participation seemed to moderate the FI-primary system relationship (p = .06); food-insecure participants never receiving SNAP (mean (SE) = 2.06 (0.14)) had higher scores than food-secure participants receiving (1.72 (0.06], p = .02) or never receiving SNAP (1.64 (0.10), p = .01) and food-insecure participants receiving SNAP (1.80 (0.07), p = .08).
Conclusions:
FI is associated with dysregulated components of the primary AL system, and this relationship may be stronger for those not receiving SNAP. Research is needed in additional populations to test AL as a plausible pathway connecting FI to chronic disease and SNAP as a moderator.
Keywords: allostatic load, food insecurity, Hispanic, Latino, Supplemental Nutrition Assistance Program
INTRODUCTION
Food insecurity (FI), or lack of persistent access to sufficient, healthy, and safe food (1), affects 13% of US households, yet low-income and ethnic minority populations experience FI disproportionally (2). FI risk is tightly linked to socioeconomic status, but individuals and households deficient in social support, physical capabilities, adequate food environments, or food management skills are also at risk (3). Older adults and low-income minority populations often encounter many of these vulnerabilities concurrently (4–7). Furthermore, potential consequences associated with FI, including poor mental health (8,9), chronic disease (10,11), and related risk factors (10,12,13), are also prevalent among older, minority adults (14,15).
Reducing FI may simultaneously contribute to reducing health disparities, especially in chronic disease. However, pathways linking FI to chronic disease have not been fully elucidated. Previous research with resource-poor families demonstrates that chronic economic hardships prompt households to make trade-offs between food security, necessary expenses, and health (16,17). As a result, these difficult choices increase stress, anxiety, and depression among adults heading the households (18,19). Framing FI as a stressor in the context of lower socioeconomic conditions (8,11,20) provides a potential biological pathway by which FI may influence chronic disease (11). Allostatic load (AL), or the cumulative physiological wear-and-tear on multiple bodily systems in response to multiple or repeated stressors (21), may serve as a potential mechanism for understanding this relationship between FI and chronic disease. Elevated AL shares similar risk factors with FI, including lower socioeconomic status (20–22) and minority race/ethnicity (22,23), and AL provides a whole-system approach to understanding health, in that the overload of coping with a stressor (e.g., FI) may manifest itself differently in various physiological systems (24,25).
Puerto Ricans living in the United States have documented socioeconomic (26,27) and health disadvantages (26–31). Previous research among older, minority participants from the longitudinal Boston Puerto Rican Health Study (BPRHS) reported that 12.1% were food insecure (30), 59% lived below the income-to-poverty ratio (29), and 58% had high AL (32). Separate analyses also found that among those with diabetes, 25% were food insecure (33). Studies in this cohort also document deleterious relationships between FI and intake of plant-based foods (33), cognitive function (30), and cognitive decline (31). In addition, higher AL scores were significantly associated with higher odds of abdominal obesity, diabetes, hypertension, self-reported cardiovascular disease, and arthritis (32). This cohort provides a unique opportunity to test the possible cumulative and longitudinal influence of FI on AL in an at-risk group and proposes a potential pathway in which FI is related to chronic disease. Identifying upstream (i.e., neuroendocrine and inflammatory) and downstream (i.e., metabolic and cardiovascular) factors contributing to elevated AL will help inform efforts to reduce racial/ethnic and socioeconomic health disparities.
We hypothesized that FI is a stressor that would trigger subsequent higher AL (at 5-year follow-up) primarily through mediating neuroendocrine and inflammatory biomarkers, given their shorter response time, among Puerto Rican older adults, independently from other socioeconomic, behavioral, and stress factors. Secondly, we tested two different moderators, diet quality, and participation in the Supplemental Nutrition Assistance Program (SNAP), on the relationship between FI and AL, because FI and diet quality may function independently and in concert to influence AL (34,35) and because participation in SNAP is associated with reduced psychological distress (36) and FI (37,38). A conceptual framework, based on the FI-chronic disease framework developed by Laraia et al. (2013) (11), demonstrates the hypothesized relationship between FI and AL (Figure 1 ), with neuroendocrine and inflammatory disturbances mediating metabolic and cardiovascular disturbances.
FIGURE 1.
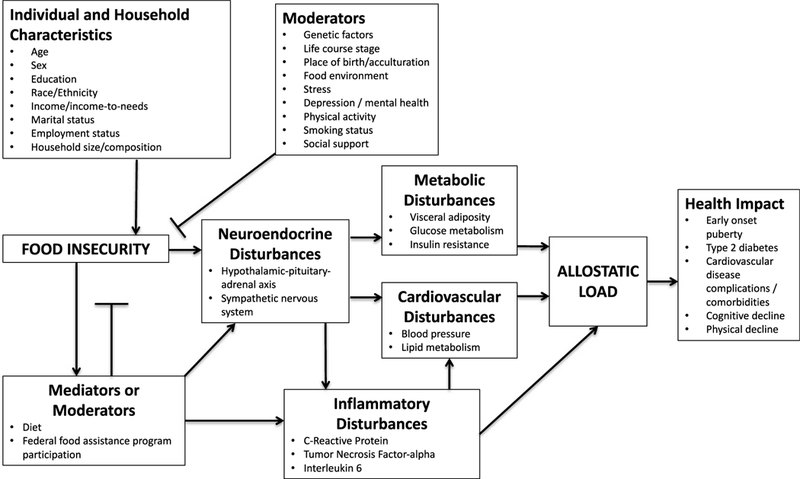
Conceptual model of potential pathways through which FI is associated with AL (adapted with permission from Laraia et al., 2013) (11). Primary markers include neuroendocrine and inflammatory disturbances, and secondary markers include metabolic and cardiovascular disturbances. The model is not inclusive of all possible AL biomarkers or systems, because AL is not defined consistently.
METHODS
Study Design and Data Collection
We analyzed data from the BPRHS, a longitudinal cohort study on psychosocial stress, AL, nutrition, and health outcomes. Visits occurred at three time points (baseline, 2-year, and 5-year) from 2004 to 2015. Recruitment and data collection methods are published in detail elsewhere (29). Eligible participants were self-identified Puerto Rican adults, aged 45 to 75 years, and able to respond to questions in either English or Spanish. Participant recruitment occurred in the Greater Boston area by door-to-door enumeration and through community outreach strategies. Participants consented to participation in writing. Trained, bilingual interviewers administered questionnaires and performed anthropometric and blood pressure measurements in the participant’s home, in duplicate, at the time of the interview. The average of the blood pressure readings was used as the final value. Questionnaires included demographics, language-based acculturation, FI, food assistance program participation, dietary intake, self-reported medically diagnosed conditions, medication use, perceived stress, physical activity, smoking, and alcohol use. Participants provided a 12-hour fasting blood sample and 12-hour urine collection. Blood samples were analyzed for plasma lipids (including high-density lipoprotein-cholesterol (HDL-C) and total cholesterol), C-reactive protein (CRP), glycated hemoglobin (HbA1c), and dehydroepiandrosterone sulfate (DHEA-S). Urine collections were analyzed for epinephrine, norepinephrine, and cortisol. Coefficients of variations for all biochemistry measures are listed in the Supplementary Table, Supplemental Digital Content 1, http://links.lww.com/PSYMED/A499. The institutional review boards at Tufts Medical Center and at Northeastern University approved the study.
Measures
Food Security
We used the United States Department of Agriculture 10-item adult food security survey module to assess food security, for the past 12 months, of the respondent and other adult household members. The 12-month scale was previously found to be reliable (range = 0.86–0.93) using Spearman- Brown split-half, Rulon’s split-half, and Cronbach’s a reliability estimates (39). The adult module is appropriate for an older adult population as, compared with the 18-item household module, the 10-item adult module reduces participant burden, provides comparisons across households with and without children and does not directly assess child food security, a sensitive topic. Affirmative responses are summed to create a food security score that corresponds with one of the following four categories of food security among adults: high, marginal, low, and very low (40). To maximize sample size, and following previous studies assessing FI and health outcomes (12), high and marginal food security were combined into a single food-secure category (score = 0–2), and low and very low food security were collapsed into a single food-insecure category (score = 3–10). The module was administered at baseline and 5-year follow-up, each time assessing FI for the past 12 months. Because FI is episodic (41), an individual may experience FI at one measurement point but not at another. To ensure correct categorization that captures the influence offood-secure versus food-insecure experiences on AL, we created a dichotomous variable to classify participants as having never experienced FI or as having experienced FI at least once.
Allostatic Load
The outcome variable was a composite score of AL at 5-year follow-up, calculated from 11 biological components representing five different physiological systems. For the primary system (neuroendocrine and inflammatory), components included serum DHEA-S and urinary cortisol (hypothalamus-pituitary-adrenal (HPA) axis), urinary epinephrine and norepinephrine (sympathetic nervous system [SNS]), and serum CRP (inflammation). For the secondary system (metabolic and cardiovascular), components included waist circumference and HbA1c (metabolic), blood pressure, HDL-C, and total cholesterol (cardiovascular). Each component had a clinically defined cutoff point, except for primary system markers, for which previously defined quartile and high-risk cutoffs were used (32,42–45). Cutoffs were the following: DHEA-S (≥589.5 ng/ml for men and ≥368.5 μg/ml for women), cortisol (≥41.5 μg/g creatine for men and ≥49.5 μg/g creatine for women), epinephrine (≥2.8 μg/g creatine for men and ≥3.6 μg/g creatine for women), norepinephrine (≥30.5 μg/g creatine for men and ≥46.9 μg/g creatine for women), CRP (>3 mg/L), waist circumference (>102 cm for men and >88 cm for women), HbA1c (>7%), systolic blood pressure (>140 mm Hg), diastolic blood pressure (>90 mm Hg), total cholesterol (≥240 mg/dl), and HDL-C (<40 mg/dl). A point was assigned for each component exceeding the cutoff point. For components within normal range but only in the presence of medication use for diabetes, hypertension, hyperlipidemia, or testosterone, a point was assigned for the respective parameter, to account for healthy values artificially maintained. Points were summed across the 11 systems to calculate the composite AL score, with scores ranging from 0 to 11. AL is reported as a dichotomous variable, with high AL (≥6 dysregulated components) based on the uppermost category of parameters associated with chronic disease (32). An additional high AL category was assessed (≥4 dysregulated components) based on the population median and documented associations with dietary patterns (42), but no significant differences were found by FI. Because AL reflects cumulative dysregulation and the 5-year study timeline may be a narrow window of exposure to follow-up, we evaluated the two AL subsystems (primary neuroendocrine and inflammatory biomarkers versus secondary cardiometabolic responses). Dichotomous variables were also defined for high primary system (≥3 dysregulated components) and secondary system (≥4 dysregulated components) scores. Significant (p < .01) age- and sex-adjusted Pearson correlation coefficients for individual AL biomarkers included the following: DHEA-S and cortisol (r = 0.11), cortisol and epinephrine (r = 0.22), cortisol and norepinephrine (r = 0.20), epinephrine and norepinephrine (r = 0.32), epinephrine and waist circumference (r = −0.10), epinephrine and HbAlc (r = −0.11), CRP and waist circumference (r = 0.24), CRP and HbA1c (r = 0.19), CRP and HDL-C (r = −0.16), waist circumference and HbA1c (r = 0.19), waist circumference and HDL-C (r = −0.12), waist circumference and total cholesterol (r = −0.15), HbA1c and systolic blood pressure (r = 0.12), HbA1c and HDL-C (r = −0.16), systolic blood pressure and diastolic blood pressure (r = 0.58), and HDL-C and total cholesterol (r = 0.35).
Covariates
Demographic data included age, sex, household income, household composition, and employment status. Income-to-poverty ratio was calculated by dividing total household income from all sources by the household’s appropriate federal poverty threshold, a measure of need that accounts for minimum food costs, household size and composition, and the age of the household head (46). For language-based acculturation, a modified 17- item questionnaire assessed use of English (versus Spanish) language during different daily activities, where higher scores indicated greater language acculturation (more use of English) (47,48). The Perceived Stress Scale (PSS) measured the level at which participants regarded their lives as stressful (49). Higher scores are indicative of higher perceived stress. Dietary assessment was conducted using a semiquantitative food-frequency questionnaire adapted and validated for this population (50). A Healthy Eating Index-2005 (HEI-2005) score was defined as a 12-component measure of overall diet quality relative to the Dietary Guidelines for Americans, with overall scores ranging from 0 to 100, and high scores indicative ofbet- ter diet quality (51). A modified Paffenbarger questionnaire was used to assess physical activity. A physical activity score was defined as the sum of hours spent in typical activities for a 24-hour period, multiplied by appropriate weighting factors associated with activity intensity/oxygen consumption (52). Season of the interview was categorized as winter, spring, summer, or fall. Participants were asked about receiving food assistance from SNAP. To capture SNAP participation across time, a dichotomous variable categorized participants as having received SNAP at any point during one of the three study visits (ever versus never received SNAP).
Statistical Analysis
A total of 952 participants had complete food security data at baseline and at 5-year follow-up. Of these, 543 had complete AL data at all three time points, and 188 had complete AL data at baseline and 2-year but not 5-year follow-up. The 188 participants with incomplete data at year 5 were missing only a few component measures: blood pressure (n = 12), waist circumference (n = 83), cholesterol (n = 56), HbA1c (n = 62), cortisol (n = 59), epinephrine (n = 62), norepinephrine (n = 56), DHEA-S (n = 65), and CRP (n = 65). Thus, we imputed missing year 5 values for AL using the R package multivariate imputation by chained equations with fully conditional specification (53). Multivariate imputation by chained equation techniques only uses information related to data missingness and not associations between variables (54) yet produces more precise estimates because it yields a larger sample size (55). The final analysis included a total of733 participants. Participants not included in the analysis had been in the US longer and had higher language acculturation, lower secondary AL system scores, and lower HEI-2005 scores (see Supplementary Table, Supplemental Digital Content 2, http://links.lww.com/PSYMED/A500).
Bivariate analyses, using t tests for continuous variables and χ2 (or Fisher exact test when appropriate) for categorical variables, were conducted to determine differences in baseline characteristics by food security status and by low versus high AL category (baseline and 5-year). Multilevel logistic regression models were used to test the association of experiencing FI one or more times with odds of high AL, primary AL system, and secondary AL system score at year 5. Model 1 adjusted for time increments between visits. Model 2 adjusted for time, baseline AL (or primary or secondary AL), and the baseline characteristics of age, sex, income-to-poverty ratio, employment status, language acculturation, HEI-2005 score, physical activity score, smoking status, season of interview, and PSS. Because we hypothesized that participation in SNAP would play a protective role in the relationship between FI and AL, model 4 included an interaction of FI with the SNAP variable. We also tested an interaction between FI and HEI-2005, similar to a previous analysis among those with diabetes in the cohort with HbA1c as the outcome (33). Models with the interaction term used continuous AL scores for ease of interpretation. Analyses were conducted in SAS v9.4 (SAS Institute Inc, Cary, NC) with significance levels set at p < .05 for main effects and p < .1 for interaction terms.
RESULTS
Sample Description
Among the final analytical sample, 33.8% (n = 248) ofparticipants were classified as food insecure (experiencing FI at least once in the 12 months preceding baseline or year 5 assessments) and 65.5% (n = 480) had received SNAP at least once, 16.2% (n = 119) had never received SNAP, and 18.3% (n = 134) had missing SNAP data. Approximately one-quarter (25.8%, n = 189) of participants were classified as food insecure at baseline. Food-insecure participants were younger and more likely to be female, unemployed, current smokers, and to receive SNAP, relative to food-secure participants. They also had lower incomes relative to the poverty thresholds and lower secondary AL scores, but higher mean PSS (Table 1). Participants with high AL (≥6) at baseline (27.7%) were older and more likely to be male, to have been born in the US and to have a lower mean physical activity score (Table 2). Participants with high AL at year 5 (37.5%) had similar characteristics to those at baseline, except that there was no difference by sex or place of birth (Table 2). Statistically significant unadjusted correlations between the food security score as a continuous variable and each AL parameter at baseline, as well as the change in each AL parameter from baseline to 5-year follow-up, included baseline systolic blood pressure (r = −0.11, p = .002) and change in norepinephrine (r = −0.07, p = .048) (see Supplementary Table, Supplemental Digital Content 3, http://links.lww.com/PSYMED/A501).
TABLE 1.
Baseline Sociodemographic Characteristics for Food-Secure Versus Food-Insecure Participants in the BPRHS
| Food Secure (n = 485) |
Food Insecurea (n = 248) |
||
|---|---|---|---|
| n (%) or M ± SD | n (%) or M ± SD | p | |
| Age | 57.3 ± 7.4 | 55.9 ± 7.2 | .02 |
| Female | 333 (68.7) | 190(76.6) | .02 |
| Income-to-poverty ratio | 137 ± 131 | 104 ± 71 | <.001 |
| ≤8th grade educational attainment | 221 (45.7) | 122 (49.2) | .36 |
| Currently employed | 102 (21.0) | 30(12.1) | .003 |
| Household size | 2.2 ± 1.3 | 2.4 ± 1.5 | .08 |
| SNAP participation | 140 (30.8) | 107 (45.0) | .0002 |
| Born outside continental US | 471 (97.1) | 242 (97.6) | .71 |
| Years living in US | 33.7 ± 11.6 | 33.3 ± 12.1 | .69 |
| Language acculturation scoreb | 22.6 ±21.7 | 24.3 ± 22.1 | .30 |
| Perceived stress scorec | 21.9 ± 9.3 | 27.3 ± 7.8 | <.001 |
| Smoking status | |||
| Never | 236 (48.7) | 106(42.9) | |
| Former | 151 (31.3) | 64 (25.5) | .003 |
| Current | 98(20.1) | 78(31.6) | |
| Alcohol intake status | |||
| Never | 131 (27.2) | 84 (34.0) | .15 |
| Former | 146 (30.4) | 72 (28.7) | |
| Current | 205 (42.4) | 92 (37.3) | |
| Physical activity scored | 31.6 ±4.4 | 31.4 ±4.7 | .50 |
| HEI-2005 scoree | 72.2 ± 9.7 | 71.2 ± 9.3 | .19 |
| Body mass index, kg/m2 | 31.7 ± 6.0 | 32.3 ± 6.3 | .20 |
| Season of interview | |||
| Winter | 94(19.4) | 46(18.6) | .37 |
| Spring | 114(23.5) | 59 (23.8) | |
| Summer | 170 (35.1) | 75 (30.2) | |
| Fall | 107 (22.1) | 68 (27.4) | |
| AL mean | 4.4 ± 1.8 | 4.2 ± 1.9 | .17 |
| High AL (≥6) | 137 (28.3) | 66 (26.6) | .64 |
| Primary AL system | 1.5 ± 1.0 | 1.5 ± 1.1 | .74 |
| High primary AL (>2) | 76(15.7) | 59 (23.8) | .01 |
| Secondary AL system | 2.9 ± 1.4 | 2.6 ± 1.4 | .04 |
| High secondary AL (>3) | 183 (37.7) | 79 (31.9) | .12 |
SNAP = Supplemental Nutrition Assistance Program; US = United States; HEI-2005 = Healthy Eating Index-2005; AL = allostatic load.
Analyses included t tests for continuous variables (mean ± SD) and χ2 (or Fisher exact test when appropriate) for categorical variables (%).
FI at least once at baseline or 5-year follow-up using the United States Department of Agriculture 10-item adult food security survey module.
Higher scores on the language acculturation assessment (range = 0–100) indicated greater acculturation (more use of English).
Higher scores on the PSS (range = 0–40) indicated higher perceived stress in life.
Physical activity scores were a sum of reported hours spent in typical activities over a 24-hour period, multiplied by appropriate weighting factors associated with activity intensity/oxygen consumption. Higher scores indicate greater level of physical activity.
The HEI-2005 score was a 12-component measure of overall diet quality relative to the Dietary Guidelines for Americans, and higher scores indicated better diet quality (range = 0–100).
TABLE 2.
Basel ine Sociodemographic Characteristics by AL Categorya at Baseline and at Year 5
| Baseline |
Year 5 |
|||||
|---|---|---|---|---|---|---|
| Low AL (<6) (n = 530) | High AL (≥6) (n = 203) | p | Low AL (<6) (n = 458) | High AL (≥6) (n = 275) | p | |
| Age, y | 56.5 (7.2) | 57.7 (7.6) | .04 | 56.2 (7.2) | 57.8 (7.5) | .004 |
| Women | 73.4 | 66.0 | .048 | 72.5 | 69.5 | .38 |
| Income-to-poverty ratio | 125 (118) | 128(109) | .77 | 125 (119) | 126 (110) | .94 |
| ≤8th grade educational attainment | 47.5 | 45.3 | .61 | 48.5 | 44.2 | .26 |
| Currently employed | 19.6 | 13.8 | .07 | 20.5 | 13.8 | .02 |
| Born outside continental US | 98.3 | 94.6 | .01 | 96.9 | 97.8 | .64 |
| Household size | 2.3 (1.4) | 2.2 (1.4) | .17 | 2.3 (1.4) | 2.3 (1.5) | .78 |
| Years living in US | 33.4 (11.5) | 34.2 (12.4) | .40 | 33.2 (11.6) | 34.2 (12.0) | .29 |
| Language acculturation scoreb | 23.4 (21.5) | 22.6 (22.5) | .67 | 23.2 (21.7) | 23.1 (22.0) | .96 |
| SNAP participation | 35.2 | 36.7 | .71 | 35.4 | 36.0 | .88 |
| Smoking status | ||||||
| Never | 47.7 | 43.8 | 47.8 | 44.7 | ||
| Former | 28.7 | 31.0 | .64 | 27.7 | 32.0 | .47 |
| Current | 23.6 | 25.1 | 24.5 | 23.3 | ||
| Alcohol intake status | ||||||
| Never | 30.4 | 27.1 | 30.5 | 27.7 | ||
| Former | 28.1 | 34.5 | .24 | 26.8 | 35.0 | .06 |
| Current | 41.6 | 38.4 | 42.8 | 37.2 | ||
| Perceived stress scorec | 23.7 (9.3) | 23.7 (8.9) | .98 | 23.7 (9.5) | 23.8 (8.7) | .96 |
| Food insecured | 34.3 | 32.5 | .64 | 32.5 | 36.0 | .34 |
| Physical activity scoree | 31.8 (4.8) | 30.8(3.6) | .004 | 31.8(4.7) | 31.1 (4.1) | .03 |
| Total HEI-2005 scoref | 71.8 (10.0) | 72.0 (8.5) | .86 | 71.3 (10.1) | 72.5 (8.8) | .085 |
US = United States; SNAP = Supplemental Nutrition Assistance Program; HEI-2005 = Healthy Eating Index-2005; AL = allostatic load.
Analyses included t tests for continuous variables (M (SD)) and χ2 (or Fisher exact test when appropriate) for categorical variables (%).
Low AL defined as <4 dysregulated systems. High AL defined as ≥4 dysregulated systems. Definition included clinical cutoffs and medication usage.
Higher scores on the language acculturation assessment (range = 0–100) indicated greater acculturation (more use of English).
Higher scores on the PSS (range = 0–40) indicated higher perceived stress in life.
FI at least once at baseline or 5-year follow-up using the United States Department of Agriculture 10-item adult food security survey module.
Physical activity scores were a sum of reported hours spent in typical activities over a 24-hour period, multiplied by appropriate weighting factors associated with activity intensity/oxygen consumption. Higher scores indicated greater level of physical activity.
The HEI-2005 was a 12-component measure of overall diet quality relative to the Dietary Guidelines for Americans, and higher scores indicated better diet quality (range = 0–100).
Multilevel Mixed Models
FI was not significantly associated with having high total AL (≥6 dysregulated components) at 5-year follow-up, in unadjusted or adjusted models (Table 3). FI was significantly associated with having three or more dysregulated primary AL system components in the model, adjusting for confounders (odds ratio [OR] [95% confidence intervals {CIs}] = 1.71 (1.25–2.36)). For individual AL components, FI was significantly associated with higher 5-year cortisol (p = .02) and waist circumference (p = .02) and lower 5-year systolic (p = .02) and diastolic (p = .03) blood pressure; no other individual AL markers were significantly different by FI status (see Supplementary Table, Supplemental Digital Content 4, http://links.lww.com/PSYMED/A502).
TABLE 3.
OR (95% CI) of Having Dysregulated AL or Primary or Secondary AL System at Year 5 for Food-Insecure, Compared with Food-Secure Participants
| Model 1a |
Model 2b |
|
|---|---|---|
| Food Insecure |
Food Insecure |
|
| OR (95% CI) | OR (95% CI) | |
| High AL (≥6)c | 1.07 (0.70–1.64) | 1.13 (0.73–1.74) |
| High primary AL system (≥3)d | 1.70(1.25–2.31) | 1.71 (1.25–2.36) |
| High secondary AL system (≥4)e | 0.82 (0.48–1.40) | 0.93 (0.54–1.62) |
AL = allostatic load; OR = odds ratio; CI = confidence interval.
Model 1: adjusted for time between waves/visits.
Model 2: adjusted for model 1 plus sex and baseline age, income-to-poverty ratio, being employed, language-based acculturation, HEI-2005, physical activity score, smoking status, season of interview, and perceived stress score.
High AL defined as ≥6 greater dysregulated systems. Low AL, the comparison group, defined as <6 dysregulated systems. Definition included clinical cutofs and medication usage.
High primary AL system defined as ≥3 dysregulated components. Low primary AL system defined as <3 dysregulated components.
High secondary AL system defined as ≥4 dysregulated components. Low secondary AL system defined as <4 dysregulated components.
Interaction Between FI and SNAP in Relation to AL Status
The interaction between FI and SNAP receipt on the association with AL primary system scores was statistically significant at p < .1 (p = .06). The FI-SNAP interactions for total AL (p = .28) and AL secondary system (p = .98) scores were not statistically significant. Being food insecure and never receiving SNAP (mean (SE) = 2.06 (0.14)) was associated with higher primary system AL scores compared with being food secure and never receiving SNAP (1.64 (0.10),p = .01), being food secure and receiving SNAP (1.72 (0.06), p = .02), or being food insecure and receiving SNAP (1.80 (0.07), p = .08) (Figure 2). No other groups differed significantly. For individual AL components, interactions were significant at p < .1 for epinephrine (p = .03) and systolic blood pressure (p = .099), but not for other individual AL markers (see Supplementary Table, Supplemental Digital Content 5, http://links.lww.com/PSYMED/A503). Epinephrine was significantly lower among food-secure participants never receiving SNAP than all other groups. Systolic blood pressure was significantly lower among food-insecure participants receiving SNAP than all other groups.
FIGURE 2.

Adjusted means (SE) for the moderation of the SNAPa on the association of FIb and AL score,c and primary and secondary AL system scores at year 5. Models adjusted for time between waves/visits, baseline age, sex, and baseline income-to-poverty ratio, being employed, language-based acculturation, Healthy Eating Index score, physical activity score, smoking status, season of interview, perceived stress score, SNAP participation, and the interaction between experiencing FI and ever participating in SNAP. Overall interaction p = .06. a Receipt of the SNAP defined as having reported receiving SNAP at least once at baseline, 2-year, or 5-year follow- ups. bFI was defined as reporting FI at least once at either baseline or 5-year follow-up using the United States Department of Agriculture 10-item adult food security survey module. cAL score was defined as a composite score from 11 biological components representing different physiological systems. For the primary AL system, these components included serum DHEA-S and urinary cortisol (HPA axis), urinary epinephrine and norepinephrine (sympathetic nervous system), and serum C-reactive protein (inflammation). For the secondary system, components included waist circumference and glycated hemoglobin (metabolic), and blood pressure, HDL-C, and total cholesterol (cardiovascular). Total AL score was a total score of both primary and secondary system dysregulation. Clinical cutoffs and medication usage were included in the definition. aSignificantly different (p < .05) from food secure - no SNAP. bSignificantly different (p < .05) from food secure - SNAP. cSignificantly different (p<.10) from food insecure – SNAP.
Interaction Between FI and HEI-2005 in Relation to AL Status
The interaction between FI and baseline HEI-2005 score was associated with total AL scores (p = .09), but not with AL primary system (p = .13) or AL secondary system (p = .25) scores. Compared with food-secure participants, each one-unit increase in HEI-2005 score was associated with 0.02 increase in total AL score among food-insecure participants.
DISCUSSION
Our findings indicate that FI is associated with dysregulated components of the primary AL systems, and the association may be stronger for those experiencing FI and not participating in SNAP. Primary AL scores for both food-secure and food-insecure participants receiving SNAP did not differ from the least vulnerable group, food-secure participants not receiving SNAP. FI was not associated with dysregulation of overall or secondary AL systems in this sample of Puerto Rican older adults.
Several studies have found associations between FI and dysregulation of secondary AL system markers or presence of clinical disease, including hypertension (12,56), low HDL (13), high low- density lipoprotein cholesterol (12), high HbA1c (12), and obesity in women (57,58). However, these analyses did not test potential pathways for dysregulation of overall secondary systems. We did not detect a significant association between FI and dysregulation of components in secondary AL systems, likely due to testing this pathway in an older adult population with existing chronic disease and disability at baseline (29,30,32), or to a short follow-up window between measurement of exposure and outcome. Our documented inverse relationship between FI and blood pressure may also be indicative of an older adult population, as previous studies demonstrating that a relationship between FI and hypertension primarily included adults older than 65 years (12,56). The significant relationship between FI and waist circumference is supported by previous findings linking FI to obesity, although these studies were with young adult women (57,58), and mean waist circumference for our participants was high, overall. More recent studies have demonstrated dysregulation of components of the primary AL system by documenting cross-sectional relationships between FI and inflammation (59,60), a relationship we did not find in our sample, although potential mechanisms in this pathway are not refined. Gowda et al. (59) posited that FI reduces adequate nutrient intake, compromising the body’s ability to cope with infection, increasing risk of inflammation, and subsequently making individuals more susceptible to chronic disease. That study documented partial mediation of the FI-CRP relationship by high white blood cell count, an immune response to infection (59), but it did not test adiposity (60) or diet (61) as potential mediators or moderators, emphasizing the need for additional research addressing the pathways connecting FI with inflammation. Our findings suggest that FI may be additionally associated with dysregulation of HPA axis and SNS markers, particularly through cortisol. Previous studies have documented an association between financial stress and cortisol (62,63), but using FI as the exposure is novel, highlighting the need for future research on FI and neuroendocrine markers.
The stress response and its impact on chronic disease are particularly salient in the context of FI, because FI may simultaneously produce a stress response (34,35,64) and poorly influence diet (33,65). Whether poor dietary choices are a response to perceived stress from being food insecure, limited availability of nutrient-dense foods, or some combination of the two is not well understood. Repeated, prolonged stress can dysregulate the HPA axis (20,24), one potential pathway through the HPA axis linking FI to chronic disease development (66). A second potential pathway, with the HPA axis as a mediator, assumes that poor food choices are a way to cope with the stress of FI. Both cross-sectional and longitudinal studies document an association between FI and disordered eating behaviors, mostly in women (65,67). Cortisol triggers the brain’s reward system under chronic stress and increases the desirability for highly palatable foods, high in energy, fat, and sugar, to assuage the stressor (34,64). Consumption of comfort foods may, in turn, promote visceral fat accumulation (35). However, households at risk of FI already have limited healthy food choices (18,68), potentially exacerbating this stress response within the context of a nutrient-poor food environment (69). We found that diet quality moderated the relationship between food security status and total AL scores but in the opposite direction than expected, with higher HEI-2005 scores among food-insecure participants associated with higher AL. Previous studies consistently found that food-insecure adults had lower intakes of fruit, vegetables, dairy, and some micronutrients (70), but less consistently supported the hypotheses that FI facilitates intake of highly palatable, energy-dense foods (11,70,71). Our findings suggest a nuanced relationship between FI and diet quality that may be better captured by accounting for the dynamic relationship between FI and diet quality and observing changes in specific diet quality components. Future studies in other populations should also consider other measures of diet quality and assessing diet quality as a potential mediator.
Our findings on the possible protective role of SNAP receipt against dysregulation of components of the primary AL system by FI add to a small evidence base connecting SNAP receipt to protective health outcomes. These studies showed that associations between FI and glucose control in adults with type 2 diabetes (72) and BMI in women (9,73) may have been mitigated by SNAP receipt and adequate SNAP benefit amount (9). Elucidating the role of SNAP in the relationship between FI and health is problematic because SNAP participants may be inherently different from eligible nonparticipants, potentially attributing to the differences we documented by SNAP receipt in our study. Likewise, cross-sectional analyses limit causal conclusions, particularly because those most at risk of FI are the ones more likely to (self-select) participate in SNAP (37). SNAP participation may also facilitate negative implications due to the stigma of receiving benefits or to the process of transitioning into the program versus uninterrupted participation (74). Because of our small sample size, we were unable to test moderation by continuity of SNAP receipt.
There are several notable strengths to this study. First, to the best of our knowledge, this analysis is the first to test the relationship between FI and AL, a potential pathway to understand the relationship between FI and chronic disease (11) and to recognize the role of mediating systems in disease development. Second, the longitudinal design of the study allowed us to model changes at both the individual (participant) and group (food secure versus food insecure) levels, providing sequential evidence of the relationship between FI and AL. We also tested our hypotheses in a vulnerable older population, serving as a model for population groups with similar disparities. This cohort had high AL at baseline, which may weaken the influence of FI compared with a sample with lower initial levels of dysregulation. Nonetheless, this would suggest that starting with a population that has lower AL at the outset may provide stronger associations between FI and AL than the ones we report. Results from these analyses warrant attention to the role FI may play in health disparities and how food assistance programs such as SNAP can potentially contribute to alleviating disparities. Notably, we defined AL components with standardized clinical cutoffs, allowing for crosscomparison with other studies, and with medication use that captured artificially regulated parameters. Lastly, we controlled for important socioeconomic, life-style, and psychosocial confounders, all measured with validated tools, to ensure that we made adequate inferences, although residual confounding is always possible.
Our study included some limitations. Although the United States Department of Agriculture food security module is the standard instrument for monitoring national FI trends (2,40), FI can be difficult to separate from the trade-offs that resource-poor households make with the expenses of other basic needs (16–18). However, stress and anxiety co-exist with chronic economic hardship, resulting in trade-offs to maintain food security and cover necessary expenses (18,19). The documented association in primary systems could be an acute stress response, although we observed stable values in AL biomarkers at all three time points. Longer exposure periods may be needed to detect changes in the secondary system. Finally, we did not account for early life FI experiences that may influence later life risk factors and disease development (75). However, AL serves as a predisease warning sign and way to document pathways for disease onset and progression and to identify contributing factors, such as FI, to target.
Supplementary Material
CONCLUSIONS AND IMPLICATIONS.
Our findings support considering FI as a stressor that may be associated with dysregulation of components of the primary AL system but that may be moderated by SNAP participation. Additional studies with at-risk populations are warranted to further develop our understanding of AL as a potential pathway linking FI to chronic disease, as well as the potential moderating role of SNAP, and moderating or mediating role of dietary quality. Future studies should also assess FI occurrences and severity in earlier life stages to assess influence on AL later in life, while also considering other early life stressors and adverse events that may confound this relationship. A more comprehensive consideration of FI coping strategies is also needed to understand how FI’s impact on health can be mitigated. In addition to formal coping strategies, such as SNAP receipt, future studies should consider community-based food assistance programs, food and resource management skills, and social networks (4,5). Although the relationship between low socioeconomic status and poor health outcomes is widely recognized (76), our findings reiterate the importance of identifying specific social determinants of psychobiological health in the context of poverty and marginalization.
Acknowledgments
The authors thank Dr. Renee Wurth for her help with multiple imputations.
Source of Funding The BPRHS was supported by the National Institutes of Health-National Institute on Aging (P01-AG023394) and by the United States Department of Agriculture, Agriculture Research Institute (58–1950-7–707). JM. received support for this study from a National Institutes of Health (NIH)-NHLBI Mentored Career Development Award to Promote Faculty Diversity (K01-HL120951). A.C.M. received support for this study from a NIH Ruth L. Kirschstein Institutional Training Grant Postdoctoral Fellowship (T32 DK 7703–23).
Glossary
- AL
allostatic load
- BPRHS
Boston Puerto Rican Health Study
- CRP
C-reactive protein
- DHEA-S
dehydroepiandrosterone sulfate
- FI
food insecurity
- HbA1c
glycated hemoglobin
- HEI- 2005
Healthy Eating Index-2005
- HDL-C
high-density lipoprotein-cholesterol
- HPA
hypothalamus-pituitary-adrenal
- PSS
Perceived Stress Scale
- SNAP
Supplemental Nutrition Assistance Program
- SNS
sympathetic nervous system
Footnotes
Conflicts of Interest:
The authors report no conflicts of interest.
Contributor Information
Amanda C. McClain, Department of Nutrition, T.H. Chan School of Public Health, Harvard University, Boston, Massachusetts.
Rui S. Xiao, Department of Nutrition, T.H. Chan School of Public Health, Harvard University, Boston, Massachusetts; PatientsLikeMe, Cambridge, Massachusetts.
Xiang Gao, Department of Nutritional Sciences, College of Health and Human Development,Pennsylvania State University, State College, Pennsylvania.
Katherine L. Tucker, Department of Biomedical and Nutritional Sciences, Humanities, and Social Sciences, University of Massachusetts, Lowell, Massachusetts..
Luis M. Falcon, College of Fine Arts, Humanities, and Social Sciences, University of Massachusetts, Lowell, Massachusetts..
Josiemer Mattei, Department of Nutrition, T.H. Chan School of Public Health, Harvard University, Boston, Massachusetts.
REFERENCES
- 1.Food and Agriculture Organization of the United Nations. Declaration of the World Summit on Food Security. Rome, Italy: FAO; 2009. [Google Scholar]
- 2.Coleman-Jensen A, Rabbitt MP, Gregory C, Singh A. Household Food Security in the United States in 2015. Economic Research Service 2016;41: Report No.: ERR 215. [Google Scholar]
- 3.Alaimo K Food insecurity in the United States: an overview. Top Clin Nutr 2005; 20:281–98. [Google Scholar]
- 4.Denney JT, Kimbro RT, Heck K, Cubbin C. Social cohesion and food insecurity: insights from the Geographic Research on Wellbeing (GROW) Study. Matern ChildHealth J 2016;1–8. [DOI] [PMC free article] [PubMed] [Google Scholar]
- 5.Dhokarh R, Himmelgreen DA, Peng Y-K, Segura-Perez S, Hromi-Fiedler A, Perez-Escamilla R. Food insecurity is associated with acculturation and social networks in Puerto Rican households. J Nutr Educ Behav 2011;43:288–94. [DOI] [PMC free article] [PubMed] [Google Scholar]
- 6.Goldberg SL, Mawn BE. Predictors of food insecurity among older adults in the United States. Public Health Nurs 2015;32:397–407. [DOI] [PubMed] [Google Scholar]
- 7.Income Levy H., poverty, and material hardship among older Americans. RSF 2015;1:55–77. [DOI] [PMC free article] [PubMed] [Google Scholar]
- 8.Laraia BA, Siega-Riz AM, Gundersen C, Dole N. Psychosocial factors and socioeconomic indicators are associated with household food insecurity among pregnant women. J Nutr 2006;136:177–82. [DOI] [PubMed] [Google Scholar]
- 9.Jilcott SB, Wall-Bassett ED, Burke SC, Moore JB. Associations between food insecurity, supplemental nutrition assistance program (SNAP) benefits, and body mass index among adult females. J Am Diet Assoc 2011;111:1741–5. [DOI] [PubMed] [Google Scholar]
- 10.Perez-Escamilla R, Villalpando S, Shamah-Levy T, Mendez-Gomez Humaran I. Household food insecurity, diabetes and hypertension among Mexican adults: results from Ensanut 2012. Salud Publica Mex 2014;56(suppl 1):s62–70. [DOI] [PubMed] [Google Scholar]
- 11.Laraia BA. Food insecurity and chronic disease. Adv Nutr 2013;4:203–12. [DOI] [PMC free article] [PubMed] [Google Scholar]
- 12.Seligman HK, Laraia BA, Kushel MB. Food insecurity is associated with chronic disease among low-income NHANES participants. J Nutr 2010;140:304–10. [DOI] [PMC free article] [PubMed] [Google Scholar]
- 13.Shin J-I, Bautista LE, Walsh MC, Malecki KC, Nieto FJ. Food insecurity and dys- lipidemia in a representative population-based sample in the US. Prev Med 2015; 77:186–90. [DOI] [PMC free article] [PubMed] [Google Scholar]
- 14.Balfour PC Jr, Ruiz JM, Talavera GA, Allison MA, Rodriguez CJ. Cardiovascular disease in Hispanics/Latinos in the United States. J Latina/o Psychol 2016;4: 98–113. [DOI] [PMC free article] [PubMed] [Google Scholar]
- 15.Anderson N, Bulatao R, Cohen B, editors. Racial and ethnic disparities in health and mortality In: Critical Perspectives on Racial and Ethnic Differences in Health in Late Life. Washington, DC: National Academies Press; 2004: (National Research Council (US) Panel on Race, Ethnicity, and Health in Later Life). [PubMed] [Google Scholar]
- 16.Olson CM. Food insecurity in women: a recipe for unhealthy trade-offs. Top Clin Nutr 2005;20:321–8. [Google Scholar]
- 17.Nord M, Kantor LS. Seasonal variation in food insecurity is associated with heating and cooling costs among low-income elderly Americans. J Nutr 2006; 136:2939–44. [DOI] [PubMed] [Google Scholar]
- 18.Hamelin AM, Beaudry M, Habicht JP. Characterization ofhousehold food insecurity in Québec: food and feelings. Soc Sci Med 2002;54:119–32. [DOI] [PubMed] [Google Scholar]
- 19.Knowles M, Rabinowich J, Ettinger de Cuba S, Cutts DB, Chilton M. “Do you wanna breathe or eat?”: parent perspectives on child health consequences of food insecurity, trade-offs, and toxic stress. Matern Child Health J 2016;20:25–32. [DOI] [PMC free article] [PubMed] [Google Scholar]
- 20.Seeman T, Epel E, Gruenewald T, Karlamangla A, McEwen BS. Socio-economic differentials in peripheral biology: cumulative allostatic load. Ann N YAcad Sci 2010;1186:223–39. [DOI] [PubMed] [Google Scholar]
- 21.Seeman TE, Crimmins E, Huang MH, Singer B, Bucur A, Gruenewald T, Berkman LF, Reuben DB. Cumulative biological risk and socio-economic differences in mortality: MacArthur studies ofsuccessful aging. Soc Sci Med 2004;58: 1985–97. [DOI] [PubMed] [Google Scholar]
- 22.Upchurch DM, Stein J, Greendale GA, Chyu L, Tseng C-H, Huang M- H, Lewis TT, Kravitz HM, Seeman T. A longitudinal investigation ofrace, socioeconomic status, and psychosocial mediators of allostatic load in midlife women: findings from the study of women’s health across the nation. Psychosom Med 2015;77: 402–12. [DOI] [PMC free article] [PubMed] [Google Scholar]
- 23.Geronimus AT, Hicken M, Keene D, Bound J. “Weathering” and age patterns of allostatic load scores among blacks and whites in the United States. Am J Public Health 2006;96:826–33. [DOI] [PMC free article] [PubMed] [Google Scholar]
- 24.McEwen BS. Protective and damaging effects ofstress mediators. New England J Med 1998; 2016;338:171–79. [DOI] [PubMed] [Google Scholar]
- 25.McEwen BS, Wingfield JC. The concept of allostasis in biology and biomedicine. Horm Behav 2003;43:2–15. [DOI] [PubMed] [Google Scholar]
- 26.Mattei J, Sotres-Alvarez D, Daviglus ML, Gallo LC, Gellman M, Hu FB, Tucker KL, Willett WC, Siega-Riz AM, Van Horn L, Kaplan RC. Diet quality and its association with cardiometabolic risk factors vary by Hispanic and Latino ethnic background in the Hispanic community health study/study of Latinos. J Nutr 2016;146:2035–44. [DOI] [PMC free article] [PubMed] [Google Scholar]
- 27.Daviglus ML, Talavera GA, Aviles-Santa ML, Allison M, Cai J, Criqui MH, Gellman M, Giachello AL, Gouskova N, Kaplan RC, LaVange L, Penedo F, Perreira K, Pirzada A, Schneiderman N, Wassertheil-Smoller S, Sorlie PD, Stamler J. Prevalence of major cardiovascular risk factors and cardiovascular diseases among Hispanic/Latino individuals of diverse backgrounds in the United States. JAMA 2012;308:1775–84. [DOI] [PMC free article] [PubMed] [Google Scholar]
- 28.Schneiderman N, Llabre M, Cowie CC, Barnhart J, Carnethon M, Gallo LC, Giachello AL, Heiss G, Kaplan RC, LaVange LM, Teng Y, Villa-Caballero L, Aviles-Santa ML. Prevalence ofdiabetes among Hispanics/Latinos from diverse backgrounds: the Hispanic Community Health Study/Study of Latinos (HCHS/ SOL). Diabetes Care 2014;37:2233–9. [DOI] [PMC free article] [PubMed] [Google Scholar]
- 29.Tucker KL, Mattei J, Noel SE, Collado BM, Mendez J, Nelson J, Griffith J, Ordovas JM, Falcon LM. The Boston Puerto Rican Health Study, a longitudinal cohort study on health disparities in Puerto Rican adults: challenges and opportunities. BMC Public Health 2010;10:1–12. [DOI] [PMC free article] [PubMed] [Google Scholar]
- 30.Gao X, Scott T, Falcon LM, Wilde PE, Tucker KL. Food insecurity and cognitive function in Puerto Rican adults. Am J Clin Nutr 2009;89:1197–203. [DOI] [PMC free article] [PubMed] [Google Scholar]
- 31.Wong JC, Scott T, Wilde P, Li YG, Tucker KL, Gao X. Food insecurity is associated with subsequent cognitive decline in the Boston Puerto Rican Health Study. J Nutr 2016;146:1740–5. [DOI] [PMC free article] [PubMed] [Google Scholar]
- 32.Mattei J, Demissie S, Falcon LM, Ordovas JM, Tucker K. Allostatic load is associated with chronic conditions in the Boston Puerto Rican Health Study. Soc Sci Med 2010;70:1988–96. [DOI] [PMC free article] [PubMed] [Google Scholar]
- 33.Berkowittz SA, Gao X, Tucker KL. Food-insecure dietary patterns are associated with poor longitudinal glycemic control in diabetes: results from the Boston Puerto Rican Health study. Diabetes Care 2014;37:2587–92. [DOI] [PMC free article] [PubMed] [Google Scholar]
- 34.Adam TC, Epel ES. Stress, eating and the reward system. Physiol Behav 2007; 91:449–58. [DOI] [PubMed] [Google Scholar]
- 35.Dallman MF, Pecoraro N, Akana SF, la Fleur SE, Gomez F, Houshyar H, Bell ME, Bhatnagar S, Laugero KD, Manalo S. Chronic stress and obesity: a new view of “comfort food.”. Proc National Acad Sci 2003;100:11696–701. [DOI] [PMC free article] [PubMed] [Google Scholar]
- 36.Oddo VM, Mabli J. Association ofparticipation in the supplemental nutrition assistance program and psychological distress. Am J Public Health 2015;105:e30–5. [DOI] [PMC free article] [PubMed] [Google Scholar]
- 37.Nord M, Golla AM. Does SNAP Decrease Food Insecurity? Untangling the Self¬selection Effect. Economic Research Service, U.S.: Department ofAgriculture; 2009: Report No.: 85. [Google Scholar]
- 38.Mabli J, Ohls J. Supplemental nutrition assistance program participation is associated with an increase in household food security in a national evaluation. J Nutr 2015;145:344–51. [DOI] [PubMed] [Google Scholar]
- 39.Hamilton WL, Cook JT, Thompson WW, Buron LF, Frongillo EA, Olson CM, Wehler CA. Household Food Security in the United States in 1995: Technical Report of the Food Security Measurement Project. USDA Food and Consumer Service: Alexandria, VA; 1997. [Google Scholar]
- 40.Economic Research Service, USDA. U.S. Adult Food Security Survey Module: Three-Stage Design, with Screeners. 2012. Available at: https://www.ers.usda.gov/media/8279/ad2012.pdf Accessed January 10, 2017.
- 41.Coleman-Jensen A, Rabbitt MP, Gregory C, Singh A. Household Food Security in the United States in 2014. United States Department ofAgriculture; 2015. [Google Scholar]
- 42.Mattei J, Noel SE, Tucker KL. A meat, processed meat, and French fries dietary pattern is associated with high allostatic load in Puerto Rican older adults. J Am Diet Assoc 2011;111:1498–506. [DOI] [PMC free article] [PubMed] [Google Scholar]
- 43.Trivedi DP, Khaw KT. Dehydroepiandrosterone sulfate and mortality in elderly men and women. J Clin Endocrinol Metab 2001;86:4171–7. [DOI] [PubMed] [Google Scholar]
- 44.Goldman N, Weinstein M, Cornman J, Singer B, Seeman T, Chang M. Sex differentials in biological risk factors for chronic disease: estimates from population- based surveys. J Women Health 2004;13:393–403. [DOI] [PubMed] [Google Scholar]
- 45.Pearson TA, Mensah GA, Alexander RW, Anderson JL, Cannon RO 3rd, Criqui M, Fadl YY, Fortmann SP, Hong Y, Myers GL, Rifai N, Smith SC Jr, Taubert K, Tracy RP, Vinicor F. Markers of inflammation and cardiovascular disease: application to clinical and public health practice: a statement for healthcare professionals from the Centers for Disease Control and Prevention and the American Heart Association. Circulation 2003;107:499. [DOI] [PubMed] [Google Scholar]
- 46.U.S. Census Bureau. How the Census Bureau Measures Poverty. U.S. Census Bureau 2016. Available at: https://www.census.gov/topics/income-poverty/poverty/guidance/poverty-measures.html. Accessed December 19, 2016.
- 47.Bermudez OI, Falcon LM, Tucker KL. Intake and food sources of macronutrients among older Hispanic adults: association with ethnicity, acculturation, and length of residence in the United States. J Am Diet Assoc 2000; 100:665–73. [DOI] [PubMed] [Google Scholar]
- 48.Lin H, Bermudez OI, Tucker KL. Dietary patterns ofHispanic elders are associated with acculturation and obesity. J Nutr 2003;133. [DOI] [PubMed] [Google Scholar]
- 49.Cohen S, Kamarck T, Mermelstein R. A global measure of perceived stress. J Health Soc Behav 1983;24:385–96. [PubMed] [Google Scholar]
- 50.Tucker KL, Bianchi LA, Maras J, Bermudez OI. Adaptation ofa food frequency questionnaire to assess diets of Puerto Rican and non-Hispanic adults. Am J Epidemiol 1998;148:507–18. [DOI] [PubMed] [Google Scholar]
- 51.Ye X, Scott T, Gao X, Maras JE, Bakun PJ, Tucker KL. Mediterranean diet, healthy eating index 2005, and cognitive function in middle-aged and older Puerto Rican adults. J Acad Nutr Diet 2013;113:276–281.e3. [DOI] [PMC free article] [PubMed] [Google Scholar]
- 52.Tucker KL, Bermudez OI, Castaneda C. Type 2 diabetes is prevalent and poorly controlled among Hispanic elders ofCaribbean origin. Am J Public Health 2000; 90:1288–93. [DOI] [PMC free article] [PubMed] [Google Scholar]
- 53.van Buuren S, Groothuis-Oudshoorn K. MICE: Multivariate Imputation by Chained Equations in R. Journal of Statistical Software; Vol 1, Issue 3 (2011). 2011; Available at: https://www.jstatsoft.org/v045/i03. Accessed March 26,2018. [Google Scholar]
- 54.Allison PD. Multiple imputation for missing data: a cautionary tale. Sociological Methods Res 2000;28:301–9. [Google Scholar]
- 55.Rubin DB, Schenker N. Multiple imputation in health-care databases: an overview and some applications. Stat Med 2006;10:585–98. [DOI] [PubMed] [Google Scholar]
- 56.Wang EA, McGinnis KA, Goulet J, Bryant K, Gibert C, Leaf DA, Mattocks K, Fiellin LE, Vogenthaler N, Justice AC, Fiellin DA; for the Veterans Aging Cohort Study Project Team. Food insecurity and health: data from the veterans aging cohort study. Public Health Rep 2015;130:261–8. [DOI] [PMC free article] [PubMed] [Google Scholar]
- 57.Dinour LM, Bergen D, Yeh M-C. The food insecurity-obesity paradox: a review of the literature and the role food stamps may play. J Am Diet Assoc 2007;107: 1952–61. [DOI] [PubMed] [Google Scholar]
- 58.Gooding HC, Walls CE, Richmond TK. Food insecurity and increased BMI in young adult women. Obesity (Silver Spring) 2012;20:1896–901. [DOI] [PMC free article] [PubMed] [Google Scholar]
- 59.Gowda C, Hadley C, Aiello AE. The association between food insecurity and in flammation in the US adult population. Am J Public Health 2012;102:1579–86. [DOI] [PMC free article] [PubMed] [Google Scholar]
- 60.Ford ES. Food security and cardiovascular disease risk among adults in the United States: findings from the National Health and Nutrition Examination Survey, 2003–2008. Prev Chron Dis 2013;10:E202. [DOI] [PMC free article] [PubMed] [Google Scholar]
- 61.Giugliano D, Ceriello A, Esposito K The effects of diet on inflammation: emphasis on the metabolic syndrome. J Am Coll Cardiol 2006;48:677–85. [DOI] [PubMed] [Google Scholar]
- 62.Grossi G, Perski A, Lundberg U, Soares J. Associations between financial strain and the diurnal salivary cortisol secretion of long-term unemployed individuals. Integr Physiol Behav Sci 2001;36:205–19. [DOI] [PubMed] [Google Scholar]
- 63.Gemes K, Ahnve S, Janszky I. Inflammation a possible link between economical stress and coronary heart disease. Eur J Epidemiol 2008;23:95–103. [DOI] [PubMed] [Google Scholar]
- 64.Yau YHC, Potenza MN. Stress and eating behaviors. Minerva Endocrinol 2013; 38:255–67. [PMC free article] [PubMed] [Google Scholar]
- 65.Kendall A, Olson CM, Frongillo EA Jr. Relationship of hunger and food insecurity to food availability and consumption. J Am Diet Assoc 1996;96: 1019–24. [DOI] [PubMed] [Google Scholar]
- 66.Rosmond R Role of stress in the pathogenesis of the metabolic syndrome. Psychoneuroendocrinology 2005;30:1–10. [DOI] [PubMed] [Google Scholar]
- 67.Laraia B, Vinikoor-Imler LC, Siega-Riz AM. Food insecurity during pregnancy leads to stress, disordered eating, and greater postpartum weight among overweight women. Obesity (Silver Spring, Md.) 2015;23:1303–11. [DOI] [PMC free article] [PubMed] [Google Scholar]
- 68.Kaiser LL, Melgar-Quinonez H, Townsend MS, Nicholson Y, Fujii ML, Martin AC, Lamp CL. Food insecurity and food supplies in Latino households with young children. J Nutr Educ Behav 2003;35:148–53. [DOI] [PubMed] [Google Scholar]
- 69.Seligman HK, Schillinger D. Hunger and socioeconomic disparities in chronic disease. New England J Med 2010; 363:6–9. [DOI] [PubMed] [Google Scholar]
- 70.Hanson KL, Connor LM. Food insecurity and dietary quality in US adults and children: a systematic review. Am J Clin Nutr 2014;100:684–92. [DOI] [PubMed] [Google Scholar]
- 71.Leung CW, Epel ES, Ritchie LD, Crawford PB, Laraia BA. Food insecurity is in versely associated with diet quality of lower-income adults. J Acad Nutr Diet 2014;114:1943–1953.e2. [DOI] [PubMed] [Google Scholar]
- 72.Mayer VL, McDonough K, Seligman H, Mitra N, Long JA. Food insecurity, coping strategies and glucose control in low-income patients with diabetes. Public Health Nutr2016;19:1103–11. [DOI] [PMC free article] [PubMed] [Google Scholar]
- 73.Karnik A, Foster BA, Mayer V, Pratomo V, McKee D, Maher S, Campos G, Anderson M. Food insecurity and obesity in New York City primary care clinics. Med Care 2011;49:658–61. [DOI] [PubMed] [Google Scholar]
- 74.Heflin CM, Ziliak JP. Food insufficiency, food stamp participation, and mental health*. Soc Sci Q 2008;89:706–27. [Google Scholar]
- 75.Kaiser LL, Townsend MS, Melgar-Quinonez HR, Fujii ML, Crawford PB. Choice of instrument influences relations between food insecurity and obesity in Latino women. Am J Clin Nutr 2004;80:1372–8. [DOI] [PubMed] [Google Scholar]
- 76.Marmot M, Friel S, Bell R, Houweling TA, Taylor S. Closing the gap in a generation: health equity through action on the social determinants of health. Lancet. 2008;372:1661–69. [DOI] [PubMed] [Google Scholar]
Associated Data
This section collects any data citations, data availability statements, or supplementary materials included in this article.