

Abstract
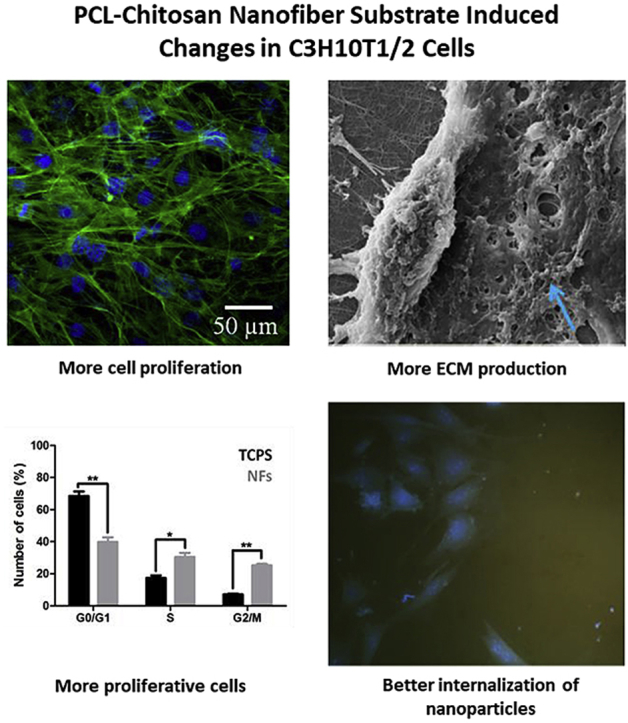
Biomimetic cell culture substrates are developed as an alternative to the conventional substrates. They provide necessary biochemical and biophysical cues to the cells from their surrounding environment for their optimal growth, behaviour and physiology. Changes in physiology of cells growing on biomimetic substrate can essentially affect results of in vitro biological experiments such as drug cytotoxicity, nanoparticle internalization or signalling pathways. As majority of ECM proteins are fibrous in nature, nanofibrous scaffolds have more biomimicking properties. Therefore, in this study, we developed ECM mimicking polycaprolactone-chitosan nanofiber substrate and evaluated its effect on cell morphology, proliferation, cell cycle and ECM production. Further, cellular uptake of BSA-AuNCs has been assessed on conventional and biomimetic substrate in order to demonstrate the effect of these events on cellular properties. It was observed that the cells that were grown for 15 days on the nanofibers, had majority of cells in the proliferative phase of cell cycle compared to TCPS. Moreover, these cells showed extensive collagen and fibronectin production. Due to these conditions C3H10T1/2 cells displayed higher cell internalization of BSA-AuNCs. Overall, this study indicates that the nano-topographical and biochemical environment could alter the cell proliferative behaviour and ECM production, which affects the cell internalization of BSA-AuNCs. Also, PCL-chitosan nanofibrous substrate could be a better alternative to TCPS for cell culture studies.
Keywords: Polycaprolactone-chitosan nanofibers, Biomimetic substrate, Cell cycle, ECM production, BSA-AuNCs internalization
Graphical abstract
Highlights
-
•
Development of polycaprolactone-chitosan biomimetic nanofibers with desired properties.
-
•
Nanofiber substrate influences cell growth, ECM production and cell cycle of C3H10T1/2 cells.
-
•
The substrate influenced changes lead to higher cellular internalization of BSA-gold nanoclusters.
1. Introduction
In vitro cell cultures are often used in biological studies in order to examine cellular responses and anticipate in vivo outcomes. Usually, cell physiological activities such as proliferation, migration, differentiation, signalling pathways are studied under specific chemical or physical influence. Most commonly practised method of cell culture is use of Petri plates, which haven't changed much since its invention in 1887. The use of Petri plates over more than a century has no doubt significantly advanced cellular research; however, recent studies demonstrate that due to their unrealistic simplicity, conventional 2D cell culture methods do not fully represent in vivo models, fail to provide necessary biomimetic environment to growing cells and therefore, in vitro results deviate from actual in vivo responses. To overcome these limitations, biomimetic cell culture substrates are being developed.
It is now known that cells need biochemical and biophysical cues from their surrounding environment for their optimal growth and behaviour [1]. Therefore, conventional and biomimetic culture systems have different influences on cell physiological events. We have previously demonstrated that pre-osteogenic cells, MC3T3-E1 completely change their morphology while growing on biomimetic nanofibers [2]. A study has reported that corneal endothelial cells demonstrated their original morphology, high proliferation rate and cell density on biomimetic substrate compared to TCPS [3]. In another study, cell cycle analysis performed on MDA MB231 breast cancer cells growing on TCPS and biomimetic polymeric gel showed significant differences in cell cycle stage dependent drug cytotoxicity. Thus, changes in physiology of cells growing on biomimetic substrate can essentially affect results of in vitro biological experiments such as drug cytotoxicity, nanoparticle internalization or signalling pathways. Overall, these studies demonstrate the effect of cell culture substrate on cellular morphology, proliferation, cell cycle and extracellular matrix (ECM) production. Hence, there is a need for an upgraded substrate with biomimetic properties that provide more realistic results.
In recent years, different types of biomimetic systems including microporous gels, micro/nanofibers and substrates with various chemistry and topography have been developed. The ideal substrate should be biocompatible, biodegradable and should support cell growth similar to in vivo microenvironment. Although microporous scaffolds have been successful for some specific applications, they are not true mimic of ECM structure, which affects cell binding. As majority of ECM proteins are fibrous in nature, nanofibrous scaffolds have more biomimicking properties. Nanofibers are particularly favourable because of their ease of fabrication, high surface area to volume ratio, variety in composition, controllable geometry and physicochemical properties, potential of bioactive molecules loading, controllable release and degradation kinetics. Many natural and synthetic polymers have been electrospun to form a three-dimensional ECM mimicking nanofibers. Some recent literature has promoted use of polycaprolactone (PCL) and chitosan (CHT) together in a nanofibrous scaffold due to mechanical strength, processability and biocompatibility of PCL and ECM mimicking properties of CHT [[4], [5], [6], [7], [8]].
In this study, we propose to develop a PCL-CHT nanofiber substrate which provides ECM mimicking properties to cells and to evaluate its effect on cell physiological events such as morphology, proliferation, cell cycle and ECM production. Further to demonstrate the effect of cellular events, cellular uptake of bovine serum albumin-gold nanoclusters (BSA-AuNCs) on conventional and PCL-CHT nanofiber substrate were performed.
2. Materials and methods
2.1. Materials
PCL (average Mn 80 kDa), CHT (<200 mPa), formic acid and acetic acid were purchased from Sigma Aldrich, USA and were used as received, without further purification. Gold (III) chloride trihydrate (HAuCl4·3H2O) was purchased from SD fine chemicals, India. C3H10T1/2 cells were procured from National Centre for Cell Science (NCCS), India and FBS was purchased from Gibco, USA. BSA, sodium hydroxide (NaOH) and all other cell culture reagents were purchased from HiMedia, India, unless specified otherwise.
2.2. Fabrication of PCL-CHT nanofibers
The nanofibers were fabricated by electrospinning process. The polymeric solution was prepared by mixing 14% PCL w/v and 2% CHT w/v in 3:1 formic acid:acetic acid solvent system. The mixture was kept on the magnetic stirrer till the homogeneous emulsion was formed. It was then filled in 1 mL syringe, fitted with 29G blunt ended needle. The solution was drawn from the syringe at a flow rate of 0.001 mL/min using a syringe pump and was spun at 12 cm distance between the needle and collector plate, under an electrical field of 25 kV potential. These processing parameters were standardised after few variations to obtain nanofibers of desired quality. The resulting nanofibers were collected on glass coverslips pre-adhered to aluminium foil which were then used for further analysis.
2.3. Morphological analysis of PCL-CHT nanofibers
Nanofiber morphology was studied using scanning electron microscope (SEM) (Leo). Briefly, randomly selected 2 mm*2 mm sized nanofiber samples from various batches of electrospinning were sputter coated with gold-palladium and then observed in SEM. Nanofiber diameter was measured using ImageJ software. 50 random fibers were measured in triplicate scanning electron micrographs.
2.4. Synthesis of BSA-gold nanoclusters (BSA-AuNCs)
Aqueous solution of HAuCl4 (5.0 mL, 10 mM) was mixed with BSA solution (5.0 mL, 50 mg/mL) under vigorous stirring at 37 °C for 2 min, followed by addition of NaOH solution (0.5 mL, 1 M). This reaction mixture was allowed to stir in dark for 12 h at 37 °C. Followed by incubation, the color of the mixture was changed from yellow to brown. Purification of AuNCs was performed by extensive dialysis using a 12.4 kDa M W. dialysis bag for 6 h to eliminate the unreduced gold ions and excess of NaOH. The obtained BSA-AuNCs were stored at 4 °C until further use. The weight of BSA-AuNCs was expressed in form of total dry weight, which was obtained by drying out a fixed volume of BSA-AuNCs suspension and expressed in mg/mL.
2.5. Characterization of BSA-AuNCs
The absorbance spectra of BSA-AuNCs was acquired using a UV–visible spectrophotometer (Synergy HT Biotek spectrophotometer, USA) in a quartz cuvette of 1.0 cm path length. The morphology of BSA-AuNCs (size and shape) was observed under TEM (transmission electron microscope) operating with a voltage of 120 kV (JEM1400 plus, JEOL). Zeta potential value of BSA-AuNCs was carried out using dynamic light scattering (Zetasizer Nano-Zs, ZEN3600 Malvern Instruments Ltd, UK) using a laser with wavelength of 633 nm. The Fourier Transform Infra-Red (FTIR) spectra of BSA-AuNCs was acquired using an FTIR Spectrometer (Perkin Elmer Spectrum-two, USA). The samples were mixed into KBr powder and dried out totally followed by spectra measurement in ATR mode between the 400–4000 cm−1 range under transmittance mode.
2.6. Cell culture and seeding
Mouse embryonic fibroblasts, C3H10T1/2 cell line which has mesenchymal stem cell properties were grown in basal medium Eagle (BME), supplemented with 10% heat inactivated FBS and 1% antibiotic-antimycotic solution mixture. For in vitro studies, cells were seeded on nanofibers deposited coverslips. Coverslips were first sterilized by immersing in 70% alcohol for 30 min, followed by multiple PBS washes to remove alcohol. Afterwards, they were UV sterilized for 30 min and were put in 24 well plate (Corning), precoated with 1% agarose to minimise cell adhesion. Cells were trypsinized using 1x trypsin EDTA solution and resuspended in a small volume of media. 40,000 cells were seeded gradually on each coverslip and allowed to attach on nanofibers for 2 h, after which media was added. Equal number of cells were seeded on TCPS for comparison. The cells were incubated at 37 °C and 5% CO2.
2.7. Morphological analysis of cells grown on nanofibers
For morphological study of cells grown on nanofibers, SEM and confocal microscopy were performed as described previously. Briefly, cells were fixed with 2% glutaraldehyde for 1 h and then treated with series of alcohol gradients for dehydration. The samples processed and observed under SEM (Leo). For confocal laser scanning microscopy (CSLM), cells were fixed with 2% paraformaldehyde and permeabilized with 0.1% triton X-100 for 15 min. Then, they were stained with Alexa fluor 488 Phalloidin for 20 min, washed with PBS and stained with 50 ng/mL DAPI solution for 7 min. Samples were repeatedly washed with PBS before air drying and mounting on a glass slide using antifading solution (Sigma). They were then proceeded with CSLM (Zeiss LSM780).
2.8. Cell proliferation assay
Cell proliferation was studied by Alamar blue assay, where conversion of oxidised, non-fluorescent, blue coloured Alamar blue to reduced, fluorescent, red coloured product indicates the cellular metabolic activity. First, 0.15 mg/mL Alamar blue solution was added at 10% volume of cell culture medium in a well and incubated for 2 h. The absorbance was then measured at 570 nm and plotted as O.D. versus number of days using Origin software. The intensity of coloured product is proportional to number of viable cells present on nanofibrous scaffold.
2.9. Cell cycle analysis
For cell cycle analysis by flow cytometry, cells were grown on TCPS and nanofibers for 7 days. After 7 days, media was removed and cells were washed twice with PBS. Then, cells were trypsinized, centrifuged at 1300 rpm and collected as a pellet. Supernatant was removed from the centrifuged pellet and 0.5 mL FACS (fluorescence activated cell sorting) cocktail (0.3%w/v saponin, 25 μg/mL propidium iodide (PI), 0.1 mM EDTA and 10 μg/mL RNase A in PBS) was added. It was then incubated for 4 h at 4 °C in dark and processed for FACS. The BD FACS Aria™ III (flow cytometer BD Biosciences, USA) was used for cell cycle analysis and 10,000 events for each sample were recorded. Data acquisition and analysis was done using BD FACS Diva software and percentage of cells present in G0/G1, S and G2/M phases were determined.
2.10. ECM production by immunostaining
For ECM deposition, cells were allowed to grow on nanofibers and TCPS coverslips up to two weeks and at every week, triplicate samples were harvested for ECM quantification. After removal of media and washing with PBS, samples were fixed with 2% paraformaldehyde solution for 30 min at RT. The ECM produced by cells was studied using three ECM proteins antibodies viz. fibronectin (BD Biosciences, USA), collagen IV (Abcam, UK) and laminin (Invitrogen, USA). Samples were incubated with these primary antibodies at 1:200 dilutions at 4 °C overnight. Afterwards, the primary antibodies were removed and goat anti-mouse AF488 conjugated secondary antibody for fibronectin (Invitrogen, USA) or donkey anti-rabbit AF568 conjugated secondary antibody for collagen IV and laminin (Invitrogen, USA) was added and incubated for 1 h at RT. Then, cells were washed with PBS and counter-stained with 50 ng/mL DAPI for 5 min. The samples were mounted on glass slides using antifading solution and imaged using a confocal microscope.
2.11. Nanoparticle internalization
BSA-AuNCs were used to study internalization in cells growing on TCPS and nanofibers. Briefly, cells were seeded on TCPS and nanofibers as described above and allowed to grow for 7 days. Then, cells were treated with 100 μg/mL BSA-AuNCs in media for 1 h. It was followed by trypsinisation and reseeding of these cells on glass coverslips for the fluorescence microscopy. Cells were allowed to attach on coverslips for 12 h. Afterwards, they were fixed with 2% paraformaldehyde for 30 min and imaging was performed using fluorescent microscope (Zeiss-Scope A1, Germany). The internalization of BSA-AuNCs by cells was quantified by calculating the corrected total cell fluorescence (CTCF) from the fluorescence images using ImageJ software. The fluorescence was calculated from the randomly selected images.
3. Results and discussion
3.1. Synthesis and characterization
3.1.1. Fabrication of PCL-CHT nanofibers
Electrospinning is a convenient technique that produces nano-to micro-scale fibers using high electric field [9]. Literature has promoted blend electrospinning of PCL and CHT. However, PCL is soluble in organic solvents while CHT is soluble in acetic aqueous solvents; therefore, it is difficult to dissolve them in a single solvent system. Steyaert et al. have suggested a solvent system made up of formic acid and acetic acid which shows great potential for PCL-CHT blend [10]. We have used 3:1 formic acid: acetic acid solvent to dissolve 14% w/v PCL and 2% w/v CHT which gave stable homogenous blend after 24 h of mixing.
Concentration of polymeric blend and other electrospinning parameters such as flow rate, voltage, distance between needle tip and collector were optimized for stable jet formation and fabrication of desired nanofibers. Fig. 1A and B shows SEM images of PCL-CHT nanofibers where bead-free homogenously distributed non-woven fibers can be observed. The maximum fiber diameter found was 106 ± 11.33 nm, whereas the mean diameter was 74.96 ± 2.54 nm. This indicated that PCL and CHT polymers could make fine nanofibers. As the fiber diameter and pore size was way smaller than the cell size, the nanofibers acted as a 3D substrate, rather than a scaffold. It provided a nano-scale topography to cells which has been proven as a better surface for cell adhesion [11,12].
Fig. 1.

SEM of PCL-CHT nanofibers show the morphology and random distribution of fibers.
The synthesis of BSA-AuNCs was performed by the method described by Singh et al. [13] with slight modification. As expected, UV–vis spectra of BSA-AuNCs did not indicate a clear surface plasmon resonance pattern, unlike the typical spherical gold nanoparticles (AuNPs), which exhibit a characteristic absorbance around 500 nm, demonstrating the synthesis of BSA-AuNCs of <3 nm diameter (Fig. 2A). It has been suggested that light scattering by very small (<2.5 nm) gold particles is nominal, leading to the absorbance of colloidal solution completely attributed to the photon absorbance with little scattering. Therefore, absence of any significant optical absorbance in the visible region of electromagnetic spectrum further confirms the formation of particles of <3 nm diameter. To further verify that this phenomenon is not attributed to BSA solution, we investigated the absorption spectra of BSA solution (50 mg/mL) as well, which exhibited a clear absorbance at 280 nm, but not in 400–700 nm region (Fig. 2A). Further, the fluorescence nature of BSA-AuNCs was examined by illuminating the BSA-AuNCs suspension under UV-light (Fig. 2A, inset), which showed a bright red color emission; whereas the BSA-AuNCs suspension exposed to visible light did not show such illumination. The shape and size of BSA-AuNCs was studied by imaging the clusters under TEM (Fig. 2C), which reveals that the clusters are quasi-spherical in shape (Fig. 2C) and coated with a dense layer of BSA. The average particle size distribution was obtained to be ∼2.2 nm, which was calculated by measuring the diameter of over 100 BSA-AuNCs (Fig. 2C Inset). BSA coating can be seen in TEM image in the form of a dense amorphous layer surrounding the clusters. To verify the presence of BSA over AuNCs surface, FTIR spectra of BSA and BSA-AuNCs were recorded (Fig. 2D). Results showed three clear transmission peaks at 1646 (amide-I), 1520 (amide-II) and 1240 (amide-III) cm−1 from pure BSA sample and the similar transmission signals (at 1652, 1539 and 1236 cm−1) were also observed in the samples containing BSA-AuNCs. Therefore, it can be concluded that BSA coating is present on the surface of AuNCs. Additionally, to verify the development of BSA-AuNCs, the fluorescence excitation and emission peak spectra were also monitored, which showed an excitation peak at ∼532 nm and emission peak at ∼670 nm (Fig. 2B). The colloidal suspension of BSA-AuNCs displayed high average zeta potential value (−31.8 ± 1.4 mV), which suggested that the BSA- AuNCs are stable in aqueous dispersion.
Fig. 2.

Characterization of BSA-AuNCs. (A) UV–Visible spectra measured from BSA solution (black curve), BSA-AuNCs (No incubation-blue curve), BSA-AuNCs (overnight incubation-red curve). Inset images demonstrate the color of BSA-AuNCs before and after UV light exposure (280 nm). (B) Excitation and emission spectra of BSA-AuNCs. (C) The representative transmission electron micrograph of BSA-AuNCs. Inset: Mean particle size distribution of BSA-AuNCs. (D) FTIR spectra of BSA and BSA-AuNCs showing specific transmission bands for amide – I, II and III.
3.2. Biological studies
3.2.1. Cell morphological study
Morphological study of C3H10T1/2 cells grown on nanofibers and TCPS was performed by SEM and confocal microscopy. The scanning electron micrographs of C3H10T1/2 cells grown on TCPS and nanofibers for 7 days showed that on TCPS, cells were more spread and flattened (Fig. 3a); whereas on nanofibers, they had characteristic spindle shaped morphology (Fig. 3b). Cells were well attached to nanofibers and were growing in a 3D morphology compared to cells on TCPS. In the magnified image (Fig. 3c), interaction between neighbouring cells can be observed. After two weeks of culture on nanofibers, it was interesting to observe ECM production by cells (Fig. 3d). It indicated that cells were able to produce their own ECM which could eventually replace biomaterial substrate. This is one of the basic requisites of cell culture substrates [14] and therefore ECM production by cells was studied further in detail.
Fig. 3.

Scanning electron micrographs of C3H10T1/2 cells grown on nanofibers. White arrow shows the nanofibrous mat (a) on which cells (shown by yellow arrows) are grown. The interaction between two adjacent cells can also be observed (b). After 14 days, the cells had started producing their own extracellular matrix (c), shown by blue arrows.
Confocal microscopy was performed to further observe cell adhesion and morphology on nanofibers. Fig. 4 shows cells grown on nanofibers for 7 days, stained with DAPI and phalloidin AF488. DAPI is a DNA binding stain, whereas in case of phalloidin Alexa Fluor 488, phalloidin binds to actin stress fibers and the conjugated Alexa Fluor molecule gives fluorescence to them. Fig. 4 shows densely grown cells on nanofibers where cytoskeleton of individual cell can be observed. Unlike confluent cells on TCPS, cells on nanofibers did not have elongated shape; instead they were well spread and overlapped each other like in vivo systems. It is reported that C3H10T1/2 cells are very sensitive to confluency in TCPS and their growth is arrested by contact inhibition. In confluent cultures, cells go to quiescent stage, around 80% cells in G0/G1 phase [15]. However, nanofibers were able to maintain these cells for longer duration even after it reached confluency. Further studies on cell proliferation and cell cycle analysis on nanofibers was carried out to find out the difference between TCPS and nanofiber surface.
Fig. 4.

Confocal microscopic images of cells grown on nanofibrous scaffold after 7 days. Figures (a) and (b) are cells stained with DAPI and Phalloidin-Alexa fluor 488, respectively. Figure (c) is the merged image of both a and b.
3.2.2. Cell proliferation assay
Cell proliferation on nanofibers was observed by Alamar Blue assay up to 15 days. As observed in Fig. 5, cells proliferated rapidly for first three days post-seeding on regular tissue culture plate surface. Their growth rate reached to a plateau stage at around 9 days. This was due to the sensitivity of cells towards contact inhibition. Once cells reached to 100% confluency, they started detaching from the surface and therefore cell number had decreased gradually at the end of experiment. In case of nanofibers, initially cell number was lesser compared to TCPS because cells took more time to adapt to a new surface. Then, cell proliferation increased steadily up to 15 days. This was in accordance with the previous report where it has been suggested that biomaterials provide the best cell adhesion and proliferation after 7 days of cell seeding and facilitate cell proliferation for longer durations [16]. Overall, the proliferation rate of cells was higher on nanofibers than on TCPS and cells were viable and in growth phase for more duration. This is very important for primary cells and stem cells as maintaining them at same passage is very crucial for their potency. Moreover, the total number of cells at confluency was also higher on nanofibers than TCPS due to higher surface area to volume ratio in case of nanofibers. Thus, nanofibers could be a better substrate for in vitro proliferation of specialised cells.
Fig. 5.

Alamar Blue assay showing cell proliferation of C3H10T1/2 cells grown on nanofibers (grey) and TCPS (black) up to 15 days.
3.2.3. Cell cycle analysis
Cell cycle analysis was performed by flow cytometry to understand cell distribution at different cell cycle phases i.e. G0/G1, S and G2/M. C3H10T1/2 cells were grown on TCPS and nanofibers for 7 days and cell cycle distribution by FACS was performed. It was found that on TCPS, more cells were present in G0/G1 phase (i.e. 68.55 ± 2.76%) than on nanofibers (39.85 ± 2.90%) (Fig. 6). This indicated that cells move to quiescent stage upon reaching confluency on TCPS. Moreover, proliferation index (PI) was calculated which is addition of percentage of cells present in S and G2/M phases that are responsible for cell proliferation [17]. For TCPS, proliferation index was 24.55%; whereas for nanofibers, it was more than double (55.70%) than that. This suggested that more cells on nanofibers are in proliferative phase after 7 days compared to TCPS. This could be beneficial for long term studies where TCPS is not capable of growing cells past few days; whereas nanofibers could be used for long term cell culture.
Fig. 6.

Cell cycle analysis of C3H10T1/2 cells grown on TCPS and nanofibers for 7 days. (a) shows the representative DNA histograms, (b) shows percentage of cells residing in G0/G1, S and G2/M phases, along with proliferation index (PI) and (c) shows the quantitative expression of the same.
3.3. Immunostaining of ECM proteins
One of the motives of artificial substrates is to induce cells to secrete ECM that can reinforce and replace the existing substrate during its degradation [18]. It was observed in SEM study that cells produced ECM after long term culture on nanofibers (Fig. 3d). The ECM production by cells indicated that cells had started to make their own microenvironment which is the ultimate goal of any artificial substrate. To study ECM production in detail, immunostaining of common proteins present in fibroblasts ECM such as fibronectin, collagen IV and laminin was performed. C3H10T1/2 cells were grown on TCPS and nanofibers for either 7 or 14 days and were assessed for the presence of these proteins. It was observed that on both TCPS and nanofibers, the highest protein production was of fibronectin, followed by collagen IV; whereas laminin was absent in all groups (Fig. 7). As nanofiber geometry mimics ECM fibers, cells adhere more strongly to nanofiber surface and to maintain this cell-fiber and cell-cell interaction, ECM production is induced. This was observed experimentally where overall ECM production (both fibronectin and collagen IV) was higher on nanofibers than on TCPS at both 7 and 14 days. This study suggested that cells on nanofibers are capable of producing their ECM which further strengthens adhesion to nanofibers and cell-cell interaction. Moreover, lack of ECM on TCPS does not promote long term growth of cells on TCPS and they detach easily after reaching confluency. ECM provides cells with more biomimetic environment and also provides more surface area for cell growth and proliferation. Production of fibronectin and collagen in hESCs and hiPSCs culture has been designated as a self-supportive niche that can support cell growth [19]. For mesenchymal stem cells’ maintenance and proliferation also ECM works as an optimal niche [20]. Thus, ability of nanofibers to induce ECM secretion by cells is beneficial for in vitro cell expansion.
Fig. 7.

Immunostaining of ECM proteins fibronectin, collagen IV and laminin produced by C3H10T1/2 cells grown on TCPS and nanofibers for 7 and 14 days. (a–p) are confocal microscopic images of same (Scale bar represents 50 μm); whereas (q, r) are quantitative measurement of fibronectin and collagen production, respectively. p value < 0.05.
3.4. Cellular internalization of BSA-AuNCs
Cellular internalization of the nanoparticles depends on shape, size and charge of nanoparticles, their interactions with cell membrane and ECM [21,22]. Nanoparticles are internalized via various endocytic pathways, which includes the clathrin/caveolin dependent/independent pinocytosis and macro-pinocytosis. These pathways are regulated by overall cell structure, membrane shape and cell organization. However, with the production of ECM, nanoparticle internalizations are regulated by the cell cytoskeleton network [23] and mechanosensing of the ECM [24]. The biophysical properties of ECM also influence the peculiar properties of cell such as cell proliferation and differentiation [25,26]. When cells are grown on nanofibers, the ECM production is increased compared to the TCPS. The ECM production influences the nanoparticle internalization by cells [24]. Moreover, couple of studies have indicated that cellular uptake of nanoparticles is also influenced by cell cycle stage [27,28]. As discussed above, more cells are present in G2/M phase on nanofibers compared to TCPS. Therefore, it is also interesting to study its role in cellular uptake.
To investigate the role of ECM production and cell cycle on the nanoparticle internalization, BSA-AuNCs were used because of their fluorescence properties which could be easily located to quantify the cellular internalization. Cells grown on NFs internalized more BSA-AuNCs compared to those grown on TCPS (Fig. 8a and (b)). The BSA-AuNCs internalization was quantified by ImageJ software, which showed the difference in the CTCF (Fig. 8c). The cells grown on NFs internalized ~25 times more BSA-AuNCs than those grown on TCPS. The difference in the BSA-AuNCs internalization was correlated with more ECM production on nanofibers compared to TCPS. Previous studies also suggest the rapid and accelerated cellular internalizations of nanoparticles on ECM substrates compared to the flat surfaces [29]. These results are also supported by previous studies which show the role of cell cycle stages on nanoparticle internalizations. Study by Kim et al. suggest that cells present in G2/M phase are more susceptible for nanoparticles internalization than the ones present in G0/G1 or S phase [27]; correlating it with cell cycle analysis of cells grown on nanofibers (Fig. 5). Hence, nanofibers enhance the ECM production by cells and influence the cell cycle, which in turn affects the internalization of nanoparticles.
Fig. 8.

Fluorescence microscopy images of cells treated with BSA-AuNCs on TCPS (a) and nanofibers (b) (Images were captured at 20X magnification); whereas (c) is the quantitative measurement of the BSA-AuNCs internalization by cells grown on TCPS and nanofibers, respectively. p value < 0.05.
4. Conclusion
Worldwide, majority of the cell culture experiments are performed using tissue culture plates. Even though the importance of biomimetic substrates has been well recognised, tissue culture plates are still not replaced. The main reasons include need of specialised expertise, cost factor, inconvenience to perform standard procedures such as trypsinisation, imaging, etc in specially designed biomimetic substrates. Therefore, we proposed a biomimetic nanofibrous substrate that is as easy to use as TCPS, yet provides more realistic in vitro results. In the present study, we have fabricated PCL-CHT nanofibrous substrate with desired properties and have used it to grow C3H10T1/2 cells. Different in vitro cell culture experiments such as cell morphology, proliferation, cell cycle, cellular internalization have been performed on cells growing on TCPS and nanofibers. It was observed that nanofibers supported the cell culture better and influenced cell behaviour. The morphology of cells on nanofibers resembled their in vivo appearance. Nanofibers promoted cell proliferation and ECM production compared to TCPS. In cell cycle analysis, it was found that on nanofibers, more cells were present in growth phase compared to cells grown on TCPS. Because of nanofibers’ effect on ECM production and cell cycle, internalization of BSA-AuNCs was also enhanced. Overall, these studies suggest that PCL-CHT nanofibers influence cell behaviour and provide more realistic results, at the same time, they are easy to fabricate and use.
Acknowledgement
The Authors acknowledge SERB, Department of Science & Technology (DST), Govt. of India (Grant no. SB/YS/LS-13/2014) for financial support.
Footnotes
Peer review under responsibility of KeAi Communications Co., Ltd.
References
- 1.Pampaloni F., Reynaud E.G., Stelzer E.H.K. The third dimension bridges the gap between cell culture and live tissue. Nat. Rev. Mol. Cell Biol. 2007;8:839–845. doi: 10.1038/nrm2236. [DOI] [PubMed] [Google Scholar]
- 2.Jhala D., Rather H., Vasita R. Polycaprolactone-chitosan nanofibers influence cell morphology to induce early osteogenic differentiation. Biomater Sci. 2016;4:1584–1595. doi: 10.1039/c6bm00492j. [DOI] [PubMed] [Google Scholar]
- 3.Palchesko R.N., Lathrop K.L., Funderburgh J.L., Feinberg A.W. In vitro expansion of corneal endothelial cells on biomimetic substrates. Sci. Rep. 2015;5:7955. doi: 10.1038/srep07955. [DOI] [PMC free article] [PubMed] [Google Scholar]
- 4.Chen H., Fan X., Xia J., Chen P., Zhou X., Huang J. Electrospun chitosan-graft-poly (varepsilon-caprolactone)/poly (varepsilon-caprolactone) nanofibrous scaffolds for retinal tissue engineering. Int. J. Nanomed. 2011;6:453–461. doi: 10.2147/ijn.s17057. [DOI] [PMC free article] [PubMed] [Google Scholar]
- 5.Hong S., Kim G. Fabrication of electrospun polycaprolactone biocomposites reinforced with chitosan for the proliferation of mesenchymal stem cells. Carbohydr. Polym. 2011;83:940–946. doi: 10.1016/j.carbpol.2010.09.002. [DOI] [Google Scholar]
- 6.Prabhakaran M.P., Venugopal J.R., Chyan T.T., Hai L.B., Chan C.K., Lim A.Y. Electrospun biocomposite nanofibrous scaffolds for neural tissue engineering. Tissue Eng. 2008;14:1787–1797. doi: 10.1089/ten.tea.2007.0393. [DOI] [PubMed] [Google Scholar]
- 7.Simsek M., Capkin M., Karakecili A., Gumusderelioglu M. Chitosan and polycaprolactone membranes patterned via electrospinning: effect of underlying chemistry and pattern characteristics on epithelial/fibroblastic cell behavior. J. Biomed. Mater. Res. 2012;100:3332–3343. doi: 10.1002/jbm.a.34287. [DOI] [PubMed] [Google Scholar]
- 8.Yang X., Chen X., Wang H. Acceleration of osteogenic differentiation of preosteoblastic cells by chitosan containing nanofibrous scaffolds. Biomacromolecules. 2009;10:2772–2778. doi: 10.1021/bm900623j. [DOI] [PubMed] [Google Scholar]
- 9.Bhardwaj N., Kundu S.C. Electrospinning: a fascinating fiber fabrication technique. Biotechnol. Adv. 2010;28:325–347. doi: 10.1016/j.biotechadv.2010.01.004. [DOI] [PubMed] [Google Scholar]
- 10.Steyaert I., Van der Schueren L., Rahier H., de Clerck K. An alternative solvent system for blend electrospinning of polycaprolactone/chitosan nanofibres. Macromol. Symp. 2012;321‐322:71–75. doi: 10.1002/masy.201251111. [DOI] [Google Scholar]
- 11.Elias K.L., Price R.L., Webster T.J. Enhanced functions of osteoblasts on nanometer diameter carbon fibers. Biomaterials. 2002;23:3279–3287. doi: 10.1016/s0142-9612(02)00087-x. [DOI] [PubMed] [Google Scholar]
- 12.Fan Y.W., Cui F.Z., Hou S.P., Xu Q.Y., Chen L.N., Lee I.S. Culture of neural cells on silicon wafers with nano-scale surface topograph. J. Neurosci. Methods. 2002;120:17–23. doi: 10.1016/s0165-0270(02)00181-4. [DOI] [PubMed] [Google Scholar]
- 13.Singh S. Glucose decorated gold nanoclusters: a membrane potential independent fluorescence probe for rapid identification of cancer cells expressing Glut receptors. Colloids Surfaces B Biointerfaces. 2017;155:25–34. doi: 10.1016/j.colsurfb.2017.03.052. [DOI] [PubMed] [Google Scholar]
- 14.Langer R., Vacanti J.P. Tissue engineering. Science (New York, NY) 1993;260:920–926. doi: 10.1126/science.8493529. [DOI] [PubMed] [Google Scholar]
- 15.Gos M., Miloszewska J., Swoboda P., Trembacz H., Skierski J., Janik P. Cellular quiescence induced by contact inhibition or serum withdrawal in C3H10T1/2 cells. Cell Prolif. 2005;38:107–116. doi: 10.1111/j.1365-2184.2005.00334.x. [DOI] [PMC free article] [PubMed] [Google Scholar]
- 16.Ravichandran R., Liao S., Ng C., Chan C.K., Raghunath M., Ramakrishna S. Effects of nanotopography on stem cell phenotypes. World J. Stem Cell. 2009;1:55–66. doi: 10.4252/wjsc.v1.i1.55. [DOI] [PMC free article] [PubMed] [Google Scholar]
- 17.Tan A.W., Tay L., Chua K.H., Ahmad R., Akbar S.A., Pingguan-Murphy B. Proliferation and stemness preservation of human adipose-derived stem cells by surface-modified in situ TiO(2) nanofibrous surfaces. Int. J. Nanomed. 2014;9:5389–5401. doi: 10.2147/ijn.s72659. [DOI] [PMC free article] [PubMed] [Google Scholar]
- 18.Rosso F., Giordano A., Barbarisi M., Barbarisi A. From Cell–ECM interactions to tissue engineering. J. Cell. Physiol. 2004;199:174–180. doi: 10.1002/jcp.10471. [DOI] [PubMed] [Google Scholar]
- 19.Hughes C., Radan L., Chang W.Y., Stanford W.L., Betts D.H., Postovit L.M. Mass spectrometry-based proteomic analysis of the matrix microenvironment in pluripotent stem cell culture. Mol. Cell. Proteomics. 2012;11:1924–1936. doi: 10.1074/mcp.M112.020057. [DOI] [PMC free article] [PubMed] [Google Scholar]
- 20.Chen X.D. Extracellular matrix provides an optimal niche for the maintenance and propagation of mesenchymal stem cells. Birth Defects Res. Part C Embryo Today - Rev. 2010;90:45–54. doi: 10.1002/bdrc.20171. [DOI] [PubMed] [Google Scholar]
- 21.Albanese A., Tang P.S., Chan W.C. The effect of nanoparticle size, shape, and surface chemistry on biological systems. Annu. Rev. Biomed. Eng. 2012;14:1–16. doi: 10.1146/annurev-bioeng-071811-150124. [DOI] [PubMed] [Google Scholar]
- 22.Engin A.B., Nikitovic D., Neagu M., Henrich-Noack P., Docea A.O., Shtilman M.I. Mechanistic understanding of nanoparticles' interactions with extracellular matrix: the cell and immune system. Part. Fibre Toxicol. 2017;14:22. doi: 10.1186/s12989-017-0199-z. [DOI] [PMC free article] [PubMed] [Google Scholar]
- 23.Huang C., Ozdemir T., Xu L.-C., Butler P.J., Siedlecki C.A., Brown J.L. The role of substrate topography on the cellular uptake of nanoparticles. J. Biomed. Mater. Res. B Appl. Biomater. 2016;104:488–495. doi: 10.1002/jbm.b.33397. [DOI] [PMC free article] [PubMed] [Google Scholar]
- 24.Panzetta V., Guarnieri D., Paciello A., Della Sala F., Muscetti O., Raiola L. ECM mechano-sensing regulates cytoskeleton assembly and receptor-mediated endocytosis of nanoparticles. ACS Biomater. Sci. Eng. 2017;3:1586–1594. doi: 10.1021/acsbiomaterials.7b00018. [DOI] [PubMed] [Google Scholar]
- 25.Ulrich T.A., de Juan Pardo E.M., Kumar S. The mechanical rigidity of the extracellular matrix regulates the structure, motility, and proliferation of glioma cells. Cancer Res. 2009;69:4167. doi: 10.1158/0008-5472.CAN-08-4859. [DOI] [PMC free article] [PubMed] [Google Scholar]
- 26.Engler A.J., Sen S., Sweeney H.L., Discher D.E. Matrix elasticity directs stem cell lineage specification. Cell. 2006;126:677–689. doi: 10.1016/j.cell.2006.06.044. [DOI] [PubMed] [Google Scholar]
- 27.Kim J.A., Åberg C., Salvati A., Dawson K.A. Role of cell cycle on the cellular uptake and dilution of nanoparticles in a cell population. Nat. Nanotechnol. 2011;7:62. doi: 10.1038/nnano.2011.191. [DOI] [PubMed] [Google Scholar]
- 28.Treuel L., Jiang X., Nienhaus G.U. New views on cellular uptake and trafficking of manufactured nanoparticles. J. R. Soc. Interface. 2013;10 doi: 10.1098/rsif.2012.0939. [DOI] [PMC free article] [PubMed] [Google Scholar]
- 29.Yhee J.Y., Yoon H.Y., Kim H., Jeon S., Hergert P., Im J. The effects of collagen-rich extracellular matrix on the intracellular delivery of glycol chitosan nanoparticles in human lung fibroblasts. Int. J. Nanomed. 2017;12:6089–6105. doi: 10.2147/ijn.s138129. [DOI] [PMC free article] [PubMed] [Google Scholar]