Summary
In this study, we aimed to explore the effects of imatinib on the proliferation of rheumatoid arthritis synovial cell (RA‐FLS) and inflammatory responses by regulating CSF1R. Differential genes were screened via microarray analysis, followed by being analysed through the weighted co‐expression network (WGCNA) network, that included module and cluster analysis. The relationship between imatinib and genes was visualized using the Search Tool for the Retrieval of Interacting Genes (STITCH) database. Expressions of mRNA and protein were determined by reverse transcription–polymerase chain reaction (RT–PCR) and Western blot, respectively. Cell viability was examined via clone formation assay, while cell cycle and apoptosis were analysed through flow cytometry analysis. The hub gene CSF1R was ultimately determined by microarray analysis and WGCNA analysis. Colony‐stimulating‐factor receptor‐1 (SF1R) was highly expressed in rheumatoid arthritis tissues and cells, and CSF1R over‐expression could promote inflammatory responses. Moreover, CSF1R could promote RA‐FLS proliferation, inhibit apoptosis and accelerate the cell cycle. The targeting relationship between imatinib and CSF1R was also validated in this study. Imatinib attenuated RA‐FLS inflammation in a concentration‐dependent manner. Meanwhile, imatinib could inhibit RA‐FLS proliferation and promote apoptosis, ultimately reducing the damage of RA‐FLS. Over‐expression of CSF1R accelerated the cell cycle and proliferation of RA‐FLS, while inhibiting cell apoptosis. Conversely, imatinib could significantly restrain the cell cycle and viability of RA‐FLS and accelerated apoptosis via suppression of CSF1R expression. Further, histological and serological assay investigated and proved the proinflammatory effects of CSF1R in RA rabbits.
Keywords: CSF1R, imatinib, RA‐FLS, rheumatoid arthritis, WGCNA
Introduction
Rheumatoid arthritis (RA) is a type of autoimmune disease which can cause severe pain and disability 1. Considerable evidence has indicated that the incidence of this disease in women is much higher than in men, and 80% of cases occur in the population aged 35–50 years 2. The complex aetiology of RA can be attributed to multiple factors. Various cell components, such as lymphocytes, mast cells, neutrophils and monocytes/macrophages, have been validated to aggravate inflammatory responses. Activation of these cells ultimately results in the production of inflammatory cytokines and mediators 3. Therefore, it is imperative to identify an important indicator of the severity of the disease through examining the expression level of inflammatory cytokines. For instance, previous researches have shown that tumour necrosis factor (TNF‐α) and interleukin (IL)‐1β are the main components of inflammation in RA 4, 5. However, the current treatment of RA remains expensive, especially the costs of biological agents, surgery and rehabilitation treatment 6, and hence exploration for the molecular mechanism of RA is still essential to minimize the clinical and socioeconomic impacts of RA.
Colony‐stimulating‐factor receptor‐1 (CSF1R) is a type III receptor tyrosine kinase which has been reported to be responsible for the proliferation, differentiation and survival of the monocyte/macrophage cell lineage, as well as recruitment 7. CSF1R is an oncology therapeutic target that either inhibits paracrine processes or recanalizes tumour‐associated macrophages (TAMs) in the tumour microenvironment, which has a negative effect on RA‐related diseases 8. CSF1R/CSF1 receptor/ligand complexes exert basic physiological functions in macrophage differentiation, embryo implantation, placental development and milk differentiation 9. It has been confirmed that c‐Fms ligand macrophage colony‐stimulating factor (M‐CSF) is derived mainly from fibroblast‐like synoviocytes such as T cells and endothelial cells, and its expression is found up‐regulated in these RA cells 10, 11. The relevance of M‐CSF to important cell‐specific processes in the pathogenesis of RA was revealed in a previous study 12. High expression of CSF1R has also been described in tumours of epithelial origin, such as prostate cancer, renal cell carcinomas and breast cancer 9, 13, 14. In the present study, DEGs were screened based upon microarray analysis and were then analysed through a weighted co‐expression network (WGCNA). CSF1R in RA was ultimately identified as the core gene of our study.
Imatinib mesylate (imatinib) is a tyrosine kinase inhibitor that can be used for the treatment of chronic myeloid leukaemia and c‐Kit gastrointestinal stromal tumours 12. Some recent studies have indicated that imatinib exerts a positive effect on alleviating the clinical symptoms of RA patients. It has recently been reported that imatinib mesylate may treat rheumatoid arthritis effectively by inhibiting KIT receptor on mast cells 15. Furthermore, numerous researchers have indicated that imatinib could improve inflammatory responses in RA animal models. Imatinib may also have therapeutic efficacy in arthritis induced by anti‐collagen type II antibodies (CAIA) in mice 16. In addition, imatinib mesylate could prevent joint damage in patients with rheumatoid arthritis 17. Similarly, this study explored the role and molecular mechanism of imatinib in RA.
In the present study, we first sought for DEGs via microarray analysis, and then a modular and cluster analysis of the DEGs was conducted using the WGCNA software package in order to determine core genes. Moreover, we probed into the effects of imatinib on the expression and cellular functions of rheumatoid arthritis synovial cell (RA‐FLS) cells in vitro.
Materials and methods
Patients and tissue samples
Fifteen synovial tissues were collected from patients undergoing knee joint synovectomy or arthroplasty from September 2016 to October 2017, while another 15 healthy joint synovial tissues were from those patients who received trauma knee surgery after car accidents. Patients were informed of the relevant conditions prior to surgery and signed informed consent. Clinical diagnosis was conducted based on the revised standards of the American Rheumatism Society. The study was approved by the Ethics Committee of the Sun Yat‐sen Memorial Hospital, Sun Yat‐sen University. For tissue specimens, synovial tissues were sectioned into small pieces of approximately 2 mm3 for the removal of fat, bone, cartilage and fibrous tissue. The removed synovial tissue samples were processed as follows: a small piece was weighed and placed in the well of a 12‐well plate (18–20 explants, approximately 300 mg tissue per well). The weight of synovial tissues in each well was recorded and these tissues were then stored in liquid nitrogen conditions at –270°C.
Cell culture
All cells were purchased from BeNa Culture Collection (BNCC, Beijing, China). Human fibroblast‐like synoviocyte (HFLS) cells (originally from normal healthy human synovial tissue) were cultured in 10% fetal bovine serum (FBS) + 90% Dulbecco’s modified Eagle’s medium (DMEM) with high glucose (containing 4 mM L‐glutamine, sodium pyruvate). RA‐FLS (originally from rheumatoid arthritis synovial tissue) were cultured in 10% FBS + 90% DMEM with high glucose. Cell culture was performed at 37°C and 5% CO2.
Cell transfection
The si‐CSF1R and pcDNA3.1‐CSF1R were generated and synthesized by Ribobio (Guangzhou, China). The cells were placed into a six‐well cell culture plate, followed by transfection using Lipofectamine™ 2000 (Invitrogen, Carlsbad, CA, USA), in accordance with the manufacturer’s instructions.
Microarray analysis
Because Gene Expression Omnibus (GEO) (https://www.ncbi.nlm.nih.gov/geo/) is a public functional genomics data repository, microarray data were downloaded from GEO data sets. GSE55235 (GPL96) is a microarray that utilizes total RNA from 10 healthy synovial tissues and 10 rheumatoid arthritis synovial tissues derived from the GEO database. Based upon microarray analysis, the top 20 differential mRNAs were selected following the criteria of fold change > 1·5 and P‐value < 0·05.
WGCNA analysis
The WGCNA r package was used to gather groups of strongly co‐expressed genes into co‐expression networks. A weighted gene co‐expression network reconstruction algorithm was applied to establish co‐expression networks among the distinct 2326 DEGs. WGCNA workflows first discover a Pearson’s correlation matrix between genes, and then raise them to a power β point with a soft threshold to shift them into an adjacency matrix. In this study, β = 18 was selected, so that the resulting adjacency matrix approximated a scale‐free topology criterion. The adjacency matrix was converted to a topological overlap matrix (TOM). Modules were defined as groups of highly interconnected genes. To confirm modules of highly co‐expressed genes, we utilized average linkage hierarchical gathering to group genes ground on the topological overlap of their connectivity, followed by a dynamic tree‐cut algorithm to cluster dendrogram branches into gene modules. Each of the resulting modules was expressed as a colour.
Module preservation
In order to test the module storage in the replicated sample, we employed the Z summary statistics method of the WGCNA package 18. Z summary was the comprehensive statistical data of two kinds of preservation measures: (a) it could determine whether module genes in the copy network maintain connectivity density to keep statistics and save the statistic based on the connection; and (b) it could determine whether the connection between the genes in the network pattern was similar to the copy in the network. Using the replacement test to assess the importance of saving statistics and the Z‐summary of the ‘gold’ module, this represented a random sample of the entire network.
Chemical–protein interaction
STITCH (version 5.0, https://stitch.embl.de/) is a web‐based resource to explore known and predicted interactions of proteins and chemicals 19. An eight‐hub genes list was submitted to find similar proteins in the database under ‘Homo sapiens organism’, and then SEARCH was selected automatically to be in the running by the program. Seventeen proteins had similar functions with each other; they are: TAPBP, HYAL1, GPSM3, CBL, TNFRSF11A, TNFSF11, TNFRSF11B, CSF1, CSF1R, UBA7, HERC5, ISG15, USP18, ARRB1, CCR7, CCL21 and CCL19; CSF1R acted as the target protein of imatinib.
Reverse transcription–polymerase chain reaction (RT–PCR)
The reverse transcription response was implemented by using a random primer and reverse transcriptase kit (Takara, Dalian, China). Real‐time PCR was detected using a standard SYBR Green PCR kit (Takara). The result was normalized to β‐actin expression. Reverse transcription was performed after the Applied Biosystems TaqMan MicroRNA assay program to detect the expression of CSF1R, IL‐1β and TNF‐α. The consequences were also normalized to β‐actin. The primers of CSF1R, IL‐1β and TNF‐α are shown in Table 1. The relative expression levels of CSF1R, IL‐1β and TNF‐α were computed by using the 2–ΔΔct method.
Table 1.
Primer sequences for RT–PCR
| Genes | Sequences |
|---|---|
| CSF1R | Forward: 5′‐ GAAGGGCAGACAGAGTGTCC‐3′ |
| Reverse: 5′‐ GGATTCCCTGACCATGCCAA‐3′ | |
| TNF‐α | Forward : 5′‐ TATCCTGGGGGACCCAATGT‐3′ |
| Reverse: 5′‐ AGCTTCTTCCCACCCACAAG‐3′ | |
| IL‐1β | Forward : 5′‐ TCGCCAGTGAAATGATGGCT‐3′ |
| Reverse: 5'‐ AGAACACCACTTGTTGCTCCA‐3′ | |
| β‐actin | Forward : 5'‐ATCACCATTGGCAATGAGCG‐3′ |
| Reverse: 5′‐TTGAAGGTAGTTTCGTGGAT‐3′ |
RT–PCR = reverse transcription–polymerase chain reaction; CSF1R = colony‐stimulating factor receptor‐1; TNF = tumour necrosis factor; IL = interleukin.
Western blot
An equal amount of protein was subjected to a 10% sodium dodecyl sulphide (SDS) polyacrylamide gel and diverted to a polyvinylidene difluoride (PVDF) membrane (Millipore, Billerica, MA, USA). Membranes were incubated with anti‐CSF1R (using a concentration of 0·1–0·5 µg/ml; Abcam, Cambridge, MA, USA) and anti‐glyceraldehyde 3‐phosphate dehydrogenase (GAPDH) (1 : 1000; Abcam). After repeated washing, membranes were incubated with secondary peroxidase‐conjugated goat anti‐rabbit immunoglobulin (IgG) (1 : 1000; Cell Signaling Technology, Danvers, MA, USA) for 1·5 h. Immunoreactivity was visualized by reinforced chemiluminescence (ECL kit; Pierce Biotechnology, Waltham, MA, USA) after rinsing again with Tris‐buffered saline Tween 20 (TBST) for 30 min under 20°C. The assay was repeated three times, and the membrane was uncovered to a Kodak XAR‐5 membrane (Sigma‐Aldrich, St Louis, MO, USA).
Colony formation assay
Cells were digested with trypsin, and 200 cells were seeded in 24‐well plates and cultivated at 37°C. Colonies were incubated with a staining solution containing 0·1% crystal violet and 20% methanol. The colony, consisting of at least five cells from the ×10 field or the entire well, was then counted.
Cell cycle analysis
For cell cycle analysis, after transfection with or without the treatment of 1 μM imatinib for 48 h, cells were harvested and washed with phosphate‐buffered saline (PBS). Suspended cells were fixed with cold alcohol (75%) for 4 h at 4°C, then washed with cold PBS and resuspended at 1 × 10⁶ cells/ml in PBS. The cells were further incubated with RNase I containing propidium iodide (PI) (40%; Sigma‐Aldrich) at 37 °C for 30 min. Cell cycle assay was carried out by using fluorescence activated cell sorter (FACS)Calibur (BD Biosciences, San Jose, CA, USA) and data were analysed using FACSDiva (BD Biosciences). The experiment was performed in triplicate.
Cell apoptosis analysis
Germinal cell (GC) cell apoptosis was evaluated by using a fluorescein isothiocyanate (FITC)‐labelled annexin V (annexin V‐FITC) apoptosis detection kit (BD Biosciences , San Jose, CA, USA). Cells were harvested after the indicated treatment and then resuspended in ×1 binding buffer, followed by staining with annexin V‐FITC and PI in the dark. The percentage of apoptotic cells was measured through flow cytometry (FACSCalibur; BD Biosciences, San Jose, CA, USA). The entire operation was carried out following the manufacturer’s instructions.
Induction of RA in rabbits
RA was generated in a well‐established rabbit model. This protocol was approved by the animal experimentation committee of the Sun Yat‐sen Memorial Hospital, Sun Yat‐sen University. Briefly, 24 adult female New Zealand white (NZW) rabbits with an initial weight of 3·3–3·9 kg were immunized by intradermal injections of 5 mg of ovalbumin (OVA; Sigma‐Aldrich, St. Louis, Missouri, United States) in Freund’s complete adjuvant (Difco, Detroit, MI, USA). Animals were immunized again 3 weeks later in the absence of the adjuvant. Ten days after the second immunization (day 0), 5 mg of OVA dissolved in 0·5 ml sterile saline was injected into the knees of 18 rabbits to induce arthritis (RA group). The same volume of sterile saline was injected into the knees of the remaining six animals (sham group). Twenty‐four hours after injection (on day 1), hospitals in the RA group were randomized into three groups. One group was injected with 1 μM imatinib (2 ml/kg, imatinib group, n = 6); one group was injected with 1 μM imatinib (2 ml/kg) and 5 μg pcDNA3.1‐CSF1R (imatinib + pcDNA3.1‐CSF1R group, n = 6); and one group was injected with 0·5 ml sterile saline (NC group).
Biological analysis
RA was clinically assessed in the animals by measurement of weight loss and joint diameter and determination of serum rheumatoid factor (RF), tumour necrosis factor α (TNF‐α) levels and anti‐CCP levels. The levels of RF, TNF‐α and anti‐cyclic citrullinated peptide (CCP) were measured by enzyme‐linked immunosorbent assay (ELISA) kits, according to the manufacturer’s instructions. All animals were killed 7 days after treatment (day 8), and femoral joints were collected and individually fixed in 10% buffered formalin. After fixation for 3 days, the sample was embedded in paraffin and sectioned at 5 μm. The slides were then deparaffinized in xylene, dehydrated in a gradient of alcohols and stained using haematoxylin and eosin (H&E). Additional sections were rehydrated in a graded series of ethanol and stained with toluidine blue to evaluate cartilage damage and osteophytes.
Statistical analysis
GraphPad Prism version 6.0 (GraphPad Software, Inc., San Diego, CA, USA) and the WGCNA software package were employed for data analysis. Student’s t‐test and one‐way analysis of variance (anova) were utilized to compare and evaluate the differences between two or more groups. P < 0·05 was considered statistically significant.
Results
Co‐expression network construction and module mining
In order to determine the core gene of our study, we performed microarray and WGCNA analyses. The screened DEGs (fold change > 1·5 and P‐value < 0·05) between the healthy synovium tissues and the rheumatoid arthritis synovial tissues are shown in Fig. 1. The data set gene co‐expression network was established by means of WGCNA, and eight modules were finalized. These modules were referred to as the red, yellow, blue, green, black, brown, yellow and turquoise modules, respectively (Fig. 1b). The correlation coefficients were calculated to determine the association between the genes in each module (Fig. 1c). Eight‐hub genes were put into the STITCH database, of which only CSF1R was a direct target of imatinib (the drug that treated rheumatoid arthritis). Moreover, imatinib could influence the expression of other genes through CSF1R, and hence we speculated that CSF1R is the core regulator in the treatment of imatinib (Fig. 1d). Eight‐hub genes (red dots) were identified in each module of interest, principally through relying on high module membership values (Fig. 2a). In addition, the gene interaction network in the Brown module was further visualized by using the Cytoscape software (Fig. 2b). As it was significantly differentially expressed in RA, CSF1R was used for subsequent experiments.
Figure 1.
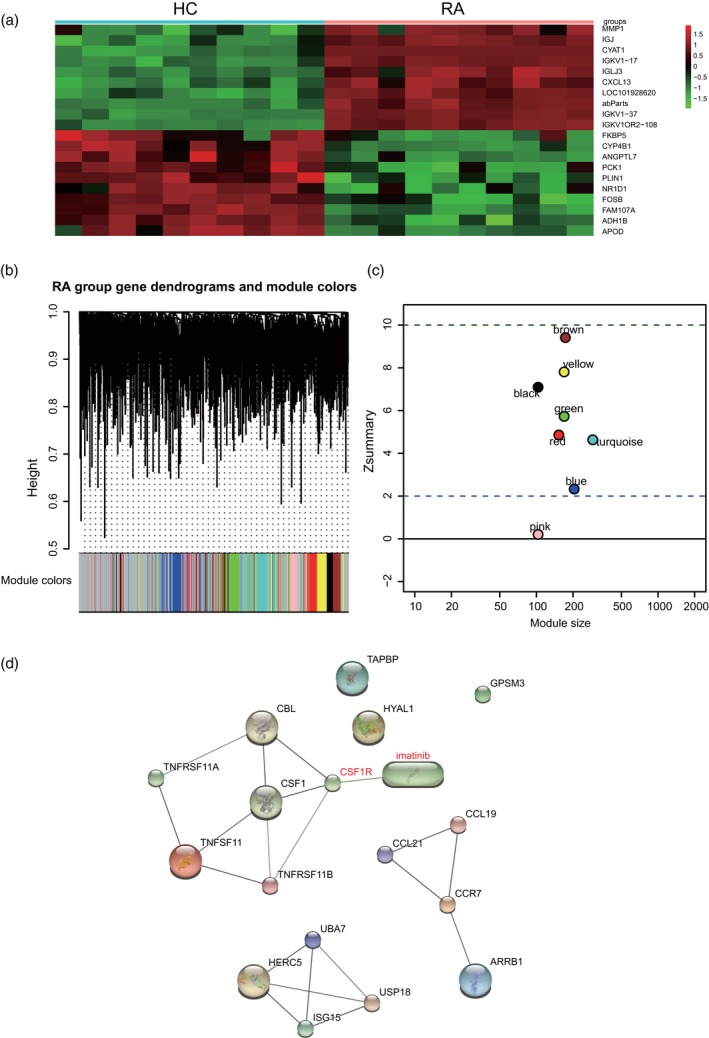
Co‐expression network construction and module mining. (a) Heat‐map of differentially expressed genes (DEGs) identified in synovial tissues of healthy joints and synovial tissues of rheumatoid arthritis. (b) Eight modules identified from the gene co‐expression network. Cluster analysis results as shown above, module identifier as shown below. (c) The Z summary statistics of the module preservation of the DEG modules. In the preservation Z summary graph, two dashed blue lines represent the thresholds of Z = 2 and Z = 10, respectively. (d) Prediction of the direct relationship between imatinib and CSF1R using the Search Tool for the Retrieval of Interacting Genes (STITCH) database.
Figure 2.
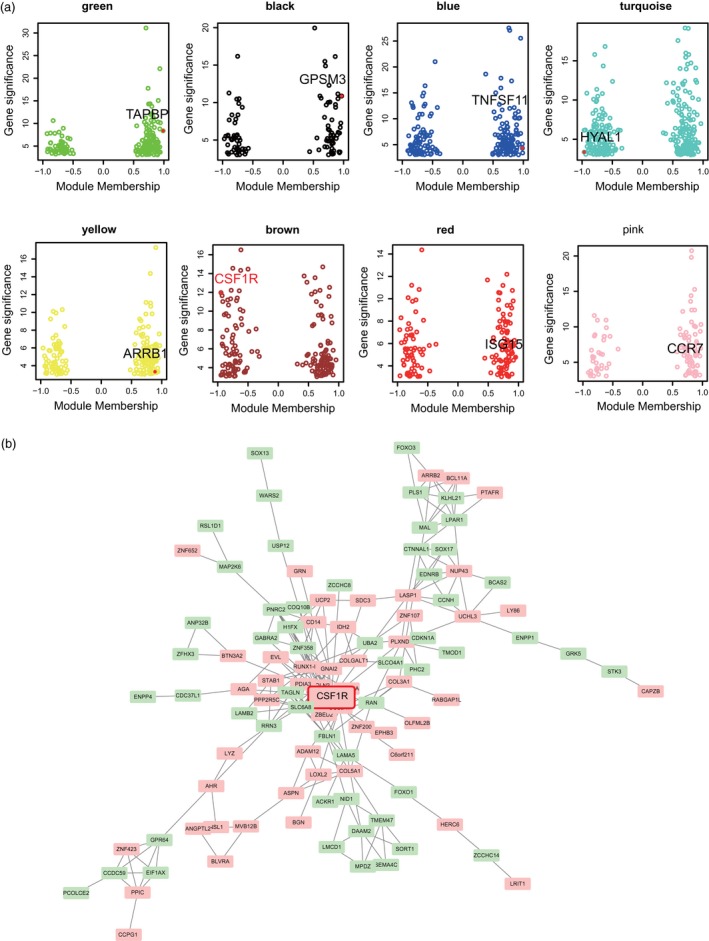
Co‐expression network construction and module mining. (a) Identification of the hub genes in the eight modules. (b) Formation of the regulatory network by Cytoscape. Pink nodes represent common up‐regulated genes. The green node represents the down‐regulated gene.
CSF1R was over‐expressed in rheumatoid arthritis
For the detection of CSF1R expression in RA, RT–PCR results showed that CSF1R expression was considerably increased in rheumatoid arthritis (Fig. 3a, *P < 0·05). Then, we selected HFLS cell lines and RA‐FLS. Similar to the results in tissue, RT–PCR and Western blot experiments showed that CSF1R mRNA and protein relative expression levels in RA‐FLS were significantly higher, which compared with the HFLS cell line (Fig. 3b, * P < 0·05). We over‐expressed and knocked‐down CSF1R, respectively, and confirmed the transfection success by RT–PCR and Western blot. The result is showed in Fig. 3c,d (* P < 0·05). TNF‐α and 1L‐1β were used as markers of inflammation in each group. The outcome showed that the mRNA expression of TNF‐α and 1L‐1β were notably increased when CSF1R was over‐expressed. However, knock‐down of CSF1R significantly decreased the mRNA expression of TNF‐α and 1L‐1β (Fig. 3e,f, * P < 0·05). These outcomes revealed that CSF1R was highly expressed in both rheumatoid arthritis tissue and cells, and aggravated the inflammatory response of rheumatoid arthritis.
Figure 3.
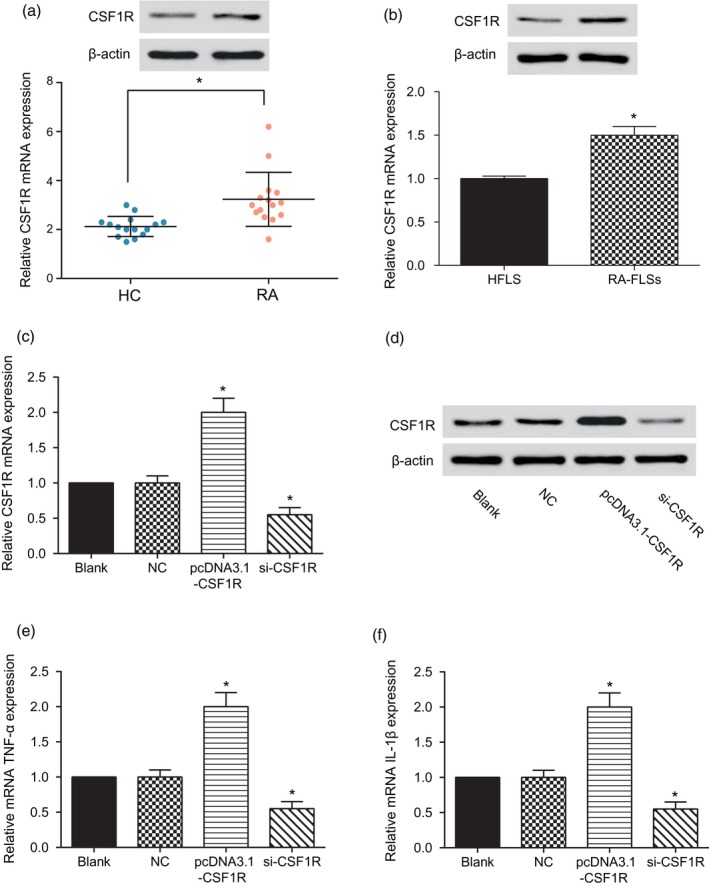
Colony‐stimulating factor receptor‐1 (CSF1R) was highly expressed in rheumatoid arthritis. (a) Detection of relative CSF1R expression level in healthy synovial tissue and rheumatoid arthritis synovial tissue. (b) Detection of relative CSF1R protein expression level in the human fibroblast‐like synoviocyte (HFLS) and rheumatoid arthritis synovial cell (RA‐FLS) groups. (c–d) Detection of relative CSF1R mRNA and protein expression levels. (e) Detection of relative CSF1R mRNA expression level. (f–g) Detection of relative mRNA tumour necrosis factor (TNF)‐α and interleukin (IL)‐1β expression levels. * P < 0·05 indicates statistical significance compared with the HFLS or NC groups.
CSF1R promoted the proliferation of RA‐FLS and inhibited its apoptosis
In terms of the impact of CSF1R on the proliferation and apoptosis ability of RA‐FLS, the colony formation assay indicated that the number of RA‐FLS cells was significantly increased when CSF1R was over‐expressed, but remarkably decreased after knock‐down of CSF1R compared with the NC group (Fig. 4a,b, * P < 0·05). Apoptosis assay revealed that the apoptosis rate of RA‐FLS cells was remarkably decreased after transfection with pcDNA3.1‐CSF1R, but notably increased by inhibition of CSF1R (Fig. 4c,e, * P < 0·05). Moreover, we discovered that the percentage of RA‐FLS cells arrested in the G0/G1 phase was decreased, while the percentage in the G2/M phase was increased in the pcDNA3.1‐CSF1R group, which suggested a block in actual mitosis machinery. In addition, the effects of si‐CSF1R on the RA‐FLS cell cycle were opposite, with over‐expression CSF1R (Fig. 4d,f, * P < 0·05). The above results suggest that over‐expression of CSF1R could expedite the cell cycle and proliferation of rheumatoid arthritis cells, while restraining cell apoptosis.
Figure 4.
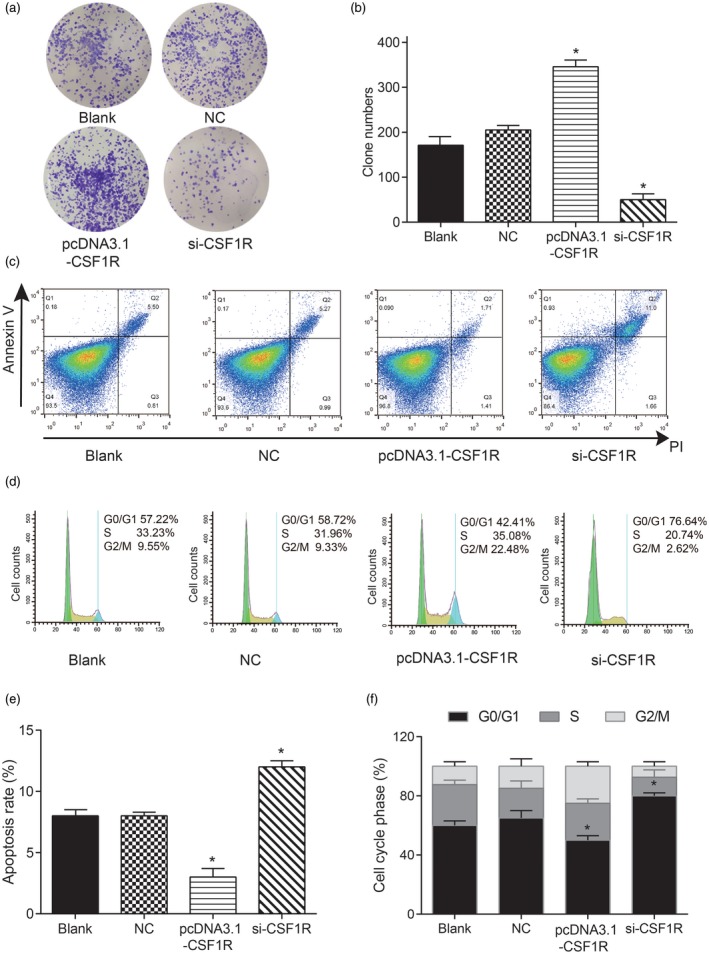
Colony‐stimulating factor receptor‐1 (CSF1R) promoted the proliferation of rheumatoid arthritis synovial cell (RA‐FLS) and inhibited its apoptosis. (a,b) Test of the number of cloned cells by colony formation assay. (c,e) Detection of apoptosis rate by cell apoptosis assay. (d,f) Test of cell cycle by flow cytometry. * P < 0·05 indicates statistical significance compared with the sterile saline (NC) group.
Imatinib could decrease the CSF1R expression level and mitigate inflammatory responses of RA‐FLS
We first explored the changes in the levels of TNF‐α and IL‐1β when imatinib concentrations differed in healthy osteoarticular synovial cell lines. As expected, different concentrations of imatinib (0·01, 0·1 and 1 μM) did not affect TNF‐α and IL‐1β levels under normal conditions (Fig. 5a,b). Next, we further investigated the changes in the levels of TNF‐α and IL‐1β after adding different concentrations of imatinib to RA‐FLS. The results showed that imatinib could resist the inflammatory reaction of RA‐FLS and reduce the damage in a concentration‐dependent manner (Fig. 5c,d, * P < 0·05, #P < 0·05,##P < 0·01). Based on consideration of the stability and simplicity of the experimental procedure, we finally chose the concentration of 1 μM imatinib as the fixed concentration for pursuant experiments. Next, RT–PCR and Western blot experiments suggested similar outcomes: when 1 μM imatinib was added to RA‐FLS the expression of CSF1R was significantly decreased, but the inhibition effect of 1 μM imatinib on CSF1R expression was compensated by pcDNA3.1‐CSF1R in the imatinib 1 μM + CSF1R group (Fig. 6a,b, * P < 0·05). Also, imatinib could significantly decrease the mRNA expression of TNF‐α and 1L‐1β, while TNF‐α and 1L‐1β expression was restored to normal levels after co‐transfection with pcDNA3.1‐CSF1R in the imatinib 1 μM + CSF1R group (Fig. 6c,d, * P < 0·05). These results show that imatinib alleviated the inflammatory response of the rheumatoid arthritis synovial cells by inhibiting the expression of CSF1R, and ultimately reduced the damage of RA‐FLS.
Figure 5.
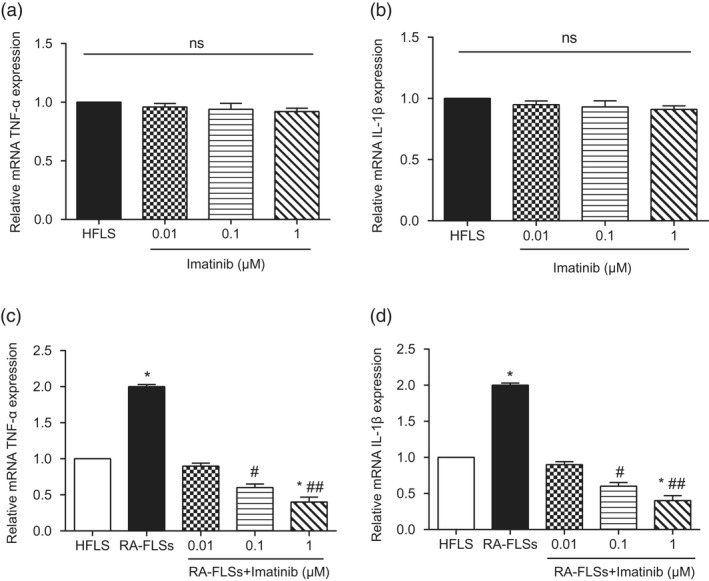
Imatinib could reduce the colony‐stimulating factor receptor‐1 (CSF1R) expression level and alleviate the damage of rheumatoid arthritis synovial cell (RA‐FLS). (a) Detection of relative mRNA tumour necrosis factor (TNF)‐α expression level. (b) Detection of relative mRNA interleukin (IL)‐1β expression level. (c) Detection of relative mRNA TNF‐α expression level. (d) Detection of relative mRNA IL‐1β expression level. * P < 0·05 indicates statistical significance compared with the human fibroblast‐like synoviocyte (HFLS) group. # P < 0·05 indicates statistical significance compared with the RA‐FLS group. ## P < 0·01 indicates statistical significance compared with the RA‐FLS group.
Figure 6.
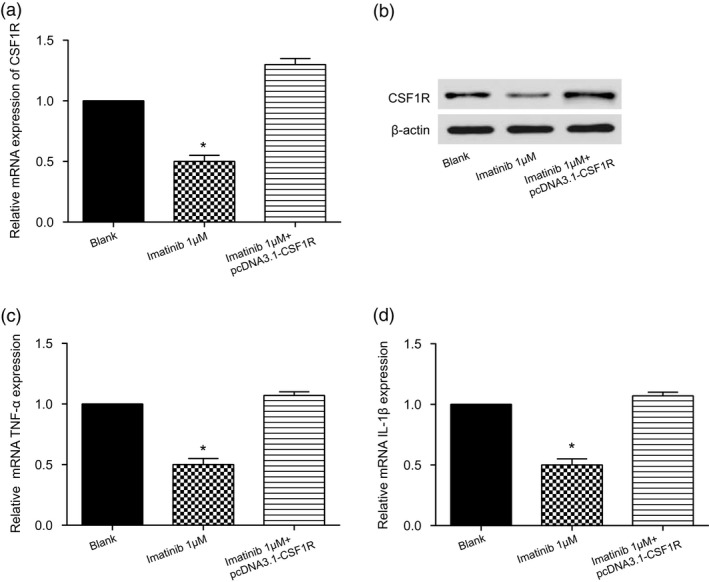
Imatinib could reduce the colony‐stimulating factor receptor‐1 (CSF1R) expression level and alleviate the damage to rheumatoid arthritis synovial cells (RA‐FLS). (a) Detection of relative CSF1R mRNA expression level. (b) Detection of relative CSF1R protein expression level. (c) Detection of relative mRNA interleukin (IL)‐1β expression. (d) Detection of relative mRNA IL‐1β expression. * P < 0·05 indicates statistical significance compared with the control group.
Imatinib inhibited the proliferation of RA‐FLS and enhanced apoptosis
In order to explore the regulatory functions of imatinib in cell proliferation, cell cycle and apoptosis in RA, we also performed a series of in‐vitro assays. The colony formation assay indicated that the number of clones was significantly decreased in the imatinib 1 μM group, while moderately increased by co‐transfection with pcDNA3.1‐CSF1R in the imatinib 1 μM + CSF1R group (Fig. 7a,b, * P < 0·05). The impacts of imatinib on cell cycle and apoptosis of RA‐FLS cells were detected, respectively, by flow cytometry. The apoptosis rate of RA‐FLS cells in the 1 μM imatinib group was significantly decreased, while the apoptosis rate recovered to normal level after co‐transfection with pcDNA3.1‐CSF1R in the imatinib 1 μM + CSF1R group (Fig. 7, * P < 0·05). Cell cycle experiments showed that the percentage of RA‐FLS cells in the G0/G1 phase was clearly increased in the imatinib 1 μM group, while there was no significant difference in the G2/M phase. Alternatively, the effect of 1 μM imatinib on the RA‐FLS cell G0/G1 phase was reversed by pcDNA3.1‐ CSF1R in the imatinib 1 μM + CSF1R group, and no changes appeared in the percentage of cells in the G2/M phase (Fig. 7, *P<0.05). The above results reflect that imatinib could inhibit the proliferation of RA‐FLS and enhance its apoptosis, which could reduce the inflammatory damage of RA‐FLS and finally alleviate the rheumatoid arthritis.
Figure 7.
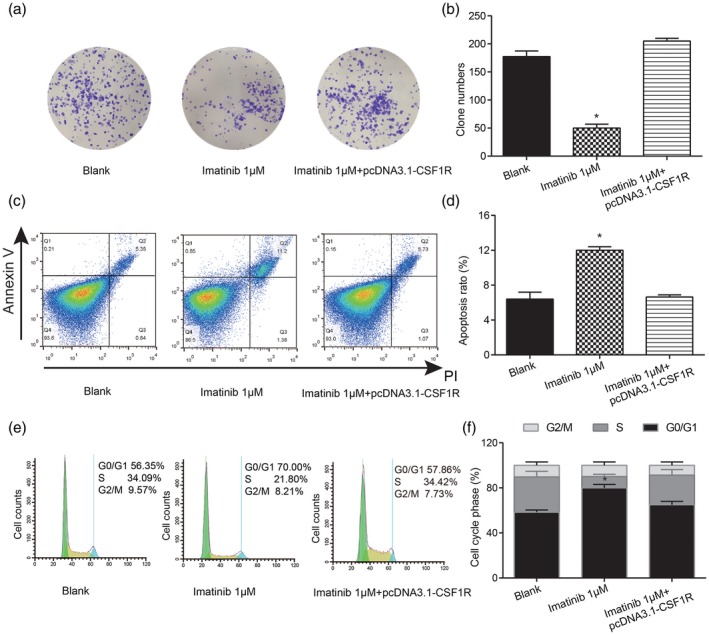
Imatinib inhibited the proliferation of rheumatoid arthritis synovial cells (RA‐FLS) and enhanced apoptosis. (a,b) Test of cell proliferation ability by colony formation assay. (c,d) Detection of apoptosis rate by cell apoptosis assay. (e,f) Test of cell cycle by flow cytometry. * P < 0·05 indicates statistical significance compared with the control group.
Imatinib improved RA symptoms in vivo via the inhibition of CSF1R
To further clarify the effect of imatinib on RA, an RA rabbit model was established for histological and serological assay. The knee‐joint lipoidal synovium H&E staining and cartilage toluidine blue staining showed arranged epithelial cells and cartilage cells in the sham group; while in the RA samples (NC group) the surface of cartilage is fibrosis, the cartilage cells in each layer have hyperplasia and vacuolar degeneration and irregular crannies form. Meanwhile, the knee‐joint synovium is stratified hyperplasia and inflammatory cells infiltrate. Imatinib treatment significantly put the pathological change into remission, while CSF1R reversed the medicable effect of imatinib on RA rabbits (Fig. 8a). Furthermore, we analysed the levels of TNF‐α (inflammatory factor), RF and anti‐CCP using the ELISA assay kit. TNF‐α, RF and anti‐CCP all showed high levels in the NC group in which RA was induced, compared with the sham group. In addition, imatinib clearly decreased the plasma levels of TNF‐α and RF, while co‐injection of CSF1R did the opposite (Fig. 8b,c); the knee‐joint diameter and weight were decreased in the arthritic rabbit compared to the sham. However, in the imatinib groups, increases in the knee joint diameter were lower than those observed in the NC group, and the weight decrease was also lower than that observed in the NC group (Fig. 8, Table 2).
Figure 8.
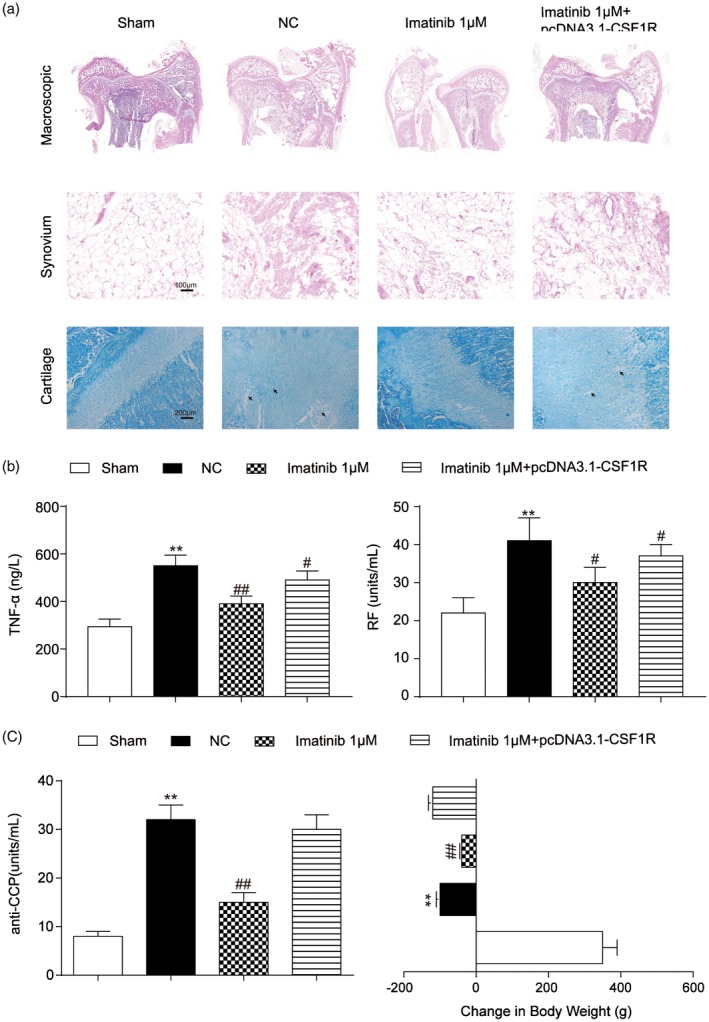
Imatinib improved rheumatoid arthritis (RA) symptoms via the inhibition of colony‐stimulating factor receptor‐1 (CSF1R). (a) The knee‐joint lipoidal synovium and cartilage of rabbits were observed by haematoxylin and eosin (H&E) or toluidine blue staining, respectively. (b) Detection of tumour necrosis factor (TNF)‐α (inflammatory factor) and rheumatoid factor (RF) by enzyme‐linked immunosorbent assay. (c) Detection of anti‐CCP level and body weight loss. **P < 0·01 indicates statistical significance compared with the sham group. #P < 0·05 and ##P < 0·01 indicate statistical significance compared with the sterile saline (NC) group.
Table 2.
Effect of imatinib and CSF1R on the knee joint diameter (mm) of rheumatoid arthritis rabbits
| Knee joint diameter (change %) | |||
|---|---|---|---|
| 0 | 1 day | 8 days | |
| Sham | 18·8 ± 0·4 | 19·1 ± 0·6 (101·6) | 18·7 ± 0·4 (99·5) |
| NC | 25·0 ± 0·5 | 24·6 ± 0·8 (98·4) | 24·3 ± 0·7 (98·8) |
| Imatinib 1 μM | 25·3 ± 0·8 | 23·6 ± 1·0 (93·3) | 22·5 ± 0·9 (88·9) |
| Imatinib 1 μM+pcDNA3·1‐CSF1R | 25·2 ± 1·1 | 24·8 ± 1·2 (98·4) | 24·7 ± 0·9 (98·0) |
Data are expressed as mean ± standard deviation (s.d.). CSF1R = colony‐stimulating factor receptor‐1; NC = sterile saline group.
Discussion
In this study, microarray analysis was employed to screen out the differential genes in rheumatoid arthritis, of which CSF1R was determined as the research gene based upon WGCNA analysis. CSF1R was found to be over‐expressed in RA‐FLS, which could promote proliferation and inhibit apoptosis. Conversely, imatinib could mitigate the inflammatory reaction of RA‐FLS, impede proliferation and facilitate apoptosis via down‐regulation of the expression of CSF1R. Ultimately, we demonstrated that imatinib alleviated rheumatoid arthritis by restraining CSF1R expression. These findings could provide new insight into the molecular research and drug treatment of rheumatoid arthritis.
CSF1 is a ligand for CSF1R that is involved in cell recruitment, differentiation and activation of tissue macrophages 20. It has been reported that CSF1 is able to signal myeloid progenitor cells to differentiate into monocytes, macrophages, dendritic cells and bone‐resorbing osteoclasts. A previous study has suggested that inhibition of CSF1R may exert an impact on inflammatory diseases or cancer, especially RA‐related diseases 21. There also exists a positive relationship between the high positive staining intensity of CSF1 and the prevalence of osteochondral lesions, such as bone erosion and osteoarthritis. Determination of CSF1 and CSF1R expression could be used as a predictor of pigmented villonodular synovitis 22. Emerging evidence indicates that CD14‐negative mononuclear cells from CSF1 can boost osteoclast formation, suggesting that the over‐expression of CSF1 in cells may play a critical role in the growth of pigmentation nodular synovitis (PVNS) 23. Similarly, we discovered that CSF1R was significantly up‐regulated in rheumatoid arthritis, and CSF1R could promote cell propagation and inhibit apoptosis of RA‐FLS.
Imatinib is a kinase inhibitor which readily restored the transformed phenotype of haematopoietic and fibroblast cell lines. Imatinib has been also been validated to inhibit the growth of the Bacl.2F5 macrophage cell line. The growth of the macrophage colony‐stimulating factor is effective for the growth of the macrophage colony‐stimulating factor 24. Some researchers have reported a complete remission after 2 months of imatinib in one patient with both chronic myelogenous leukaemia and RA 25. Imatinib has anti‐rheumatic activity, according to clinical trials 15, 26, while the efficacy and safety in the treatment of RA and related diseases remain to be studied further 27. It specifically inhibited proliferation of platelet‐derived growth factor (PDGF)‐stimulated synovial fibroblasts as a viable target for novel anti‐rheumatic therapies 28. It was first reported that imatinib targeted CSF‐1 receptor c‐Fms and inhibited the phosphorylation of c‐Fms 29. Imatinib inhibited the phosphorylation, ubiquitination and down‐regulation of normal Fms [the receptor for colony‐stimulating factor 1 (CSF‐1)] and inhibited its activation of down‐stream signalling pathways 24. Our research revealed that imatinib could inhibit the expression of CSF1R to suppress the proliferation of RA‐FLS and facilitate apoptosis, eventually relieving the inflammatory reaction of RA.
It is important to note that this study had some limitations. For example, we could further explore the CSF1/CSF1R signalling and internal network of molecules with RA. Furthermore, we noted that CSF1R over‐expression caused G2/M block, along with a decrease in the G0/G1 phase, while imatinib induced a block in the G0/G1 phase with no difference in the G2/M phase, but in the imatinib 1 μM + CSF1R group the percentage of RA‐FLS cells in the G2/M phase was no different to the control group; the deep mechanism in the combination of imatinib and pcDNA3.1‐CSF1R in the cell cycle may need more in‐depth exploration.
In summary, we determined high expression of CSF1R in RA and the effects of imatinib on cell propagation, apoptosis and cell cycle in RA‐FLS via regulation of CSF1R through a series of cellular function assays. Meanwhile, the find was clarified further through in‐vivo assay. Taken together, imatinib could exert an alleviative influence on inflammatory responses by repressing the expression of CSF1R, which provides a novel therapeutic target and promising drug for RA.
Ethical Committee approval
All the experiments involving rabbits were approved by the ethics committee of the Sun Yat‐sen Memorial Hospital, Sun Yat‐sen University.
Disclosures
None.
Author contributions
X. H. and J. T. made substantial contributions to conception and design. X. H. and Y. O. acquired the data. P. B., J. P. and Y. L. made the analysis and interpretation of data. W. D. performed the experiments. X. H. and J. T. were involved in drafting the manuscript and X. H., P. B., J. P., Y. O., W. D. and Y. L. were involved in revising it critically for important intellectual content. All authors gave final approval of the version to be published and agreed to be accountable for all aspects of the work.
Acknowledgements
No financial support was received for this study.
References
- 1. Zhao J, Zhao M, Yu C et al Multifunctional folate receptor‐targeting and pH‐responsive nanocarriers loaded with methotrexate for treatment of rheumatoid arthritis. Int J Nanomed 2017;12:6735–46. [DOI] [PMC free article] [PubMed] [Google Scholar]
- 2. Albuquerque J, Moura CC, Sarmento B, Reis S. Solid lipid nanoparticles: a potential multifunctional approach towards rheumatoid arthritis theranostics. Molecules 2015;20:11103–18. [DOI] [PMC free article] [PubMed] [Google Scholar]
- 3. Davignon JL, Hayder M, Baron M et al Targeting monocytes/macrophages in the treatment of rheumatoid arthritis. Rheumatology (Oxf) 2013;52:590–8. [DOI] [PubMed] [Google Scholar]
- 4. Loef M, Kroon FPB, Bergstra SA et al TNF inhibitor treatment is associated with a lower risk of hand osteoarthritis progression in rheumatoid arthritis patients after 10 years. Rheumatology (Oxf) 2018. [DOI] [PubMed] [Google Scholar]
- 5. Li H, Guan SB, Lu Y, Wang F, Liu YH, Liu QY. Genetic deletion of GIT2 prolongs functional recovery and suppresses chondrocyte differentiation in rats with rheumatoid arthritis. J Cell Biochem 2018;119:1538–47. [DOI] [PubMed] [Google Scholar]
- 6. Boechat AL, de Oliveira CP, Tarrago AM et al Methotrexate‐loaded lipid‐core nanocapsules are highly effective in the control of inflammation in synovial cells and a chronic arthritis model. Int J Nanomed 2015;10:6603–14. [DOI] [PMC free article] [PubMed] [Google Scholar]
- 7. Cioce M, Canino C, Goparaju C, Yang H, Carbone M, Pass HI. Autocrine CSF‐1R signaling drives mesothelioma chemoresistance via AKT activation. Cell Death Dis 2014;5:e1167. [DOI] [PMC free article] [PubMed] [Google Scholar]
- 8. Da Silva Figueiredo Celestino Gomes P, Panel N, Laine E. Pascutti PG, Solary E, Tchertanov L. Differential effects of CSF‐1R D802V and KIT D816V homologous mutations on receptor tertiary structure and allosteric communication. PLOS ONE 2014;9:e97519. [DOI] [PMC free article] [PubMed] [Google Scholar]
- 9. Soares MJ, Pinto M, Henrique R et al CSF1R copy number changes, point mutations, and RNA and protein overexpression in renal cell carcinomas. Mod Pathol 2009;22:744–52. [DOI] [PubMed] [Google Scholar]
- 10. Yang PT, Kasai H, Xiao WG et al Increased expression of macrophage colony‐stimulating factor in ankylosing spondylitis and rheumatoid arthritis. Ann Rheum Dis 2006;65:1671–2. [DOI] [PMC free article] [PubMed] [Google Scholar]
- 11. Nakano K, Okada Y, Saito K et al Rheumatoid synovial endothelial cells produce macrophage colony‐stimulating factor leading to osteoclastogenesis in rheumatoid arthritis. Rheumatology (Oxf) 2007;46:597–603. [DOI] [PubMed] [Google Scholar]
- 12. Paniagua RT, Chang A, Mariano MM et al c‐Fms‐mediated differentiation and priming of monocyte lineage cells play a central role in autoimmune arthritis. Arthritis Res Ther 2010;12:R32. [DOI] [PMC free article] [PubMed] [Google Scholar]
- 13. Xu J, Escamilla J, Mok S et al CSF1R signaling blockade stanches tumor‐infiltrating myeloid cells and improves the efficacy of radiotherapy in prostate cancer. Cancer Res 2013;73:2782–94. [DOI] [PMC free article] [PubMed] [Google Scholar]
- 14. Morandi A, Barbetti V, Riverso M, Dello Sbarba P, Rovida E. The colony‐stimulating factor‐1 (CSF‐1) receptor sustains ERK1/2 activation and proliferation in breast cancer cell lines. PLOS ONE 2011;6:e27450. [DOI] [PMC free article] [PubMed] [Google Scholar]
- 15. Eklund KK, Joensuu H. Treatment of rheumatoid arthritis with imatinib mesylate: clinical improvement in three refractory cases. Ann Med 2003;35:362–7. [DOI] [PubMed] [Google Scholar]
- 16. Koyama K, Hatsushika K, Ando T et al Imatinib mesylate both prevents and treats the arthritis induced by type II collagen antibody in mice. Mod Rheumatol 2007;17:306–10. [DOI] [PubMed] [Google Scholar]
- 17. Ando W, Hashimoto J, Nampei A et al Imatinib mesylate inhibits osteoclastogenesis and joint destruction in rats with collagen‐induced arthritis (CIA). J Bone Miner Metab 2006;24:274–82. [DOI] [PubMed] [Google Scholar]
- 18. Langfelder P, Luo R, Oldham MC, Horvath S. Is my network module preserved and reproducible? PLoS Comput Biol 2011;7:e1001057. [DOI] [PMC free article] [PubMed] [Google Scholar]
- 19. Kuhn M, von Mering C, Campillos M, Jensen LJ, Bork P. STITCH: interaction networks of chemicals and proteins. Nucleic Acids Res 2008;36:D684–8. [DOI] [PMC free article] [PubMed] [Google Scholar]
- 20. Martin‐Moreno AM, Roncador G, Maestre L et al CSF1R protein expression in reactive lymphoid tissues and lymphoma: its relevance in classical Hodgkin lymphoma. PLOS ONE 2015;10:e0125203. [DOI] [PMC free article] [PubMed] [Google Scholar]
- 21. Hume DA, MacDonald KP. Therapeutic applications of macrophage colony‐stimulating factor‐1 (CSF‐1) and antagonists of CSF‐1 receptor (CSF‐1R) signaling. Blood 2012;119:1810–20. [DOI] [PubMed] [Google Scholar]
- 22. Ota T, Urakawa H, Kozawa E et al Expression of colony‐stimulating factor 1 is associated with occurrence of osteochondral change in pigmented villonodular synovitis. Tumour Biol 2015;36:5361–7. [DOI] [PMC free article] [PubMed] [Google Scholar]
- 23. Taylor R, Kashima TG, Knowles H, Gibbons CL, Whitwell D, Athanasou NA. Osteoclast formation and function in pigmented villonodular synovitis. J Pathol 2011;225:151–6. [DOI] [PubMed] [Google Scholar]
- 24. Taylor JR, Brownlow N, Domin J, Dibb NJ. FMS receptor for M‐CSF (CSF‐1) is sensitive to the kinase inhibitor imatinib and mutation of Asp‐802 to Val confers resistance. Oncogene 2006;25:147–51. [DOI] [PubMed] [Google Scholar]
- 25. Miyachi K, Ihara A, Hankins RW, Murai R, Maehiro S, Miyashita H. Efficacy of imatinib mesylate (STI571) treatment for a patient with rheumatoid arthritis developing chronic myelogenous leukemia. Clin Rheumatol 2003;22:329–32. [DOI] [PubMed] [Google Scholar]
- 26. Eklund KK, Remitz A, Kautiainen H, Reitamo S, Leirisalo‐Repo M. Three months treatment of active spondyloarthritis with imatinib mesylate: an open‐label pilot study with six patients. Rheumatology (Oxf) 2006;45:1573–5. [DOI] [PubMed] [Google Scholar]
- 27. Eklund KK. Mast cells in the pathogenesis of rheumatic diseases and as potential targets for anti‐rheumatic therapy. Immunol Rev 2007;217:38–52. [DOI] [PubMed] [Google Scholar]
- 28. Sandler C, Joutsiniemi S, Lindstedt KA, Juutilainen T, Kovanen PT, Eklund KK. Imatinib mesylate inhibits platelet derived growth factor stimulated proliferation of rheumatoid synovial fibroblasts. Biochem Biophys Res Commun 2006;347:31–5. [DOI] [PubMed] [Google Scholar]
- 29. Dewar AL, Cambareri AC, Zannettino AC et al Macrophage colony‐stimulating factor receptor c‐fms is a novel target of imatinib. Blood 2005;105:3127–32. [DOI] [PubMed] [Google Scholar]


