

Abstract
Excitatory neurons are preferentially impaired in early Alzheimer’s disease but the pathways contributing to their relative vulnerability remain largely unknown. Here we report that pathological tau accumulation takes place predominantly in excitatory neurons compared to inhibitory neurons, not only in the entorhinal cortex, a brain region affected in early Alzheimer’s disease, but also in areas affected later by the disease. By analyzing RNA transcripts from single-nucleus RNA datasets, we identified a specific tau homeostasis signature of genes differentially expressed in excitatory compared to inhibitory neurons. One of the genes, BCL2 associated athanogene 3BAG3, a facilitator of autophagy, was identified as a hub or master regulator, gene. We verified that reducing BAG3 levels in primary neurons exacerbated pathological tau accumulation whereas overexpression attenuated it. These results support the conclusion that tau homeostasis underlies the cellular and regional vulnerability of excitatory neurons to tau pathology.
Life Science Reporting Summary
Further information on research design is available in the Nature Research Reporting Summary linked to this article.
Main
Neurodegenerative disorders are characterized by the accumulation of pathological proteins and the progressive loss of specific neuronal cell populations. The accumulation of misfolded tau aggregates is a defining feature of Alzheimer’s disease (AD) and Frontotemporal lobar degeneration linked to tau (FTLD-tau)1–3. Several types of neurons have been reported to be particularly vulnerable in AD4–9, Down’s syndrome10 and FTLD2, 3, 11. The distribution of neurons vulnerable to tauopathy follows a sequential pattern that suggests that cell populations in different regions of the brain are selectively at risk. More specifically, the morphology and location of cells within the EC and hippocampus that accumulate tau and degenerate in the earliest stages of AD suggest that EX neurons are preferentially impacted4, 12. Previous studies have addressed the question of why putative EX neurons could be particularly vulnerable to degeneration in aging, AD and other neurodegenerative disorders6, 13–15. Determinants of neuronal vulnerability might include cell size and location within neural circuits, signaling pathways controlling excitation, mechanisms regulating calcium and energy homeostasis, metabolism of disease-specific proteins, repertoires of signal transduction pathways and stress resistance mechanisms, and protein homeostasis dysfunction16–19. However, the exact molecular determinants underlying the selective vulnerability of EX neurons to tau pathology have not been established.
To explore these determinants, we employed four complementary approaches. First, using a series of cell-type specific markers on AD patient brains and a mouse model of tauopathy20 we showed that tau co-localizes predominantly with EX, compared to IN, neuron markers, not only in the EC but also in areas affected later in the disease such as the neocortex4. Second, using single-nucleus RNA-seq datasets from normal donors, we identified a significant difference between EX and IN neurons in genes involved in a branch of the protein homeostasis system that modulates the aggregation and clearance of tau. Third, using the weighted gene co-expression network analysis, we identified that BAG3, a putative aggregation protector21, 22, is a hub gene in the co-expression network relevant to tau homeostasis. Lastly, we confirmed that BAG3 is differentially expressed in human EX and IN neurons in non-AD and AD cases, and it impacts tau accumulation in primary neurons. Taken together, these results support the conclusion that tau homeostasis contributes to the selective, regional vulnerability of EX neurons to tau pathology and cell loss that defines AD, and they suggest that dysregulation of specific branches of the protein homeostasis system plays an important role in the initiation and spread of tau pathology in AD and the primary tauopathies.
Results
Excitatory and inhibitory neurons are differentially vulnerable to tau pathology in primary and secondary affected regions of EC-tau mice
Tau species recognized by human-specific antibodies such as MC1 (which targets misfolded tau) were co-localized with EX neuronal markers (TBR1 and SATB2), but there was almost no co-localization with IN neuronal markers (PVALB, SST and CALB2) in layers II-IV of the medial entorhinal cortex (MEC), perirhinal cortex (PRH) and neocortex (NC) of EC-tau mice20 at either 22 or 30+ months of age (Fig. 1a-c; Supplementary Fig. 1). These results are consistent with the observation of limited co-localization of human tau with IN neurons in the dentate gyrus of this mouse model23. In addition to being differentially vulnerable to pathological tau accumulation, EX neurons in the MEC were also differentially vulnerable to cell loss. The number of EX neurons was significantly reduced in the MEC, but not in the PRH or NC regions of EC-tau mice at 30+ months compared with 22 months (Fig. 1d). However, there was no significant difference in the number of IN neurons in EC-tau mice at 30+ months compared with 22 months (Fig. 1d). The number of MC1+ neurons was also significantly reduced in the MEC of EC-tau mice at 30+ months compared with 22 months (Fig. 1e), most likely due to the dramatic loss of EX neurons in that region (Fig. 1d). There was no significant difference in the number of EX neurons in non-transgenic (WT) mice between 22 months and 30+ months (Fig. 1f) indicating that the loss of EX neurons was not associated with aging, but with the maturation of tau pathology in the MEC. The increased number of MC1+ neurons in the PRH and NC of EC-tau mice at 30+ months (Fig. 1e) indicates the propagation and spreading of tau pathology from the primary to the secondary affected areas of the neocortex. Taken together, these results demonstrate that EX neurons are vulnerable to both the accumulation and the propagation of tauopathy in this mouse model of tauopathy.
Figure 1. Excitatory and inhibitory neurons are differentially vulnerable to tau pathology in primary and secondary affected regions of EC-tau mice.
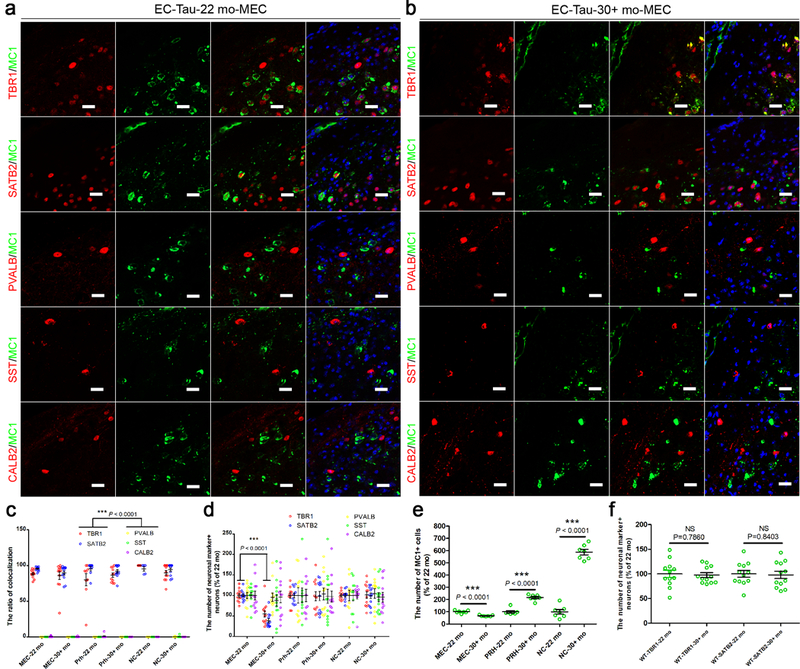
(a, b) Representative images of MC1-positive (+) tau staining co-localized with TBR1+ and SATB2+ excitatory (EX) neurons, but not PVALB+, SST+ or CALB2+ inhibitory (IN) neurons, in the MEC of EC-tau mice at 22 months (a) and at 30+ months (b). Three independent experiments were repeated with similar results. Scale bar, 20 μm. c) Co-localization ratio of MC1+ tau with neuronal marker+ neurons, which was quantified in the MEC, PRH and NC (layers II-IV) of EC-tau mice at 22 and 30+ months. (d, e) Number of neuronal marker+ neurons (d) and MC1+ cells (e), which was counted in the above regions of EC-tau mice at 22 and 30+ months. (f) Number of TBR1+ and SATB2+ EX neurons, which was compared in the MEC of non-transgenic (WT) mice at 22 and 30+ months. Data are presented as mean ± SEM (n = 6 animals, 2 sections each animal. If the section does not have any MC1+ neurons, it will be removed out of the analysis, e.g. PRH-22 mo: n = 9; PRH-30+ mo: n = 11; NC-22 mo: n = 6; NC-30+ mo: n = 11 independent sections) (c, d, f) and (n = 7 independent experiments, each value is the average of 12 biological independent sections) (e). Statistical significance was assessed by Kruskal-Wallis test with the Dunn’s multiple comparison test (c) and one-way ANOVA with Tukey’s post-test (d). *** P < 0.0001 vs PVALB, SST and CALB2 (the same brain regions and ages of the mice) (The Kruskal-Wallis statistic is 53.16, 53.09, 41.17, 49.65, 29.37 and 48.02, respectively.) (c); *** P < 0.0001 vs 30+ months (the same brain regions and neuronal markers) (The R squared = 0.6996, F = 34.16) (d). In (e, f), statistical significance was assessed by two-tailed unpaired t test. NS, not significant; *** P < 0.0001 vs 22 months (The statistic is t=6.921, df=12; t=8.833, df=12; t=16.56, df=12 (e); t=0.2748, df=22; t=0.2040, df=22 (d), respectively.).
EX and IN human neurons are differentially vulnerable to tau pathology in primary and secondary affected regions of AD brain
In order to explore whether or not pathological tau also differentially impacts human EX neurons in AD, we performed co-localization studies on post-mortem brain tissues at different stages of AD assessed by the Braak staging protocol4. Consistent with the mouse data, we found that MC1+ tau pathology was mainly co-localized with EX neuronal markers, but not IN neurons in layers II-IV of the EC and in secondary affected regions such as the prefrontal cortex (Brodmann area 9, BA9) at early and late Braak stages (Fig. 2a-c; Supplementary Fig. 2). Moreover, the number of EX neurons was significantly reduced in the mid-late stage AD brain (Braak stages III-IV and V-VI) compared with non-AD controls (Braak stages I-II) (Fig. 2d, e). Tau pathology was not evident in microglia (IBA1+) or astrocytes (GFAP+). The co-localization of pathological forms of tau with neuronal markers in both EC-tau mice and human AD was further confirmed with phosphorylation-site specific tau antibodies. Consistent with the MC1 data, we found that EX neurons (SATB2+), but not IN neurons (GAD1+), co-localized with phospho-tau specific antibodies including AT8 (Ser202/Thr205), PHF1 (Ser396/Ser404), pS422-Tau (Ser422), and AT100 (Thr212/Ser214) (Supplementary Fig. 3). Overall, these data suggest that in human brains EX and IN neurons are differentially vulnerable to tau pathology in primary and secondary affected regions in AD. This conclusion is also consistent with previous reports of the selective vulnerability of pyramidal neurons in AD4, 6, 12.
Figure 2. EX and IN human neurons are differentially vulnerable to tau pathology in primary affected regions of AD brain.
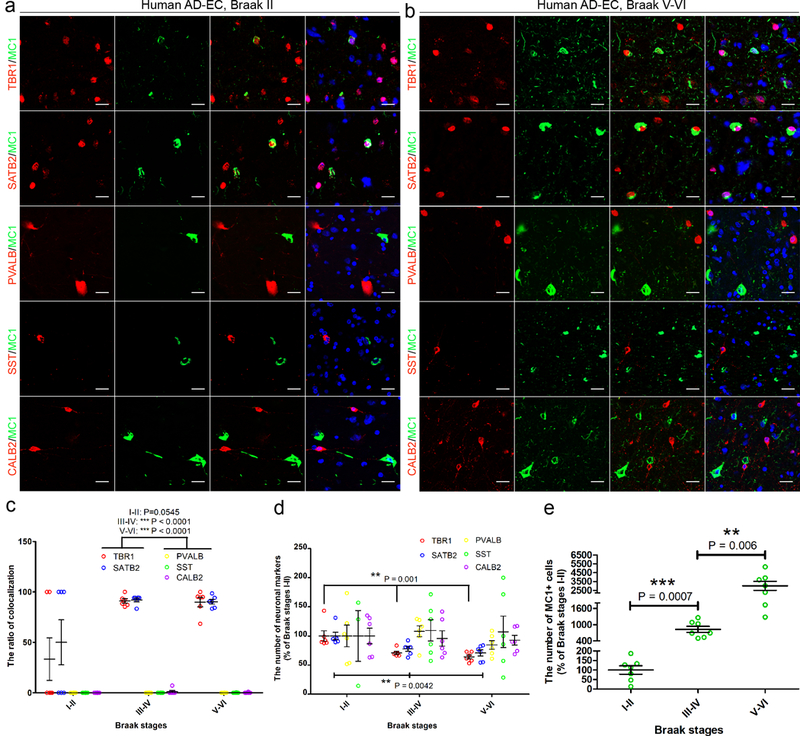
(a, b) Representative images of MC1-positive (+) tau staining co-localized with TBR1+ and SATB2+ EX neurons, but not PVALB+, SST+ or CALB2+ IN neurons, in the EC of AD patient brain at Braak stage II (a) and Braak stage V-VI (b). Three independent experiments were repeated with similar results. Scale bar, 20 μm. (c) Co-localization ratio of MC1+ tau with neuronal marker+ neurons, which was quantified in the EC layer II-IV of AD brains at different Braak stages; data are presented as mean ± SEM (n = 3 cases, 2 sections each case), and the statistical significance was assessed by Kruskal-Wallis test with the Dunn’s multiple comparison test. *** P < 0.0001 vs PVALB, SST and CALB2 (the same Braak stage) (The Kruskal-Wallis statistic is 9.280, 25.82 and 24.90, respectively.). (d, e) Number of neuronal marker+ neurons (d) and MC1+ cells (e), which were assessed in EC layer II-IV of AD brains at different Braak stages; data are shown as the percentage of the average number of neuronal marker+ cells at Braak stage I-II and are presented as mean ± SEM (n = 3 cases, 2 sections each case), and the statistical significance was assessed by one-way ANOVA with Tukey’s multiple comparison post hoc tests (The R squared = 0.6026, F = 11.37; R squared = 0.5187, F = 8.082) (d) or two-tailed Unpaired t test with Welch’s correction (e). ** P < 0.01; *** P < 0.001 vs Braak stage I-II (The statistic is t=6.369, df=6; t=4.150 df=6).
Single-nucleus RNA-seq analysis reveals a specific tau homeostasis signature in EX neurons in the human brain
We hypothesized that the selective vulnerability of EX neurons to tau pathology could be determined by an intrinsic difference in the cellular environment in terms of the specific branch of the protein homeostasis system that regulates tau aggregation. To test this idea and to begin to identify this ‘tau homeostasis system’, we analyzed two independent single-nucleus RNA-seq datasets obtained from post-mortem brain tissues of healthy adults without AD pathology24, 25. We found that the mRNA levels of genes encoding the proteins making up a metastable subproteome (MS)26, and tau co-aggregators and aggregation promoters19 were increased, but the mRNA levels of tau aggregation protector genes19 were decreased in EX neurons compared with IN neurons. Furthermore, differential expression of the tau homeostasis genes was seen in regions affected early (BA21 including EC, BA22, BA10, BA41; Hippocampus) and late (BA17; BA9) in AD (Fig. 3a-d; Supplementary Table 1, and Supplementary Figs. 4 and 5). Overall, a statistically significant and consistent pattern emerged from the analysis of the two datasets indicating that genes encoding proteins involved in tau homeostasis (tau aggregation promoters and protectors, and tau co-aggregators) and proteins in the MS were differentially regulated in cells that are vulnerable to tauopathy compared to those that are resistant to it. Taken together (Supplementary Fig. 6), these results indicate that dysregulated tau homeostasis is closely linked to the etiology of tauopathy.
Figure 3. Single-nucleus RNA-seq analysis reveals a specific tau homeostasis signature in EX neurons in human brains.
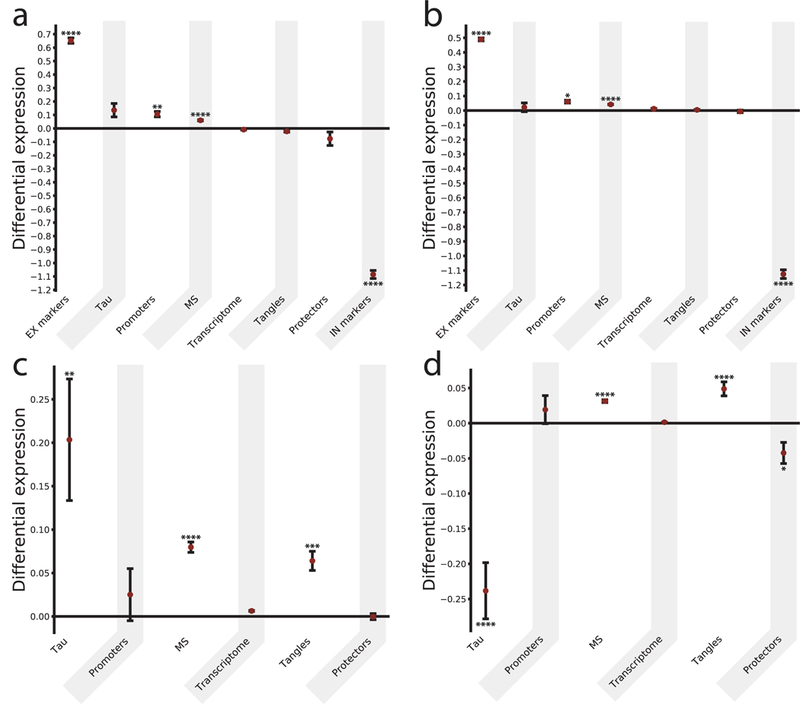
(a, b) Comparison of the differential expression of relevant subproteomes for different cell types. For each subproteome (and the whole transcriptome as a control), the difference between the mean expression in EX and IN neurons (measured by the Δ score, see Methods) was calculated, and the values are presented as mean ± SEM. In (a, b) results are reported for the SNS and the DroNc-Seq datasets, respectively. (c, d) Comparison of Δ scores for five subproteomes (and the whole transcriptome as a control) within the EX neurons, between regions affected relatively early or late in AD for the SNS and DroNc-Seq datasets, respectively. The significance was evaluated by building a null model for each subproteome (see Methods, Supplementary Table 1 and Supplementary Figures 4–6) and corrected with a Benjamini-Hochberg multiple hypothesis testing correction *p<0.05, **p<0.01, ***p<0.001, ****p<0.0001. Subproteomes (where nsns and ndrnc are the sample sizes corresponding to SNS and DroNc-seq datasets respectively): EX markers (excitatory markers, a set of genes specific for excitatory neurons): nsns=ndrnc=2; promoters (a set of proteins promoting tau aggregation): nsns=ndrnc=6; MS (metastable subproteome, a subset of highly expressed and aggregation-prone proteins, which are supersaturated – i.e. proteins whose concentration in the cellular environment is higher than a critical value keeping them soluble and functional – and downregulated in AD): nsns=162, ndrnc=179; transcriptome (the whole transcriptome, here reported as a negative control); tangles (proteins co-aggregating with tau and found in neurofibrillary tangles): nsns=57, ndrnc=68; protectors (a set of proteins protecting tau from aggregating): nsns=ndrnc=6; IN markers (inhibitory markers, a set of genes specific for inhibitory neurons): nsns=ndrnc=3.
Glial cells have higher levels of aggregation protectors than neurons
We observed that the subproteomes most relevant to tau homeostasis show a specific signature for neurons compared to glial cell types (microglia, oligodendrocytes and astrocytes). Overall, we observed statistically significant increased mRNA levels of genes protecting from tau aggregation in glia cells, which was combined with relatively low level expression of tau, together with low mRNA levels of genes promoting tau aggregation, and encoding its co-aggregators (Fig. 4 and Supplementary Table 2). These data were consistent with the observation that glia cells in the AD brain did not accumulate detectable levels of pathological tau (Supplementary Fig. 2).
Figure 4. Single-nucleus RNA-seq analysis shows high levels of tau aggregation protectors in glia.
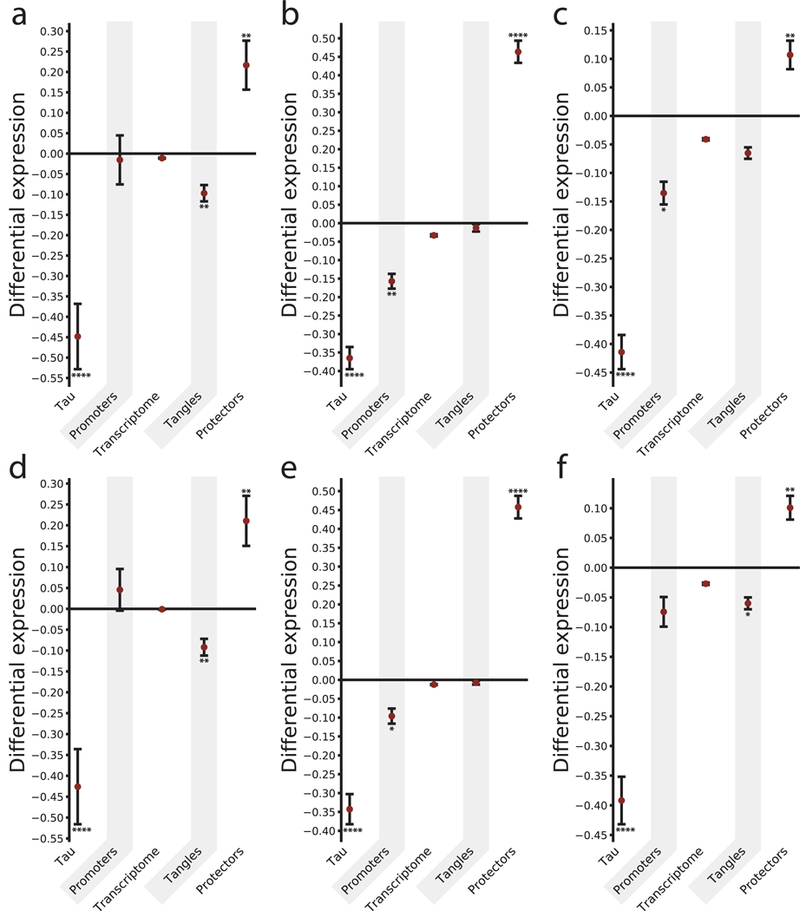
Differential expression of relevant subproteomes for different cell types. For each subproteome (and the transcriptome of reference as a control) the difference between the mean expression in glia and neurons (measured by the Δ score, see Methods), within cell-types from different regions was calculated. In (a, b, c) differential expression values between glia and EX neurons are reported. Specifically, results are reported for (a) microglia (MG), (b) astrocytes (ASC1, ASC2), and (c) oligodendrocytes (ODC1, ODC2), respectively. (d, e, f) Differential expression between glia and IN neurons are reported, with values corresponding to (d) microglia (MG), (e) astrocytes (ASC1, ASC2), and (f) oligodendrocytes (ODC1, ODC2), respectively. For each bar, the significance was evaluated by building a null model for each subproteome and corrected with a Benjamini-Hochberg multiple hypothesis testing correction *p<0.05, **p<0.01, ***p<0.001, ****p<0.0001 (see Methods, Supplementary Table 2 and Supplementary Figures 8–10). Results are reported for the DroNc-Seq dataset. Subproteomes: tau (MAPT gene); the definition of promoters, transcriptome, tangles, and protectors, and the sample sizes are the same as Figure 3.
BAG3 is a hub gene in the co-expression network relevant to tau homeostasis
In order to identify a key master regulator responsible for modulating tau aggregates among the subproteomes linked to tau homeostasis we performed a co-expression network analysis27 on the SNS dataset. This type of analysis quantifies the covariation of genes within given samples or brain regions (cell types in our case), by measuring a quantity of reference, like the Pearson’s correlation coefficient. In this network, each gene is represented by a node and the co-expression values correspond to the weights associated with each link connecting two nodes. Although more complex approaches are possible27, a direct way to identify the hub genes that are central in the network is to sum the weights of all the links connected to a gene which is defined as the total degree of a node. When the top 10% of the genes in the higher degree were isolated (highlighted with the labels in Figure 5), the only gene belonging to both the protector subproteome and to the top 10% of the most co-expressed genes was BAG3. All the rest of the genes belonged either to the metastable subproteome or to the tangles, and no genes belonging to the promoter group was found among the hub genes (see Supplementary Table 3).
Figure 5. Co-expression network analysis of the subproteomes relevant to tau homeostasis.
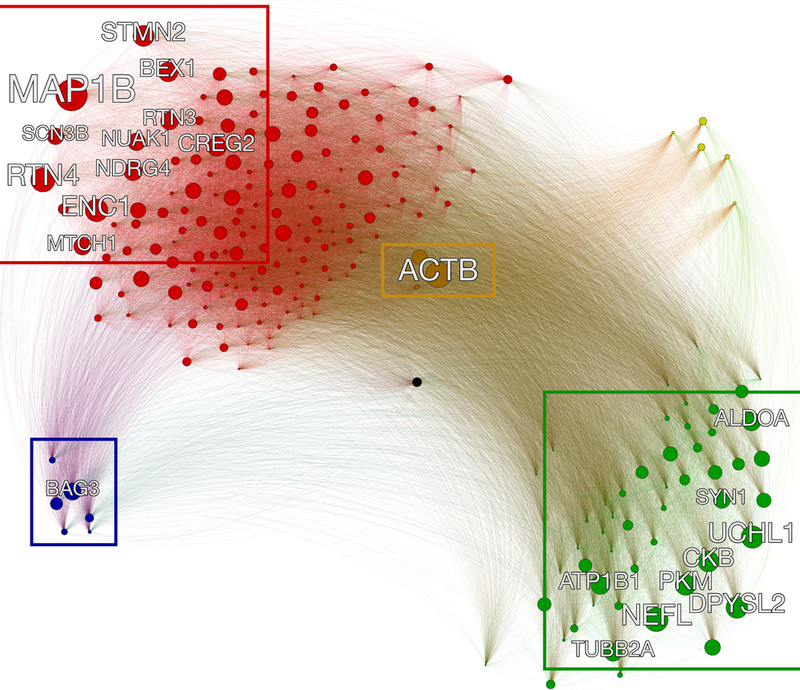
Sketch of the co-expression network to identify hub genes of the subproteomes related to tau homeostasis. The network is fully connected, and the edges linking the genes (nodes) are weighted with the Pearson’s correlation coefficient. The hubs, which are defined as the genes more tightly co-expressed with every other gene in the network, and here defined as master regulators, are highlighted with the labels (top 10% of the most co-expressed genes). The size of each node is proportional to the sum of the weights of the edges connected to it. BAG3 is a hub in the protectors region of the network (lower left). The color code identifies the different subproteomes: MS (red), tangles (green), protectors (blue), promoters (yellow), tau (black), and with the genes shared between MS and tangles colored in brown.
Validation of the localization and expression levels of representative tau homeostasis signature genes by single-molecule FISH in human EC and prefrontal cortex
We next validated the results of the single-nucleus RNA-seq analysis of several AD-related genes including MAPK1 (tau co-aggregators), FKBP5 (tau aggregation promoter), ENC1 (MS) and MAPT (the gene encoding tau) using the single-molecule RNA FISH assay. The mRNA levels of MAPK1, FKBP5 and ENC1 were significantly higher in EX neurons than in IN neurons in both EC and BA9 while there was no significant difference in the mRNA levels corresponding to MAPT (Fig. 6). These results support the conclusion that in vulnerable regions, EX neurons exhibit a cellular environment more conducive to tau aggregation and susceptibility to tau homeostasis dysfunction than IN neurons.
Figure 6. Validation by single-molecule FISH of the localization and mRNA expression levels of representative tau homeostasis signature genes in human EC and prefrontal cortex.
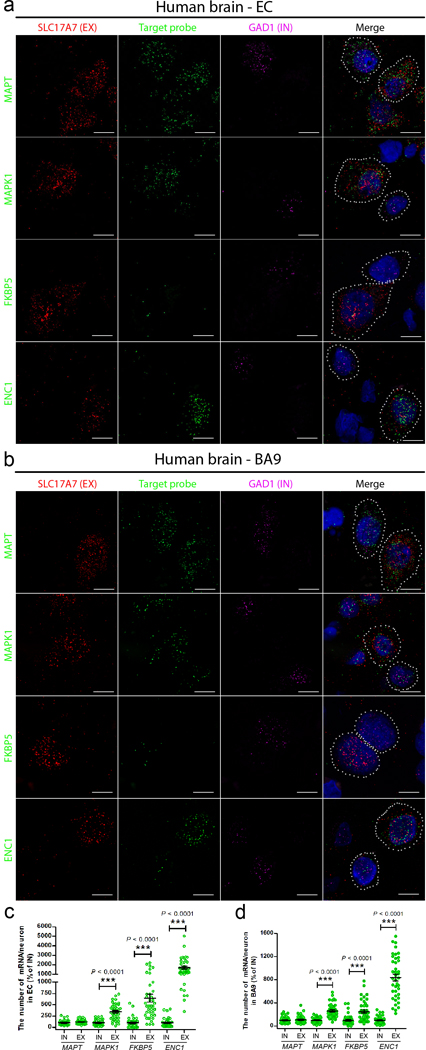
(a, b) Representative sm-FISH images of the co-staining of EX neuronal marker (SLC17A7, red), IN neuronal marker (GAD1, purple), and target probe (MAPT, MAPK1, FKBP5 and ENC1, green) in the EC (a) and the BA9 (b) of human brain without pathological hallmarks of neurodegenerative diseases (54–66 years old); dotted ovals represent individual EX or IN neurons. Three independent experiments were repeated with similar results. Scale bar, 10 μm. (c, d) Comparison of the number of single RNAs of the target probe in individual EX and IN neuron in the EC (c) and the BA9 (d) regions (n = 4 human brains, 10 neurons from each case). Data are presented as mean ± SEM. The statistical significance was assessed by two-tailed unpaired t test with Welch’s correction. *** P < 0.0001 vs IN neurons (The statistic is t=8.061, df=47; t=6.181 df=42; t=10.77, df=39 (c); and t=7.981, df=48; t=4.675, df=56; t=12.60, df=41 (d), respectively.).
Validation of BAG3 protein levels in IN neurons and EX neurons of unaffected and AD brain tissue.
To validate whether the protein level of one of the genes identified by the RNA analysis was differentially regulated between IN and EX neurons, and whether this was seen in both unaffected (non-AD) and AD brain we examined the levels of BAG3 by immunofluorescence staining in the BA9 region of post-mortem human tissue. The level of BAG3 in NeuN+ neurons that labelled with the IN cell marker GAD1 (GAD1+/NeuN+) was significantly higher in both non-AD and in AD neurons than in NeuN+ neurons that were negative for GAD1 (GAD1-/NeuN+ cells (P < 0.001, Supplementary Fig. 7). These cells were presumed to be mostly EX as the great majority of NeuN+/GAD1- neurons co-label with EX neuron markers (data not shown). Of note, the level of BAG3 protein was much higher in non-neuronal cells (NeuN- cells) than in neurons (NeuN+ cells) (Supplementary Fig. 7a). These results are consistent with our findings of almost no accumulation of pathological tau in IN neurons and glial cells.
Modulating the expression of BAG3 affects tau accumulation in primary cortical neurons
In order to further validate our results and confirm that genes identified through the bioinformatics analysis can contribute to the vulnerability of neurons to tauopathy, we manipulated the mRNA levels of BAG3, a master regulator gene and one of the major tau aggregation protectors associated with tau homeostasis21 that was enriched in inhibitory neurons (Supplementary Table 1). BAG3 was of particular interest as it interacts with the co-chaperone HSPB8, which was also more highly expressed in IN neurons than in EX neurons (Supplementary Table 1). We found that knockdown of BAG3 using shRNA lentivirus in primary neurons from wild-type mice (Fig. 7a and Supplementary Fig. 11) induced the accumulation of endogenous tau recognized by the 12E8 antibody, mainly in neurites (Figs. 7b and 7c, P < 0.01). In primary neurons expressing tau RD-P301S-YFP (an FTLD causing mutation), knockdown of BAG3 led to an accumulation of tau in both cell bodies and neurites (Figs. 7d-f, P < 0.01). Overexpression of BAG3 significantly attenuated tau accumulation in EX neurons (Figs. 7d and 7e, P < 0.01). There was a trend towards decreased tau accumulation in IN neurons where BAG3 was overexpressed but the data did not reach significance (Fig. 7f, P = 0.098) most likely due to the very low level of tau aggregates in IN neurons in general. These results support our conclusion that genes associated with tau protein homeostasis contribute to neuronal vulnerability to tau pathology.
Figure 7. Modulating the expression of one of the tau aggregation protectors, BAG3, affects tau accumulation in primary cortical neurons.
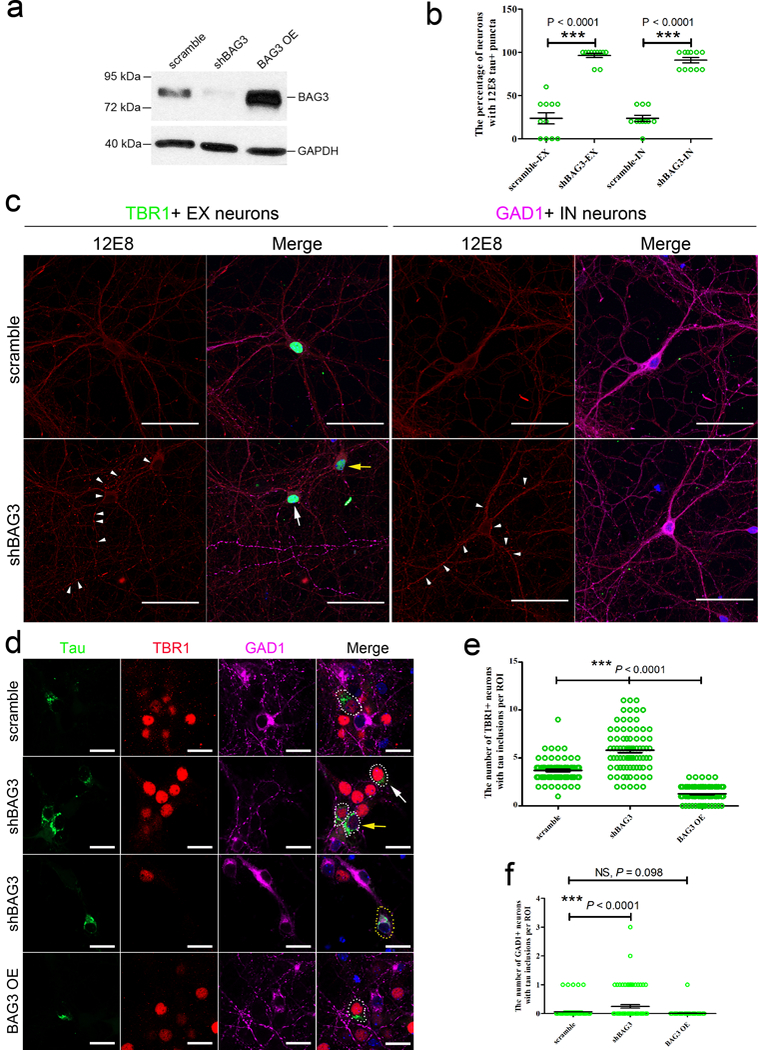
(a) Representative western blot images of primary cortical neurons transduced with lentivirus expressing scrambled BAG3 or shBAG3, or overexpressing BAG3 (OE) as described in Online Methods. GAPDH is a housekeeping protein used as the loading control. Three independent experiments were repeated with similar results. Full length of the blot can be found in the Supplementary Fig. 11. (b) The percentage of EX and IN neurons (n = 55 from 11 coverslips each group) with 12E8 (pS262 and/or pS356 tau)-positive (+) puncta (≥ 5) in the neurites was quantified as described in Online Methods. (c) Representative immunocytochemical images of 12E8+ (red) puncta (white arrow heads) in the neurites of TBR1+ (green) EX neurons. White arrow indicates a neuron with high expression of TBR1; yellow arrow indicates a neuron with low expression of TBR1. GAD1+ (purple) IN neurons were also transduced with shBAG3 lentivirus and tau was shown to accumulate in neurites (white arrowheads). Three independent experiments were repeated with similar results. (d) Representative immunocytochemical images of tau inclusions (green) in TBR1+ (red) EX neurons (white dotted circle) (white arrow, high expression of TBR1; yellow arrow, low expression of TBR1) and tau inclusions (green) in GAD1+ (purple) IN neurons (yellow dotted circle) transduced with different lentiviruses as described in Online Methods. The nuclei were counterstained with Hoechst33342 (blue). Three independent experiments were repeated with similar results. Scale bars, 50 μm (c); 20 μm (d). (e, f) The quantitation of the number of TBR1+ EX and GAD1+ IN neurons with tau inclusions (n = 80 region of interests (ROI) from 4 coverslips per group). (b, e and f) Data are presented as mean ± SEM. Statistical significance was assessed by nonparametric Kruskal-Wallis test with the post hoc test of Dunn’s multiple comparisons. *** P < 0.0001 vs neurons transduced with scramble BAG3 (The Kruskal-Wallis statistic is 34.54, 164.6 and 20.09, respectively.).
Discussion
Understanding the molecular origins of selective cellular vulnerability is of fundamental importance for all of the neurodegenerative diseases28. Unfortunately, the molecular determinants of selective vulnerability have so far remained unclear, in part because we lack sufficient information on the molecular makeup of subpopulations of cells that are compromised in a particular brain region, by a particular protein, and in a particular disease. In this study, we addressed this problem with regard to tau using a mouse model of tauopathy, as well as human AD brains at different Braak stages. The EC-tau mouse model20, 29 demonstrates progressive tauopathy that originates in the hippocampal formation but spreads to extrahippocampal and neocortical areas with age30. Because the model shows spread of the pathology we can dissociate primary vulnerability from secondary vulnerability that occurs as a result of non-cell autonomous tauopathy propagation. Primary vulnerability is seen in neurons of the MEC that develop tau pathology early, whereas secondary vulnerability is seen in neurons of the PRH and NC which develop pathology much later. We demonstrated that tau aggregates predominantly accumulate in EX neurons compared to IN neurons, not only in the primary affected region but also in secondary regions suggesting that EX neurons are vulnerable to both cell autonomous and non-cell autonomous accumulation of tau as tauopathy propagates.
Previous studies have explored why putative EX neurons could be particularly vulnerable to degeneration in AD and other neurodegenerative disorders6, 13–15. However, mechanisms underlying selective vulnerability of EX neurons to tau pathology have not been identified and tested. Our approach to answering this question was prompted by recent observations that age-related stress and dysfunction of protein homeostasis are observable in vulnerable neurons in aging and age-related neurodegenerative diseases14, 16–18. In particular, a transcriptional analysis of healthy brains at ages well before the typical onset of AD identified a protein homeostasis signature associated with protein aggregation, and predicted the Braak staging of AD19. The protein homeostasis signature included a set of aggregation-prone proteins (metastable subproteome)26 and three other sets of protein homeostasis components (co-aggregators, aggregation promoters, and aggregation protectors)18. The overall relative expression of the protein homeostasis signature was elevated significantly in neurons compared with other cell types indicating that neurons have a cellular environment most conducive to protein aggregation compared to other brain cell types19.
Based on these results, we hypothesized that an intrinsic difference in the tau homeostasis system could contribute to the selective vulnerability of EX neurons to tau pathology. After analyzing two independent single-nucleus RNA-seq datasets from healthy donors we showed that EX neurons are characterized by elevated expression of a specific subset of aggregation-prone proteins (the metastable subproteome) and tau aggregation promoters, as well as by the decreased expression of tau aggregation protectors. These findings suggest that the selective vulnerability of EX neurons to tau aggregation, particularly in regions of the brain that are affected early on in AD, could be due to the intrinsic susceptibility of EX neurons to dysregulation of the branch of the protein homeostasis system that regulates tau aggregation. Since there are currently only two single-nuclei RNA-seq datasets from post-mortem human brain tissue publically available and they do not contain the exact same regions of the brain, we could not compare region-matched datasets. However, we still found that tau homeostasis gene signatures differed between EX and IN neurons in early and late affected region, even though the regions considered were not the same.
In support of this idea is the finding of relatively high expression of tau aggregation protectors in IN neurons and other cell types such as microglia that are resistant to pathological tau accumulation, in agreement with previous findings19. Differential regulation of several of the genes were validated at the mRNA level, and the protein level of one, BAG3, a master regulator belonging both to the “protectors” subproteome and to the top 10% of most co-expressed genes, was shown to be significantly higher in IN neurons than in putative EX (NeuN+/GAD1-) neurons in both non-AD and AD cases supporting our finding that tau does not accumulate in IN neurons in AD brain. Furthermore, when we attenuated the level of BAG3 in primary neurons, the vulnerability of the cells to accumulate tau was significantly enhanced. As the promoter used to drive expression of the BAG3 shRNA or cDNA is not specific for neuron types, BAG3 mRNA was modulated in both EX and IN neurons. We expected the levels of tau to be attenuated in both EX and IN neurons in response as our RNA data had shown that the gene is differentially, not selectively regulated between the two neuron types, but it was noteworthy to observe that when BAG3 expression was reduced, tau accumulated in GAD+ IN neurons. We have only observed tau accumulating in IN neurons very rarely in the mouse or human studies. Conversely, vulnerability was reduced in neurons when BAG3 was overexpressed. This data confirms that the gene is impactful in IN neurons.
Our results indicate that neurons (and EX neurons in particular) represent a cellular environment more vulnerable to pathological tau accumulation compared to glial cell types which is consistent with the finding that tau does not accumulate appreciably in glia in the AD brain. However, tau has been shown to accumulate in glia (tufted astrocytes and oligodendrocytes) in some, but not all of the primary tauopathies31–33. Why tau should accumulate in glia in some tauopathies is not known but it likely results from a combination of different forms of tau in different tauopathies, and the sets of homeostasis genes in each cell type that control their likelihood to accumulate.
Our results are consistent with the known effects of impaired protein homeostasis on pathogenesis in age-related neurodegenerative diseases14, 16–18. Our findings characterize a subset of proteins that are highly specific for tau homeostasis and they complement previous studies on protein subnetworks responsible for protein homeostasis in different neurodegenerative disorders34. We anticipate that further demonstrations of the complex and highly regulated interactions between different protein homeostasis components will reveal more determinants of the vulnerability of specific neuron types. Lastly, our findings emphasize the importance of pursuing novel therapeutic strategies of enhancing natural defense mechanisms that maintain our proteome in a soluble state35, 36, and the use of protein homeostasis enhancing therapeutics, especially if they can be designed to target specific cell types, such as vulnerable EX neurons.
ONLINE METHODS
Reagents.
Human conformation-dependent tau (MC1) and human/murine phospho-tau pSer396/ Ser404 (PHF1) monoclonal antibodies were provided by Dr. Peter Davies. Mouse anti-phosphorylated tau Ser262 and/or Ser356 (12E8) antibody37 is a kind gift from Dr. Philip Dolan. Human/murine phospho-tau pSer202/Thr205 (AT8, Cat# MN1020) and pThr212/Ser214 (AT100, Cat# MN1060) monoclonal antibodies, rabbit anti-phospho-tau pSer422 (pS422, Cat# 44–764G) and parvalbumin (PVALB, Cat# PA5–18389) polyclonal antibodies, Alexa Fluor dye-labeled cross-absorbed goat and donkey secondary antibodies (Cat# A-11029, A-11037, A-11007, A-11058, and A-21202), SlowFade gold (Cat# S36937) and ProLong gold (Cat# P36934) antifade reagents were purchased from Thermo Fisher Scientific. Rabbit anti-TBR1 (Cat# ab31940) and SATB2 (Cat# ab92446) polyclonal antibodies were purchased from Abcam. Rat anti-somatostatin (SST) (Cat# MAB354) and mouse anti-NeuN (Cat# MAB377) monoclonal antibody and goat anti-GAD1 (Cat# AF2086) polyclonal antibody were purchased from Millipore and R&D Systems, respectively. Rabbit anti-calretinin (CALB2) (Cat# 7697), IBA-1 (Cat# 019–19741), and GFAP (Cat# G9269) polyclonal antibodies were purchased from Swant, Wako and Sigma-Aldrich, respectively. RNAscope Multiplex Fluorescence Kit (Cat #320851) and human specific RNA probes including SLC17A7 (Cat# 415611 or 415611-C2), GAD1 (Cat# 404031-C3), MAPT (Cat# 472621), MAPK1 (Cat# 470741), FKBP5 (Cat# 481101) and ENC1 (custom probe) were purchased from Advanced Cell Diagnostics. TrueBlack lipofuscin autofluorescence quencher (Cat# 23007) was purchased from Biotium. Lentiviral vectors FG12-scramble and FG12-shBAG3 were prepared as previously described21, and the GFP in these vectors was removed by cutting with AgeI and BsrGI followed by fill-in of 5’ overhangs and re-ligation. The shRNA-resistant BAG3 in FigB was made by changing the underlined bases of the shRNA target sequence (AAG GTT CAG ACC ATC TTG GAA) which does not change the amino acid but results in an shRNA resistant BAG3 (AAA GTA CAA ACT ATC TTG GAA). Viral packaging vectors psPAX2 and VSVG are kind gifts from Dr. Christoph Pröschel. Tau RD-P301S-YFP (aa 244–372 of the 441 amino acids in full-length tau; mutations P301S) and the clone 9 (DS9) tau seeds (gifts of Dr. Marc Diamond) were prepared as previously described38. Rabbit anti-TBR1 (Cat# 20932–1-AP) and rabbit anti-BAG3 (Cat# 10599–1-AP) polyclonal antibody were purchased from Proteintech Group. Unless otherwise noted, all other reagents were purchased from Fisher Scientific or Thermo Fisher Scientific.
Animals.
We previously generated a tau transgenic mouse model known as EC-tau20 by crossing the neuropsin-tTA activator line with a tetracycline-inducible tau P301L responder line. The F1 offspring (both males and females at 22 and 30+ months old, strain FVB/N:C57BL/6) were used as experimental animals. All animals were maintained on a 12 hr light/dark cycle with food and water provided ad libitum. All animal experiments were performed in accordance with national guidelines (National Institutes of Health) and approved by the Institutional Animal Care and Use Committee of Columbia University (IACUC protocol # AC-AAAN9950). Mice were transcardially perfused with phosphate-buffered saline (PBS), brains were harvested and drop-fixed in 4% paraformaldehyde (PFA) (Cat# 15710, Electron Microscopy Sciences) in PBS at 4 °C overnight, and free-floating sections (35 μm) were prepared as previously described39.
Human brain tissues.
Human free-floating sections (40 μm) and formalin-fixed paraffin-embedded (FFPE) sections (10 μm) were provided by the Brain Bank at Banner Sun Health Research Institute. Human fresh frozen brain blocks were provided by the New York Brain Bank at Columbia University Medical Center and the NIH NeuroBrainBank at the University of Maryland Brain and Tissue Bank. The demographics of human cases used in this study are listed in Supplementary Table 4. These specimens were obtained by consent at autopsy and have been de-identified and are IRB exempt so as to protect the identity of each patient. Frozen sections (10 μm) were cut from frozen blocks under RNase-free conditions by the Histology Service at Columbia University Medical Center.
Immunofluorescence staining on mouse and human brain sections.
Immunostaining was performed as previously described with a few modifications for human brain sections39. Free-floating brain sections from EC-tau and age-matched nontransgenic (WT) mice at 22 and 30+ months as well as from human brains were subjected to antigen retrieval by 10-minute incubation in 10 mM sodium citrate (pH6.0, 95 °C). After blocking, the sections were stained with TBR1 (1:250), SATB2 (1:250), PVALB (1:1,000), SST (1:100) or CALB2 (1:1,000) antibodies in the blocking solution on the first day, followed by incubation with MC1 (1:750), AT8 (1:500), PHF1 (1:500) or pS422 (1:250) tau antibodies on the next day. Fresh frozen human brain sections were air-dried and fixed with cold acetone for 10 min at −20 °C. They were then incubated with TBR1 (1:250), SATB2 (1:250), GAD1 (1:100) or GFAP (1:2,500) antibodies in blocking solution, followed by incubation with AT8 (1:500), PHF1 (1:500), pS422 (1:250) or AT100 (1:500) tau antibodies on the next day. Human FFPE sections were deparaffinized and rehydrated before the same procedure of antigen retrieval described above, followed by sequential immuno-labeling with TBR1 (1:250), SATB2 (1:250) or IBA-1 (1:500) antibodies and MC1 or AT8 tau antibodies (1:500). We chose the sequential staining instead of the more common co-staining because we found significant amounts of co-localization artifacts of tau and neuronal markers, especially SST. After three washes with phosphate buffered saline with Tween 20 solution (PBST), the sections were incubated with appropriate Alexa Fluor dye-labeled cross-absorbed goat or donkey secondary antibodies (1:1000) for 2 hr (mouse sections) or 3 hr (human sections) at room temperature. Following three washes with phosphate buffered saline solution (PBS), autofluorescence was quenched with 0.3% Sudan black in 70% ethanol for 6 min (mouse sections) or 12 min (human sections) at room temperature. The nuclei were stained with 5 mg/ml Hoechst33342 (Cat# 14533, Sigma-Aldrich) in PBST for 10 min at room temperature. Following three washes with PBS, sections were mounted on slides using SlowFade gold antifade reagent and imaged using confocal laser scanning microscopy (LSM800, Zeiss) via z-stack to assess co-localization. A fluorescence microscope (BX51, Olympus) was used for quantitation. The number of neuronal marker+, MC1+, and co-stained neurons in layers II-IV of the MEC, PRH, and NC was quantified manually using ImageJ software.
The co-staining of GAD1 (1:100), NeuN (1:250) and BAG3 (1:100) was performed on human brain frozen sections (BA9 region) as described above. Stained sections were imaged using confocal laser scanning microscopy via z-stack. We used ImageJ software to open the original czi files, customize the channel colors, set measurements in analysis (mean intensity and area), select different types of neurons by drawing a circle around the cell. The “measure” function generated the analysis. The automatically generated values for similar-sized EX (GAD1-/NeuN+) and IN (GAD1+/NeuN+) neurons were used for comparison of the protein levels of BAG3.
Single-nucleus RNA-seq data analysis.
We used two single-nucleus RNA-seq annotated datasets, the SNS (http://genome-tech.ucsd.edu/public/Lake_Science_2016/)24 and the DroNc-Seq dataset (https://portals.broadinstitute.org/single_cell)25. A differential expression analysis was performed on both datasets. Raw data were first log-normalized, and then a z-score normalization was performed for all genes across the samples to enable a direct comparison between them. Genes with replicates were first z-scored and then the averaged across different samples. In the case of the DroNc-Seq dataset, the matrix of transcript reads had many zero entries within the transcriptome. In order to avoid biases in the analysis and reduce the amount of noise, the bottom 5% low quality samples (samples with less reads across the transcriptome) were discarded, as they were considered to have been damaged during the experimental procedure. A Δ score19 for the genes corresponding to each subproteome was calculated as , which represents the difference between the average expression value () computed, taking the subproteome {s} of reference, in the cell types {i} (e.g. excitatory (EX) neurons), and {j} (e.g. inhibitory (IN) neurons) respectively. Cells were classified as either EX or IN neurons, or non-neuronal based on canonical marker gene expression. More specifically, cells were classified as EX neurons if the maximum expression of EX genes (SLC17A6, SLC17A7) was greater than the maximum expression of IN (GAD1, GAD1, SLC32A1) or non-neuronal (OLIG1, GJA1, XDH, CTSS, MY19) genes. Cells were classified as IN neurons if the maximum expression of IN ( GAD1, GAD1, SLC32A1) genes was greater than the maximum expression of EX ( SLC17A6, SLC17A7) or non-neuronal (OLIG1, GJA1, XDH, CTSS, MY19) genes. All remaining cells were classified as non-neuronal40. For the SNS dataset, we combined brain regions BA21, 22, 10, and 41, and considered them to be a region affected early in AD (low Braak stage). BA17 was considered to be a region affected later in AD (higher Braak stage) region. For the DroNc-Seq dataset, hippocampus (HP) was considered to be an early affected region, while the prefrontal cortex (PFC/BA9) was considered to be a later affected region4.
Statistical analysis of the RNA-seq results.
The statistical significance of the results in Figs. 3 and 4 is studied by creating a null model for each subproteome under scrutiny. This approach enables the assessment of the statistical significance of a given result, and consists of the comparison between a specific value and a distribution of values obtained from multiple random samples of the same size as the reference sample. Each delta-score associated with a subproteome {s} containing ns genes, obtained as a global average of the expression values of the group of genes of interest, is directly compared to a distribution of delta-scores, obtained by sampling multiple times the transcriptome of reference and by creating multiple random subproteomes of the same size ns as the reference one. The p-value is then the probability of obtaining a value which is more extreme than the empirical one, using the random distribution as a reference.
Weighted gene co-expression network analysis.
Weighted gene co-expression network analysis is a data mining method that allows the quantification and interpretation of correlations between variables. In biology, this approach is widely used to study the covariation of genes and proteins across different samples and conditions (different cell types in our analysis). It is based on the definition of a similarity measure, the Pearson’s correlation coefficient in our case, which serves as a parameter to build the topology of the network. The Pearson’s correlation coefficient is defined as
where is the covariance among genes X and Y across the cell types (with μX and μY being the mean values of X and Y, respectively), and σX and σY are their standard deviations. In order to quantify the centrality of each gene in the network, different measures are possible. We selected the total degree of a node, which is defined as the weighted sum of the links connecting it to all the other nodes in the network, with each link being weighted by the Pearson’s correlation coefficient computed above.
Single-molecule fluorescent in situ hybridization (smFISH).
Fresh frozen sections from healthy adults were fixed while frozen in 4% PFA and stained with human specific RNA probes (MAPT/MAPK1/FKBP5-C1, SLC17A7-C2 and GAD1-C3; SLC17A7-C1, ENC1-C2 and GAD1-C3) using the RNAscope Multiplex Fluorescence Kit according to manufacturer’s instructions. After staining, background lipofuscin autofluorescence was quenched using 1% True black (Biotium). Following nucleus counterstaining with DAPI, sections were mounted with ProLong gold antifade reagent. Stained sections were imaged by confocal laser scanning microscopy (LSM800, Zeiss) with a 63x objective. Images were taken across the superficial layers of the EC or BA9 to ensure reproducibility, totaling 10 images per section. Single-mRNA signals from 40 EX and 40 IN neurons (10 neurons from each human case, 4 cases in total) were manually quantified using the ZEN 2 (blue edition, Zeiss), and the results were expressed as the percentage of the average count of single-mRNAs in IN neurons. Data was analyzed and graphed using Prism 5 software (GraphPad).
Mouse primary cortical neuron culture and viral transduction.
Primary mouse neurons were prepared from embryonic day 16–18 mouse embryos and cultured as described with some modifications41. All procedures were approved and performed in compliance with the University of Rochester guidelines for the care and use of laboratory animals. In brief, cerebral cortices were isolated from the mouse brains, meninges were removed, then the cortices were transferred into Trypsin-EDTA (0.05%) and digested for 15 minutes. Following gently trituration, neurons were plated at a density of 15,000 cells/cm2 on poly-D-lysine-coated (Sigma) coverslips for imaging. Neurons were grown for day in vitro (DIV) 24–26 in maintenance media (Neurobasal-A medium supplemented with 2% B27 and 2 mM GlutaMax), and half of media was replaced every 3–4 days. For lentiviral transduction, DIV14 neurons were treated with scrambled or shBAG3 without GFP virus in a half volume of growth media for 16 hours, then the conditioned media supplemented with an equal volume of fresh media was added back.
Immunofluorescence staining of endogenous tau accumulation in primary neurons.
Eleven days after transduction with scrambled or shBAG3 virus the neurons were rinsed with PBS twice, followed by fixing in PBS containing 4% paraformaldehyde and 4% sucrose for 5 minutes at room temperature. Cells were then permeabilized in PBS containing 0.25% Triton X-100 for 10 minutes at room temperature, and were blocked with PBS containing 5% BSA and 0.3 M glycine. Primary antibodies were diluted in blocking solution as follows: goat anti-GAD, 1:1000; rabbit anti-TBR1, 1:500; mouse anti-12E8, 1:2000, incubated on a shaker at 4°C overnight. The next day, neurons were washed with PBS 3 times, 10 minutes each time. Alexa Fluor 488 conjugated donkey anti-rabbit IgG (1:1000), Alexa Fluor 594 conjugated donkey anti-mouse IgG (1:1000) or Alexa Fluor 647 conjugated donkey anti-goat IgG (1:1000) was diluted in blocking solution and incubated with neurons for 1 hour at room temperature. After 3 × 10 minutes of washes, neurons were incubated with Hoechst 33342 (2μM) for 10 minutes at room temperature, then coverslips were mounted with ProLong diamond antifade mountant. Images were acquired on the laser scanning confocal microscope (LSM800, Zeiss) via z-stack. The maximum z projection of those images was used for looking at the tau puncta in the neurites.
Western blot analysis.
Primary cortical neurons cultured in 6-well plates were transduced with scramble, shBAG3 or BAG3 OE lentivirus for 7 days and the total protein lysates were prepared and subjected to Western blot assay as previously described42. 2.5 μg of protein lysates were separated electrophoretically on 4–12% Bis-Tris precast polyacrylamide gels and blotted onto nitrocellulose blotting membranes. Blots were probed with rabbit primary antibodies for BAG3 (1:5000) or GAPDH (1:6000). After washing and incubation with secondary horseradish peroxidase-conjugated antibodies, membranes were developed with ECL, and digitalized images were taken using Fujifilm LAS-3000 Imager.
Neuronal culture, viral transduction and tau seeding experiment.
Primary neuronal cultures were prepared and maintained as previously described43. At DIV2, neurons cultured on poly-D-lysine-coated coverslips were transduced with the scramble, shBAG3 or BAG3 OE lentivirus. Half of the media was changed and neurons were transduced with 2 μl of RD-P301S-YFP (1:100) lentivirus. At DIV5, the media was changed and cells were incubated with 7.5 μg of DS9 tau seeds (prepared in sterile PBS) overnight. The media was then changed into the growth media and incubated for an additional 4–6 days. The cells were fixed with 4% PFA at room temperature for 30 min and were subjected to immunofluorescent staining as described above. Cells were incubated with the primary antibodies of rabbit anti-TBR1 (1:750) and goat anti-GAD1 (1:750) at 4 °C overnight, followed by the incubation of appropriate secondary donkey antibodies at room temperature for 2 h. Images were acquired on the laser scanning confocal microscope (LSM800, Zeiss) at 20× magnification, the whole view of which was used as the region of interest (ROI). Each group has 4 coverslips, and 20 images per coverslip at 1,024 × 1,024 resolution were taken randomly from all the orientations of the coverslip. The number of TBR1+ EX and GAD1+ IN neurons with tau inclusions were quantified blind to the treatment.
Statistical analysis.
No statistical methods were used to pre-determine sample sizes but our sample sizes are similar to those reported in previous publications38, 39, 43. Prism 5 software was used to analyze the data. All the data are expressed as mean ± SEM. We performed the D’Agostino-Pearson omnibus normality test to determine if the data were normally distributed, or the F test to determine if the data assumed equal variances. We then chose the following statistical tests. The unpaired t test was used to compare the number of neuronal marker+ and MC1+ cells in EC-tau and control mice. A one-way ANOVA with Tukey’s post-tests was used to compare the number of neuronal marker+ cells in human brains at different Braak stages. The unpaired t test with Welch’s correction was used to compare the number of MC1+ cells in human brains, and the number of single-mRNAs between EX and IN neurons. The nonparametric Mann-Whitney test was used to compare the mean intensity of BAG3 in human non-AD and AD. The nonparametric Kruskal-Wallis test with the post hoc test of Dunn’s multiple comparisons was used to compare the ratio of colocalization, the number of neurons with 12E8 tau+ puncta, the number of TBR1+ neurons with tau inclusions, and the number of GAD1+ neurons with tau inclusions. All results represent two-sided tests comparing groups of biological replicates. A value of p < 0.05 was considered statistically significant for all measures. The “n” represents the number of animals, neurons, or cases in each group. The exact values of n are indicated in figure legends.
Supplementary Material
Single-nucleus RNA-seq datasets analysis in neurons. (see attachment)
Single-nucleus RNA-seq datasets analysis in glia. (see attachment)
Weighted gene co-expression network analysis of the subproteomes relevant to tau homeostasis. (see attachment)
Case Demographics (see attachment)
Acknowledgements
We would like to thank M. Diamond for providing the Tau RD-P301S-YFP lentivirus and DS9 clone cell line, K. Zhang and B. Lake (UCSD) and A. Regev, N. Habib, I. Avraham-Davidi and A. Basu (Broad Institute of MIT and Harvard) for sharing their single-nucleus RNA-seq datasets; L. Honig, J.P. Vonsattel, A. Teich and E. Cortés (New York Brain Bank, Columbia University Medical Center), the NIH NeuroBrainBank at the University of Maryland Brain and Tissue Bank as well as T. Beach and G. Serrano (Banner Sun Health Research Institute Brain and Body Donation Program) for providing human de-identified brain tissue and for helpful discussions on brain regions and immunostaining techniques; P. Davies for providing the MC1 and PHF1 tau antibodies; ACDBio for troubleshooting on RNAscope FISH; W.H. Yu and C.L. Clelland for discussing the results. This work was funded by: NIH/NIA AG056673 (H.F.), Alzheimer’s Association AARF-17–505009 (H.F.), NIH/NINDS NS074874 (K.E.D.), NIH/NIA AG056151 (K.E.D) and funding from the BrightFocus Foundation, the Rainwater Foundation/Tau Consortium and the Cure Alzheimer’s Fund (K.E.D). The Banner Sun Health Research Institute Brain and Body Donation Program is supported by the National Institute of Neurological Disorders and Stroke (U24 NS072026 National Brain and Tissue Resource for Parkinson’s Disease and Related Disorders), the National Institute on Aging (P30 AG19610 Arizona Alzheimer’s Disease Core Center), the Arizona Department of Health Services (contract 211002, Arizona Alzheimer’s Research Center), the Arizona Biomedical Research Commission (contracts 4001, 0011, 05–901 and 1001 to the Arizona Parkinson’s Disease Consortium) and the Michael J. Fox Foundation for Parkinson’s Research.
Footnotes
Data availability. The data used to generate the results that support the findings of this study are available from the corresponding authors upon request.
Competing interests Karen E. Duff is on the board of directors and SAB of Ceracuity LLC. All other authors declare no competing interests.
References (for main text only):
- 1.Simic G et al. Tau Protein Hyperphosphorylation and Aggregation in Alzheimer’s Disease and Other Tauopathies, and Possible Neuroprotective Strategies. Biomolecules 6, 6 (2016). [DOI] [PMC free article] [PubMed] [Google Scholar]
- 2.Dugger BN & Dickson DW Pathology of Neurodegenerative Diseases. Cold Spring Harb Perspect Biol 9 (2017). [DOI] [PMC free article] [PubMed] [Google Scholar]
- 3.Spina S et al. The tauopathy associated with mutation +3 in intron 10 of Tau: characterization of the MSTD family. Brain 131, 72–89 (2008). [DOI] [PMC free article] [PubMed] [Google Scholar]
- 4.Braak H & Braak E Neuropathological stageing of Alzheimer-related changes. Acta Neuropathol 82, 239–259 (1991). [DOI] [PubMed] [Google Scholar]
- 5.Davies P & Maloney AJ Selective loss of central cholinergic neurons in Alzheimer’s disease. Lancet 2, 1403 (1976). [DOI] [PubMed] [Google Scholar]
- 6.Morrison BM, Hof PR & Morrison JH Determinants of neuronal vulnerability in neurodegenerative diseases. Ann Neurol 44, S32–44 (1998). [DOI] [PubMed] [Google Scholar]
- 7.Gotz J, Schonrock N, Vissel B & Ittner LM Alzheimer’s disease selective vulnerability and modeling in transgenic mice. J Alzheimers Dis 18, 243–251 (2009). [DOI] [PubMed] [Google Scholar]
- 8.Riascos D et al. Age-related loss of calcium buffering and selective neuronal vulnerability in Alzheimer’s disease. Acta Neuropathol 122, 565–576 (2011). [DOI] [PMC free article] [PubMed] [Google Scholar]
- 9.Ahmadian SS et al. Loss of calbindin-D28K is associated with the full range of tangle pathology within basal forebrain cholinergic neurons in Alzheimer’s disease. Neurobiol Aging 36, 3163–3170 (2015). [DOI] [PMC free article] [PubMed] [Google Scholar]
- 10.Hof PR et al. Age-related distribution of neuropathologic changes in the cerebral cortex of patients with Down’s syndrome. Quantitative regional analysis and comparison with Alzheimer’s disease. Arch Neurol 52, 379–391 (1995). [DOI] [PubMed] [Google Scholar]
- 11.Seeley WW Selective functional, regional, and neuronal vulnerability in frontotemporal dementia. Curr Opin Neurol 21, 701–707 (2008). [DOI] [PMC free article] [PubMed] [Google Scholar]
- 12.Hyman BT, Van Hoesen GW, Damasio AR & Barnes CL Alzheimer’s disease: cell-specific pathology isolates the hippocampal formation. Science 225, 1168–1170 (1984). [DOI] [PubMed] [Google Scholar]
- 13.Mattson MP & Magnus T Ageing and neuronal vulnerability. Nat Rev Neurosci 7, 278–294 (2006). [DOI] [PMC free article] [PubMed] [Google Scholar]
- 14.Saxena S & Caroni P Selective neuronal vulnerability in neurodegenerative diseases: from stressor thresholds to degeneration. Neuron 71, 35–48 (2011). [DOI] [PubMed] [Google Scholar]
- 15.Roselli F & Caroni P From intrinsic firing properties to selective neuronal vulnerability in neurodegenerative diseases. Neuron 85, 901–910 (2015). [DOI] [PubMed] [Google Scholar]
- 16.Labbadia J & Morimoto RI The biology of proteostasis in aging and disease. Annu Rev Biochem 84, 435–464 (2015). [DOI] [PMC free article] [PubMed] [Google Scholar]
- 17.Taylor RC & Dillin A Aging as an event of proteostasis collapse. Cold Spring Harb Perspect Biol 3 (2011). [DOI] [PMC free article] [PubMed] [Google Scholar]
- 18.Kaushik S & Cuervo AM Proteostasis and aging. Nat Med 21, 1406–1415 (2015). [DOI] [PubMed] [Google Scholar]
- 19.Freer R et al. A protein homeostasis signature in healthy brains recapitulates tissue vulnerability to Alzheimer’s disease. Sci Adv 2, e1600947 (2016). [DOI] [PMC free article] [PubMed] [Google Scholar]
- 20.Liu L et al. Trans-synaptic spread of tau pathology in vivo. PLoS One 7, e31302 (2012). [DOI] [PMC free article] [PubMed] [Google Scholar]
- 21.Lei Z, Brizzee C & Johnson GV BAG3 facilitates the clearance of endogenous tau in primary neurons. Neurobiol Aging 36, 241–248 (2015). [DOI] [PMC free article] [PubMed] [Google Scholar]
- 22.Seidel K et al. The HSPB8-BAG3 chaperone complex is upregulated in astrocytes in the human brain affected by protein aggregation diseases. Neuropathology and applied neurobiology 38, 39–53 (2012). [DOI] [PubMed] [Google Scholar]
- 23.Wegmann S et al. Removing endogenous tau does not prevent tau propagation yet reduces its neurotoxicity. EMBO J 34, 3028–3041 (2015). [DOI] [PMC free article] [PubMed] [Google Scholar]
- 24.Lake BB et al. Neuronal subtypes and diversity revealed by single-nucleus RNA sequencing of the human brain. Science 352, 1586–1590 (2016). [DOI] [PMC free article] [PubMed] [Google Scholar]
- 25.Habib N et al. Massively parallel single-nucleus RNA-seq with DroNc-seq. Nat Methods 14, 955–958 (2017). [DOI] [PMC free article] [PubMed] [Google Scholar]
- 26.Ciryam P et al. A transcriptional signature of Alzheimer’s disease is associated with a metastable subproteome at risk for aggregation. Proc Natl Acad Sci U S A 113, 4753–4758 (2016). [DOI] [PMC free article] [PubMed] [Google Scholar]
- 27.Zhang B & Horvath S A general framework for weighted gene co-expression network analysis. Stat Appl Genet Mol Biol 4, Article17 (2005). [DOI] [PubMed] [Google Scholar]
- 28.Fu H, Hardy J & Duff KE Selective vulnerability in neurodegenerative diseases. Nat Neurosci 21, 1350–1358 (2018). [DOI] [PMC free article] [PubMed] [Google Scholar]
- 29.de Calignon A et al. Propagation of tau pathology in a model of early Alzheimer’s disease. Neuron 73, 685–697 (2012). [DOI] [PMC free article] [PubMed] [Google Scholar]
- 30.Fu H et al. 3D Visualization of the Temporal and Spatial Spread of Tau Pathology Reveals Extensive Sites of Tau Accumulation Associated with Neuronal Loss and Recognition Memory Deficit in Aged Tau Transgenic Mice. PLoS One 11, e0159463 (2016). [DOI] [PMC free article] [PubMed] [Google Scholar]
- 31.Ferrer I et al. Glial and neuronal tau pathology in tauopathies: characterization of disease-specific phenotypes and tau pathology progression. Journal of neuropathology and experimental neurology 73, 81–97 (2014). [DOI] [PubMed] [Google Scholar]
- 32.Kahlson MA & Colodner KJ Glial Tau Pathology in Tauopathies: Functional Consequences. Journal of experimental neuroscience 9, 43–50 (2015). [DOI] [PMC free article] [PubMed] [Google Scholar]
- 33.Leyns CEG & Holtzman DM Glial contributions to neurodegeneration in tauopathies. Molecular neurodegeneration 12, 50 (2017). [DOI] [PMC free article] [PubMed] [Google Scholar]
- 34.Brehme M et al. A chaperome subnetwork safeguards proteostasis in aging and neurodegenerative disease. Cell reports 9, 1135–1150 (2014). [DOI] [PMC free article] [PubMed] [Google Scholar]
- 35.Baranczak A & Kelly JW A current pharmacologic agent versus the promise of next generation therapeutics to ameliorate protein misfolding and/or aggregation diseases. Curr Opin Chem Biol 32, 10–21 (2016). [DOI] [PMC free article] [PubMed] [Google Scholar]
- 36.Balch WE, Morimoto RI, Dillin A & Kelly JW Adapting proteostasis for disease intervention. Science 319, 916–919 (2008). [DOI] [PubMed] [Google Scholar]
Methods-only References
- 37.Seubert P et al. Detection of phosphorylated Ser262 in fetal tau, adult tau, and paired helical filament tau. J Biol Chem 270, 18917–18922 (1995). [DOI] [PubMed] [Google Scholar]
- 38.Sanders DW et al. Distinct tau prion strains propagate in cells and mice and define different tauopathies. Neuron 82, 1271–1288 (2014). [DOI] [PMC free article] [PubMed] [Google Scholar]
- 39.Fu H et al. Tau Pathology Induces Excitatory Neuron Loss, Grid Cell Dysfunction, and Spatial Memory Deficits Reminiscent of Early Alzheimer’s Disease. Neuron 93, 533–541 e535 (2017). [DOI] [PMC free article] [PubMed] [Google Scholar]
- 40.Tasic B et al. Adult mouse cortical cell taxonomy revealed by single cell transcriptomics. Nat Neurosci 19, 335–346 (2016). [DOI] [PMC free article] [PubMed] [Google Scholar]
- 41.Ji C, Steimle BL, Bailey DK & Kosman DJ The Ferroxidase Hephaestin But Not Amyloid Precursor Protein is Required for Ferroportin-Supported Iron Efflux in Primary Hippocampal Neurons. Cellular and molecular neurobiology 38, 941–954 (2018). [DOI] [PMC free article] [PubMed] [Google Scholar]
- 42.Tosto G et al. F-box/LRR-repeat protein 7 is genetically associated with Alzheimer’s disease. Annals of clinical and translational neurology 2, 810–820 (2015). [DOI] [PMC free article] [PubMed] [Google Scholar]
- 43.Wu JW et al. Small misfolded Tau species are internalized via bulk endocytosis and anterogradely and retrogradely transported in neurons. J Biol Chem 288, 1856–1870 (2013). [DOI] [PMC free article] [PubMed] [Google Scholar]
Associated Data
This section collects any data citations, data availability statements, or supplementary materials included in this article.
Supplementary Materials
Single-nucleus RNA-seq datasets analysis in neurons. (see attachment)
Single-nucleus RNA-seq datasets analysis in glia. (see attachment)
Weighted gene co-expression network analysis of the subproteomes relevant to tau homeostasis. (see attachment)
Case Demographics (see attachment)