Abstract
Background:
Circulating microRNA (miRNA/miR) levels are emerging out as markers of tissue level changes; however, their role in type 2 diabetes (T2D) needs to be explored. The study aimed to compare the circulating levels of the miRNA (miR9, miR30d, miR1, miR133a, miR29a, miR143) between T2D and gender matched controls and also to evaluate the strength of association between circulating miRNAs and beta cell function/insulin resistance among Indians with T2D.
Subjects and Methods:
Thirty T2D (25–60 years) and their gender matched controls (n = 30) were recruited. Plasma glucose and insulin, HbA1c, lipid profile, and miRNA levels were estimated. Insulin resistance and beta cell function (HOMA IR and %B) were derived. Body composition was assessed by Dual-energy-x-ray absorptiometry (DXA). Comparison between the study groups was performed using independent “t” test and strength of association by Pearson's correlation.
Results:
There was a significant difference in HOMA IR (P = 0.03) and %B (P = 0.001) between the two study groups. The muscle mass, percent body fat, and muscle to fat ratio were comparable between the two study groups. miRNA 30d was significantly higher in the T2D compared to control group even after controlling for age (P = 0.005). There was a significant positive association between miR30d with HOMA-IR (r = 0.26, P = 0.04).
Conclusion:
The current study demonstrated that miR30d (insulin gene transcription in pancreatic beta cell and regulator of insulin sensitivity in skeletal muscle) was overexpressed among T2D. Further role of other miRNA and their interaction in regulation of beta cell function and insulin resistance needs to be studied.
Keywords: Body composition, beta cell function, insulin resistance, microRNA, type 2 diabetes
INTRODUCTION
Asian Indian T2D phenotype is unique with proposed existence of greater visceral fat than subcutaneous fat and lesser lean mass.[1] In the recent years research focusing upon elucidating molecular mechanisms underlying the pathogenesis of T2D has discovered the potential of microRNA (miRNA) not only in delineating the disease manifestation but also as novel early biomarkers for diagnosis and probably as therapeutic agents.[2] miRNAs are a class of small noncoding RNAs that function as translational repressors. miRNAs have been characterized in humans, and it is believed that approximately 30% of all human genes may potentially be controlled by miRNA through posttranscriptional mechanisms.[3] The range of cellular functions that are regulated by miRNAs include critical pathways of metabolic control like amino acid and lipid metabolism, skeletal muscle and adipocyte differentiation, and insulin secretion from pancreatic beta cells.[4] Various strategies have been used to study the roles of miRNAs in T2D, including studies on cell lines, isolated primary cells, and animal models as well as in T2D patients.[5] Though tissue level miRNAs have been explored, research on circulating miRNAs is limited especially among Asian Indian phenotype. In addition, there are no studies correlating circulating miRNAs with beta cell function and insulin sensitivity among T2D. The present study aimed to compare the circulating levels of the miRNAs including miR-9, miR-30d—insulin secretion by beta cell and insulin resistance; miR-1, miR-133a—skeletal muscle proliferation and differentiation with glucose uptake; miR 29a, miR-143—adipogenesis and glucose uptake between T2D and healthy gender matched controls. Our secondary aim was to evaluate the strength of association between beta cell function/insulin resistance and circulating miRNA (miR9, miR30d, miR1, miR133a, miR29a, miR143).
SUBJECTS AND METHODS
Thirty T2D (25–60 years) and their gender matched controls (n = 30) were recruited through advertisements in and around the medical college campus. The controls were within ±5 years of T2D and gender matched. The purpose of the study and the potential risks involved were explained to each subject and a written informed consent was obtained from each of them. The ADA criteria for the diagnosis of T2D were used.[6] The duration of the T2D was less than 5 years and all patients were only on oral hypoglycemic agents. All were in good health as determined by medical history, physical examination, and analysis for blood cell count. T2D if associated with any associated disorders like anemia, joint injury, hypertension, cardiovascular disease, tuberculosis, cancer, thyroid disorders, were excluded. The Institutional Ethical Review Board approved the research protocol.
Blood biochemistry
A 10-ml whole blood was collected from each participant and separated into multiple aliquots of plasma and serum for analysis including miRNA estimation. Plasma for miRNA estimation was stored at ‒80° until analysis, however, rest of the analysis were performed immediately. The Plasma glucose (GOD POD method, Beckman Coulter AU480, Japan), glycosylated hemoglobin (HPLC method, Bio-Rad, Model Variant Turbo II, and India), serum lipid profiling, including serum cholesterol, high density lipoprotein (HDL), low density lipoprotein (LDL), and triglyceride estimations using a Chemiluminescence Immunoassay (Siemens, Model EXL with LM 1 and 2, Germany) and plasma insulin was measured by electro chemiluminescence (ADVIA Centaur CP, Siemen's Healthineers, India). Insulin resistance and beta cell function (HOMA-IR and HOMA-%B) were assessed by the homeostatic method using standard formulae for calculation.[7]
Anthropometry
Subjects were weighed in minimal clothing to the nearest 0.1 kg and their height was measured to the nearest 0.1 cm. Waist and hip circumferences were measured using a standard nonstretchable tape measure, at the narrowest point between the iliac crest and ribcage (waist) and at the level of the greater trochanter (hip).[8]
Questionnaire
A 24 hour dietary recall, demographics, and physical activity patterns[9] were collected from each participant.
Dual-energy x-ray absorptiometry
Whole body and regional body composition were estimated using DXA (DPXMD 7254, Lunar Corporation, Madison, WI). Appendages were isolated from the trunk and head by using default lines with manual adjustment, on the anterior view planogram. Legs and arms were defined as the soft tissue extending from a line drawn through and perpendicular to the axis of the femoral neck and angled with the pelvic brim to the phalange tips and the soft tissue extending from the center of the arm socket to the phalange tips, respectively. Appendicular lean soft tissue (ALST) was used as a surrogate for whole body skeletal muscle, as it has been shown to correlate well with reference measurements of the whole body skeletal muscle mass. The total body fat was expressed as percentage (%) and ALST in kilogram (kg).[10]
miRNA extraction and quantitative PCR
miRNA was extracted of using 500 μl plasma using miR Neasy Kit (Qiagen, Cat #217184) according to manufacturer instructions from samples of T2D and controls. Quantitation of the small RNA was done using the Qubit Hs RNA assay reagents (Invitrogen #Q32852-Qubit Hs RNA assay kit) on a fluorimeter (Qubit® 2.0 Fluorometer Cat# Q32866).
miRNA was converted to cDNA using stem loop primers specific for the chosen miRNA using Taqman MicroRNA Reverse Transcription Kit (Applied Biosystems, #4366596) according to published protocols. Concentration of 50–100 ng of RNA was used for the conversion of miRNA to cDNA according to manufacturer's instructions using Veriti 96 well thermal cycler (Applied Biosystems). Briefly, the reverse transcription reaction mixture was incubated at 16°C for 30 min, 42°C for 30 min, 85°C for 5 min and finally held at 4°C.
Quantitative Real Time PCR: Taqman MicroRNA inventoried assays for q-RT-PCR (Applied Biosystems, #4427975) were used for miR9, miR30d, miR1, miR29a, miR-133a, and miR143; these assay kits comprise stem loop primers for cDNA conversion as well as TaqMan primer-probes for qRT-PCR analysis. The real time PCR was done in duplicates on the qPCR system (BIO-RAD Cat#CFX). The reaction mixture for miRNA analysis by q-RT-PCR was subjected to an enzyme activation step at 95°C for 10 min; followed by 45 cycles of denaturation (95°C for 15 s) and annealing (60°C for 60 s). Cycle of threshold (Ct) values was used for calculation Δ Ct for each miR, which is Ct of the test gene—Ct of miR16, used as control miR. ΔCt was subtracted from a fixed value of 15 (which represents the range of assay) to calculate the relative normalized units (RNU) for each of the miR listed above.[11]
Data are presented as mean and standard deviation (SD). Their normality was assessed using Q-Q plots. Data were normally distributed and parametric tests were used for further analysis. The comparisons between T2D and controls performed using the Independent “t’ test. Analysis of Co-variance (ANCOVA) was used to eliminate the effect of age. Correlation between miRNA and various parameters was assessed by Pearson correlation coefficient. The level of significance was set at P < 0.05.
RESULTS
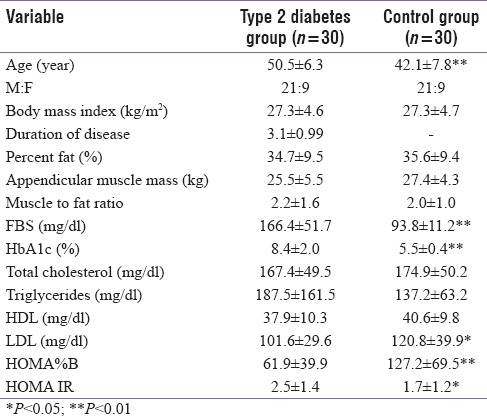
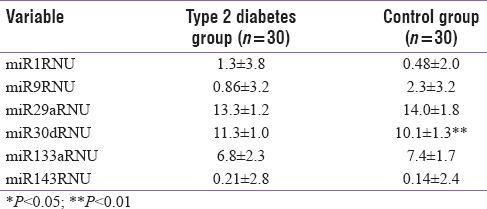
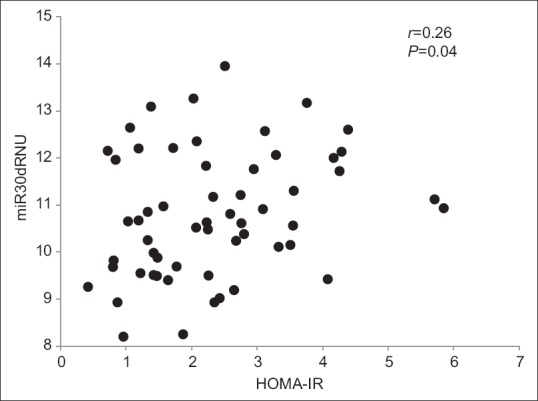
Table 1 represents the descriptive data of the two study groups. The T2D group was older than the controls (P < 0.01). There was a significant difference in LDL, HOMA IR, and B% between the two study groups. The appendicular muscle mass, lean mass, percent body fat, and the whole-body muscle to fat ratio were comparable between the two study groups [Table 1]. miRNA comparison between the study groups indicated that miRNA 30d was significantly higher in the T2D group compared to control group [Table 2] even after controlling for age. There was a significant positive association between miR30d with HOMA-IR (r = 0.26, P = 0.04) [Figure 1].
Table 1.
Descriptive statistics of the study groups

Table 2.
Comparison of circulating microRNA between type 2 diabetes and control study group

Figure 1.

Scatter plot representing the association between miRNA30d with HOMA-IR
DISCUSSION
The data from the present study indicated that out of the evaluated circulating miRNA (miR9, miR30d, miR1, miR133a, miR29a, miR143), miR30d (a regulator of insulin secretion by beta cell and insulin sensitivity) was significantly overexpressed in T2D compared to controls. There was also a positive association between HOMA-IR and miR30d among the study groups.
Multiple miRNAs have been suggested to play vital role in the regulation of insulin secretion and sensitivity.[12] With majority of the data available from either animal models or cell lines, there was a need to study the role of circulating miRNA among T2D. As an exploratory analysis we selected circulating miRNAs, which could potentially play a role in the pathogenesis of T2D. Among the various factors regulating uptake of glucose at tissue level, the role of GLUT4 is considered to be vital.[13] The involvement of subunit beta of GLUT4 and its functional impairment could favor insulin resistance. It is suggested that miRNA could play critical role in the regulation of the GLUT4 activity. Data from the rat models and insulin-resistant L6 cell lines have suggested that up regulation of miR30d could diminish GLUT4 signaling. The miR30d could suppress the MAPK 14 and PI3K activity altering the translocation, activation, and expression of beta subunit of GLUT4.[14] The fact that miR30d was significantly higher in T2D and its association with HOMA-IR as part of the current study, suggests that miRNA could play a role in the regulation of glucose homeostasis. Further, studies are required to look at the miRNA association with GLUT4 to confirm the same.
The functional release of insulin, the transcription and stability of miRNA in the insulin translation, and insulin processing are all regulated by glucose concentrations in the beta cells of the pancreas. The abundance of several miRNA transcripts are known to alter the response to glucose concentrations. Data from the cultured pancreatic beta cell line with high-glucose conditions demonstrated that expression miRNAs were large. Some miRNAs were upregulated and some down regulated, like for instance miRNA of interest miR30d was upregulated. Increased expression of miR30d in high glucose conditions correlated with increased insulin gene expression but not associated increase in insulin secretion, suggesting that targets of miR30d are negative regulators of insulin gene expression, independent of insulin secretion.[15] Though we did not find any association between miR30d and HOMA B%, further exploration of the interactions with factors modulating beta cell function are needed.
Strength and limitation of the study: successful detection of circulating miRNA has been one of the achievements of the study. We have been able to estimate the circulating miRNA among T2D and compare it with controls. There is a huge scope for the present study to be expanded into studies that can understand the role of miRNA in the detection of various complications due to T2D. The limitation of the study includes the fact that miRNA estimation in its miniscule quantity from the cell free total RNA being extracted from serum/plasma limits the array of number of miRNA that can be tested from them. Ideally this study would have benefited if we had taken a micro array approach to discover all detectable miRNA from circulating blood and then made comparison between T2D and controls to examine the deferentially regulated miRNA.
CONCLUSION
In conclusion present study was able to demonstrate expression of miRNA in circulation among a cohort of T2D and their gender matched controls. The circulating miR30d (insulin gene transcription in pancreatic beta cell and regulator of insulin sensitivity in skeletal muscle) was over expressed among T2D. Further, role of other miRNA and their interaction in regulation of beta cell function and insulin resistance needs to be studied.
Financial support and sponsorship
This study was supported by the funding received from the Advance Research Wing, Rajiv Gandhi University of Health Sciences, Bangalore.
Conflicts of interest
There are no conflicts of interest.
Acknowledgments
The authors would like to acknowledge the funding of the study by the Rajiv Gandhi University of Health Sciences, Bangalore.
REFERENCES
- 1.Unnikrishnan R, Anjana RM, Mohan V. Diabetes in South Asians: Is the phenotype different? Diabetes. 2014;63:53–5. doi: 10.2337/db13-1592. [DOI] [PubMed] [Google Scholar]
- 2.Simonson B, Das S. MicroRNA Therapeutics: the Next Magic Bullet? Mini Rev Med Chem. 2015;15:467–74. doi: 10.2174/1389557515666150324123208. [DOI] [PMC free article] [PubMed] [Google Scholar]
- 3.Mohr AM, Mott JL. Overview of microRNA biology. Semin Liver Dis. 2015;35:3–11. doi: 10.1055/s-0034-1397344. [DOI] [PMC free article] [PubMed] [Google Scholar]
- 4.Krützfeldt J, Stoffel M. MicroRNAs: A new class of regulatory genes affecting metabolism. Cell Metab. 2006;4:9–12. doi: 10.1016/j.cmet.2006.05.009. [DOI] [PubMed] [Google Scholar]
- 5.Guay C, Roggli E, Nesca V, Jacovetti C, Regazzi R. Diabetes mellitus, a microRNA-related disease? Transl Res. 2011;157:253–64. doi: 10.1016/j.trsl.2011.01.009. [DOI] [PubMed] [Google Scholar]
- 6.Chamberlain JJ, Rhinehart AS, Shaefer CF, Jr, Neuman A. Diagnosis and Management of Diabetes: Synopsis of the 2016 American Diabetes Association Standards of Medical Care in Diabetes. Ann Intern Med. 2016;164:542–52. doi: 10.7326/M15-3016. [DOI] [PubMed] [Google Scholar]
- 7.Matthews DR, Hosker JP, Rudenski AS, Naylor BA, Treacher DF, Turner RC. Homeostasis model assessment: Insulin resistance and B-cell function from fasting plasma glucose and insulin concentrations in man. Diabetologia. 1985;28:412–9. doi: 10.1007/BF00280883. [DOI] [PubMed] [Google Scholar]
- 8.Durnin JV, Womersley JV. Body fat assessed from total body density and its estimation from skinfold thickness: Measurements on 481 men and women aged from 16 to 72 years. Br J Nutr. 1974;32:77–97. doi: 10.1079/bjn19740060. [DOI] [PubMed] [Google Scholar]
- 9.Bharathi AV, Sandhya N, Vaz M. The development & characteristics of a physical activity questionnaire for epidemiological studies in urban middle class Indians. Indian J Med Res. 2000;111:95. [PubMed] [Google Scholar]
- 10.Kuriyan R, Thomas T, Ashok S, Jayakumar J, Kurpad AV. A 4-compartment model based validation of air displacement plethysmography, dual energy X-ray absorptiometry, skinfold technique & bio-electrical impedance for measuring body fat in Indian adults. Indian J Med Res. 2014;139:700–7. [PMC free article] [PubMed] [Google Scholar]
- 11.Costa MC, Leitão AL, Enguita FJ. MicroRNA profiling in plasma or serum using quantitative RT-PCR. Methods Mol Biol. 2014;1182:121–9. doi: 10.1007/978-1-4939-1062-5_11. [DOI] [PubMed] [Google Scholar]
- 12.Chen H, Lan HY, Roukos DH, Cho WC. Application of microRNAs in diabetes mellitus. J Endocrinol. 2014 Jul;222:R1–R10. doi: 10.1530/JOE-13-0544. [DOI] [PubMed] [Google Scholar]
- 13.Zhou T, Meng X, Che H, Shen N, Xiao D, Song X, et al. Regulation of insulin resistance by multiple MiRNAs via targeting the GLUT4 signalling pathway. Cell Physiol Biochem. 2016;38:2063–78. doi: 10.1159/000445565. [DOI] [PubMed] [Google Scholar]
- 14.Lund S, Holman GD, Schmitz O, Pedersen O. Contraction stimulates translocation of glucose transporter GLUT4 in skeletal muscle through a mechanism distinct from that of insulin. Proc Natl Acad Sci. 1995;92:5817–21. doi: 10.1073/pnas.92.13.5817. [DOI] [PMC free article] [PubMed] [Google Scholar]
- 15.Seyhan AA, Lopez YO, Xie H, Yi F, Mathews C, Pasarica M, et al. Pancreas-enriched miRNAs are altered in the circulation of subjects with diabetes: A pilot cross-sectional study. Sci Rep. 2016;6:31479. doi: 10.1038/srep31479. [DOI] [PMC free article] [PubMed] [Google Scholar]


