

Abstract
Personal air pollution monitoring in research studies should not interfere with usual patterns of behavior and bias results. In an urban pediatric cohort study we tested whether wearing an air monitor impacted activity time based on continuous watch-based accelerometry. The majority (71%) reported that activity while wearing the monitor mimicked normal activity. Correspondingly, variation in activity while wearing versus not wearing the monitor did not differ greatly from baseline variation in activity (P = 0.84).
Keywords: Activity, Wearing compliance, Air pollution, Microaeth, Accelerometer, Compliance, Exposure equipment, Device
1. Introduction
Early air pollution exposure assessments were limited to fixed sampling for a region using large or bulky portable samplers (Vincent, 2012). In recent years microelectronics and small pumps have emerged allowing investigators to sample an individual person’s exposure (Vincent, 2012). The closer we get to assessing actual personal exposure, the better we can evaluate true associations between air pollution and health (Koehler and Peters, 2015). Personal samplers can capture the spatial and temporal variability that exist in all visited microenvironments and activity-related exposures (e.g. personal cloud); thus, contributing to greater accuracy in associating exposures to physiological outcomes (Koehler and Peters, 2015). However, the nature of personal samplers is that in order to capture accurate measurements they should be worn consistently and not change behavior. This is critical for people of all ages who may be susceptible to modified behavior while engaging in research studies, including children.
Exposure to ambient pollutants, including black carbon (BC), a component of fine particulate matter < 2.5 μm, is one of the leading risk factors for morbidity and mortality globally (Lim et al., 2012). It is important to measure particulate concentrations in the breathing zone, duration of exposure, and volume of air inhaled to precisely calculate the individual level concentration of exposure (Davies and Whyatt, 2014). The inhaled dose of pollution potentially can be amplified with physical activity due to increased respiratory rates and larger tidal volumes (Oravisjarvi et al., 2011; Rodes et al., 2012). Thus, personal air pollution sampling combined with minute ventilation measurements can yield a more accurate inhaled pollutant dosage. However, exposure measurements under testing conditions, may not reflect real-life exposure if activity is altered while wearing the monitor. Therefore, it is important to determine if and how much a study participant’s behavior is altered by wearing the device.
Our objective was to determine if personal air pollution exposure monitoring changed usual physical activity levels in a cohort of 9–14 year-olds living in an urban environment. Additionally, we aimed to determine characteristics that may be associated with differences in activity while wearing personal exposure equipment. We hypothesized that the amount of time children engaged in moderate to vigorous activity (MVA) on days when they were asked to wear an exposure monitor would not differ significantly from usual fluctuations in day-to-day activity.
2. Materials and methods
Children ages 9–14 years (n = 163) were recruited for a nested study within the Columbia Center for Children’s Environmental Health longitudinal birth cohort of African Americans and Dominicans in New York City (NYC) (Jung et al., 2017; Perera et al., 2003). Enrollment criteria for the nested parent study included age within the predefined range (9–14 years) and diagnosis of asthma (target of 56% asthmatics). To measure personal exposure to BC, for 24-h periods participants carried a 280 g, battery operated MicroAeth (Model AE51, AethLabs, San Francisco, CA) within a vest pocket with the inlet tube coming out of the double lined vest at the breathing zone (Supplemental Fig. 1) (Cai et al., 2013). An accelerometer (ActiCal, Phillips Respironics, Bend, OR) was attached to the MicroAeth to verify when it was being moved/ worn. Children could remove the vest while sleeping, bathing, and during vigorous activity if it was uncomfortable (Lovinsky-Desir et al., 2014). Also, children wore a wrist-mounted accelerometer with a hospital band (could only be removed by cutting off) during the entire 24-h BC weekday-monitoring period and for 5 consecutive days thereafter (Lovinsky-Desir et al., 2014). Questionnaires were administered immediately following BC monitoring to assess the child’s experiences while wearing the exposure vest (Supplemental Table 1).
Based on the wrist-mounted accelerometer, total time spent in MVA was calculated for the 24-h BC monitoring period (herein after referred to as ‘vest day’) and compared to the subsequent 24-h weekday when the child was not wearing the MicroAeth (‘non-vest day’) (Supplemental Fig. 2). To assess natural variation in day-to-day MVA without wearing the vest, we defined ‘baseline’ variation as non-vest day MVA compared to 24-h of weekend MVA. We chose a weekend day for comparison because the deployment schedule resulted in having more complete data for a weekend day without wearing the vest (100%) than for a second non-vest weekday (2%) (Supplemental Fig. 2).
Data were analyzed for 142 children with complete wrist based accelerometer data (n = 21 missing). Sign ranked tests were used to compare time spent in MVA on: 1. vest vs. non-vest days, 2. baseline variation (non-vest weekday vs. weekend), and 3. vest vs. non-vest days compared to baseline variation (difference of differences). Kruskal Wallis tests were used to compare vest vs. non-vest days across demographic strata (age, sex, race/ethnicity, weight classification, asthma diagnosis, season of recruitment (NYC heating season, October-April, vs. non-heating season)) and questionnaire responses. Age was categorized into tertiles based on the total sample enrolled (n = 163). All analyses were performed using SAS 9.4. Consent and assent were obtained from all participants and the study was conducted in accordance with Columbia University Institutional Review Board guidelines.
3. Results
Demographic characteristics for the 142 children are shown in Table 1. When asked if activity while wearing the vest mimicked normal activity, 71% (n = 101) reported very much or exactly, 17% (n = 24) more or less and 12% (n = 17) very little or not at all. Thirty-eight percent (n = 53) reported they removed the vest other than while sleeping or bathing. Of the 53 children that removed the vest 46% (n = 24) removed it for sports practice or gym class, 4% (n = 2) because it was uncomfortable, 7% (n = 4) because it was too hot and 43% (n = 23) for “other” reasons. Thirty-seven percent of children (n = 19) reported they removed it for > 60 min. Children that removed the vest were older (mean 12.7 ± 0.9 years) compared to children that did not remove the vest (mean 12.3 ± 1.3 years) (P = 0.03).
Table 1.
Demographic characteristics for the children included vs excluded in this analysis.
| Included (N = 142) | Not Includede (N = 21) | P-value | |
|---|---|---|---|
| Age in years, median (range) | 12.4 (9.2 – 14.3) | 13.2 (12.0 – 14.0) | < 0.01 |
| Females, n (%) | 73 (51%) | 11 (52%) | 0.93 |
| Race/ethnicity, n (%) | 0.15 | ||
| African American | 51 (36%) | 11 (52%) | |
| Dominican | 91 (64%) | 10 (48%) | |
| Weight category, n (%) | 0.68 | ||
| Overweighta | 39 (27%) | 5 (24%) | |
| Obeseb | 36 (25%) | 4 (19%) | |
| Heating seasonc, n (%) | 74 (52%) | 12 (57%) | 0.67 |
| Asthmad, n (%) | 80 (56%) | 12 (57%) | 0.94 |
Median and range are included for age.
Overweight defined as BMI ≥ 85th percentile and < 95th percentile for age and sex. Obese defined as BMI greater than the 95th percentile for age and sex.
New York City cold weather season, October–April.
Asthma diagnosis determined by a physician at age 5–12 based on standardized criteria (Donohue et al., 2013).
Due to incomplete accelerometry data.
On average, children were less active on vest days compared to non-vest days (mean difference = 23.1 ± 169 min, P < 0.01). At baseline while not wearing the vest, children were less active on weekends compared to weekdays (mean difference = −26.7 ± 131 min, P = 0.01). There was no difference in vest vs. non-vest day activity compared to baseline variation (P = 0.84). Children that were overall most active had greater differences in vest vs. non-vest day activity compared to children that were less active (Fig. 1).
Fig. 1.
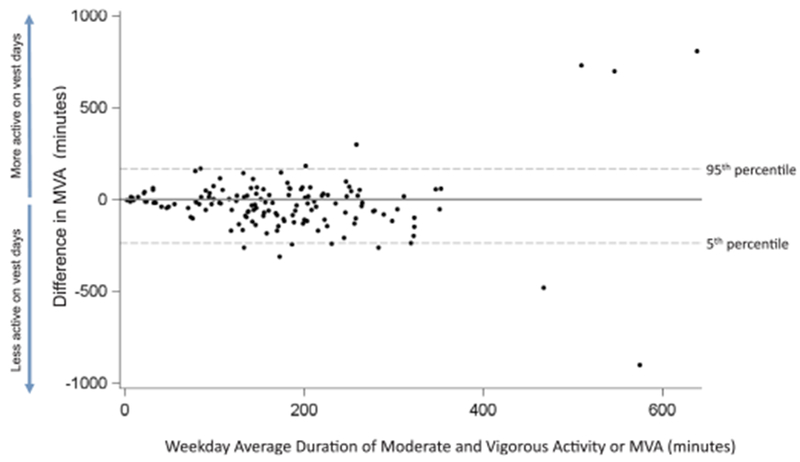
Bland-Altman plot of average duration of moderate and vigorous activity (MVA) in minutes with and without exposure monitor (vest day and nonvest day) on the x-axis, compared to the difference in MVA time on the y-axis. Children that were most active (highest average MVA time) also had greatest difference in activity on vest versus non-vest days.
To examine characteristics associated with the differences in activity between vest and non-vest days, we stratified analysis by demographic characteristics. The differences for younger children (< 12.2 years) were larger (i.e. less active on vest days) in comparison to the differences for older children (P = 0.03, Fig. 2). Similarly, Dominican children were less active on vest days compared to African American children (P = 0.03, Fig. 2). There were no differences across strata for gender, weight category, asthma diagnosis, or season (P > 0.05, Fig. 2) or in non-vest day and weekend activity (P > 0.05, Supplemental Fig. 3). Children that reported removing the vest for shorter periods (≤ 60 min) were less active on vest days, based on accelerometer data, compared to children that reported removing the vest for longer periods (> 60 min) (P = 0.03, Supplemental Fig. 4). Children’s responses to the other questions (was activity similar with vest, was the vest comfortable, was it removed and why was it removed) were not associated with difference in activity on vest vs. non-vest days (P > 0.05, Supplemental Fig. 4).
Fig. 2.
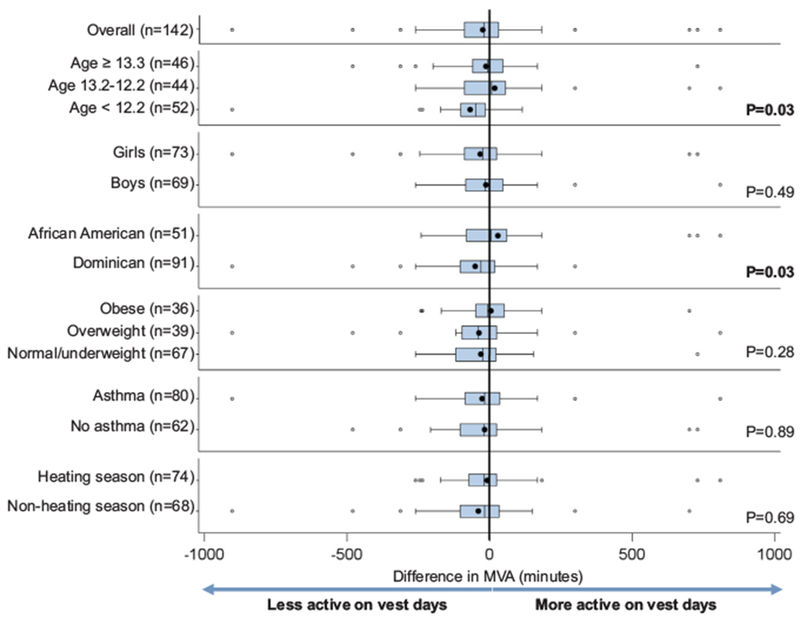
Comparison of durations of moderate and vigorous physical activity (MVA) for vest day versus non-vest day (duration vest day minus duration non-vest day) in minutes, stratified by various participant characteristics. P values in right column represent differences between strata within each group (Kruskal Wallis test).
Of the children that reported removing the vest, 70% (n = 37) reported it was right next to them or in the same room, 13% (n = 7) in the same building and 17% (n = 9) nowhere near them. Seventy-nine percent (n = 111) reported the vest was comfortable and 88% (n = 123) would wear the exposure vest again.
4. Discussion
In our NYC cohort of early adolescents we have demonstrated that on average, variation in activity level on personal air pollution sampling days versus non-sampling days were similar to the observed baseline difference in day-to-day activity. These results mirror the perception of the majority of the children (71%) that reported their activity while wearing the equipment mimicked their usual activity. Our findings suggest that overall, the method with which we deployed the personal air pollution samplers did not significantly influence usual patterns of behavior in children; however, small differences may be observed in certain subgroups, particularly younger children.
Previous studies have demonstrated that gender, obesity and season (Cook et al., 2017; Sera et al., 2017) all influence physical activity. However, based on our findings none of the aforementioned characteristics or previous diagnosis of asthma impacted physical activity while wearing or not wearing the personal exposure equipment. Younger children were less physically active while wearing the exposure vest compared to older children. This may be due to younger children being more active during free play compared to older children, as noted by others (Mooses et al., 2016); and perhaps the vest was more uncomfortable during typical free play. Future studies of physical activity should consider that potential misclassification in younger children may bias results towards the null. Also in our cohort, Dominican children were less active on vest days compared to African American children. This observation is similar to a prior study in Denver Colorado, in which African American children were more compliant with engaging in 60-min or more of physical activity or participating in team sports, compared to Hispanic teens (Cook et al., 2017).
The increased activity on weekdays compared to weekends at baseline may be explained by several different behaviors. Commuting to school and moving between classrooms provides activity that does not occur on weekends. As part of many school curricula children engage in physical education classes. Some children participate in after-school sports programs, which may contribute significantly to their week-day activity level (Mooses et al., 2016). Thus, comparing weekday to weekend activity likely represents the greatest variation in baseline physical activity that might be observed across a week.
Depending on the type of exposures being studied, it may be acceptable to keep air monitors close to but not on the physical person (e.g., when there are no significant sources or sinks of exposure immediately adjacent to the subject). In other situations personal monitoring is necessary to avoid exposure misclassification (e.g., allergen or endotoxin studies where personal cloud / resuspension mechanism drives personal exposure) (Rabinovitch et al., 2005). Based on self-reported questionnaires participants largely followed instructions and kept the vest nearby when not wearing it. The weakness of self-report is leading us to develop technologies for personal exposure monitors that can automatically and objectively measure the relative location of the air monitor and participant for future studies.
Despite our approach of comparing physical activity across several different days within a single week, our study is limited by a cross-sectional design. Our approach of comparing vest day vs. non-vest day activity to weekday vs. weekend activity was designed to capture maximal daily variation in activity during a single week. Weekday non-vest activity comparisons would have been informative but were not feasible given the design of the parent study. Future studies should compare days where the only variable that changes is the exposure monitoring. Our cohort was highly selective (African American and Dominican children) and enriched for children with asthma as this was the intent of the parent study; this approach limits generalizability to the larger population. Replication studies in populations of children of different race/ethnicity and diseases are warranted. Our questionnaire data were subject to recall bias; however, the observations made in the questionnaire responses appeared consistent with the data collected from the accelerometers. Finally, continuous monitoring of activity could have resulted in modified behavior; however, children were monitored in their natural environment and watches are a socially acceptable burden to most individuals, thus reducing the impact of the observer effect.
Despite the above-mentioned limitations, our findings suggest that physical activity in our cohort while wearing the personal exposure vest did not differ greatly from usual fluctuations in activity. This finding is critical as the field of environmental health sciences expands to more sophisticated methods of measuring inhaled dose of pollution that can vary with different levels of activity. Our findings support the use of personal air pollution exposure equipment when considering the impact of physical activity in natural environments, including among children. However, it cannot be stressed enough that every cohort is different and the method of wearing an air monitor can affect multiple cohorts very differently. We propose that the type of approach we used here based on multiple accelerometers should be repeated for any personal exposure study to objectively quantify whether the method that air monitors are worn impacts activity levels and activity associated exposures.
Supplementary Material
Acknowledgments
Funding information
4R01ES013163, 3R01ES013163-07S1, P01ES09600, P50ES015905, P30ES09089, U01EB021983, KL2 TR00008, Amos Medical Faculty Development Award
Footnotes
Appendix A. Supporting information
Supplementary data associated with this article can be found in the online version at http://dx.doi.org/10.1016/j.envres.2018.06.017.
References
- Cai J, et al. , 2013. Optimization approaches to ameliorate humidity and vibration related issues using the microAeth black carbon monitor for personal exposure measurement. Aerosol Sci. Technol 47, 1196–1204. [DOI] [PMC free article] [PubMed] [Google Scholar]
- Cook JA, 2017. Associations of adolescent weight status and meeting national obesity-related recommendations. J. Sch. Health 87, 923–931. [DOI] [PubMed] [Google Scholar]
- Davies G, Whyatt JD, 2014. A network-based approach for estimating pedestrian journey-time exposure to air pollution. Sci. Total Environ 485–486, 62–70. [DOI] [PubMed] [Google Scholar]
- Jung KH, et al. , 2017. Effect of personal exposure to black carbon on changes in allergic asthma gene methylation measured 5 days later in urban children: importance of allergic sensitization. Clin. Epigenetics 9, 61. [DOI] [PMC free article] [PubMed] [Google Scholar]
- Koehler KA, Peters TM, 2015. New methods for personal exposure monitoring for airborne particles. Curr. Environ. Health Rep 2, 399–411. [DOI] [PMC free article] [PubMed] [Google Scholar]
- Lim SS, et al. , 2012. A comparative risk assessment of burden of disease and injury attributable to 67 risk factors and risk factor clusters in 21 regions, 1990–2010: a systematic analysis for the Global Burden of Disease Study 2010. Lancet 380, 2224–2260. [DOI] [PMC free article] [PubMed] [Google Scholar]
- Lovinsky-Desir S, et al. , 2014. Urban adolescents readily comply with a complicated asthma research protocol. Clin. Med. Insights Circ. Respir. Pulm. Med 8, 5–9. [DOI] [PMC free article] [PubMed] [Google Scholar]
- Mooses K, et al. , 2016. Different methods yielded two-fold difference in compliance with physical activity guidelines on school days. PLoS One 11, e0152323. [DOI] [PMC free article] [PubMed] [Google Scholar]
- Oravisjarvi K, et al. , 2011. Effects of physical activity on the deposition of traffic-related particles into the human lungs in silico. Sci. Total Environ 409, 4511–4518. [DOI] [PubMed] [Google Scholar]
- Perera FP, et al. , 2003. Effects of transplacental exposure to environmental pollutants on birth outcomes in a multiethnic population. Environ. Health Perspect 111, 201–205. [DOI] [PMC free article] [PubMed] [Google Scholar]
- Rabinovitch N, et al. , 2005. Importance of the personal endotoxin cloud in school-age children with asthma. J. Allergy Clin. Immunol 116, 1053–1057. [DOI] [PubMed] [Google Scholar]
- Rodes CE, et al. , 2012. Predicting adult pulmonary ventilation volume and wearing compliance by on-board accelerometry during personal level exposure assessments. Atmos. Environ 57 (1994), 126–137. [DOI] [PMC free article] [PubMed] [Google Scholar]
- Sera F, et al. , 2017. Using functional data analysis to understand daily activity levels and patterns in primary school-aged children: cross-sectional analysis of a UK-wide study. PLoS One 12, e0187677. [DOI] [PMC free article] [PubMed] [Google Scholar]
- Vincent JH, 2012. Occupational and environmental aerosol exposure assessment: a scientific journey from the past, through the present and into the future. J. Environ. Monit 14, 340–347. [DOI] [PubMed] [Google Scholar]
Associated Data
This section collects any data citations, data availability statements, or supplementary materials included in this article.