Abstract
We turnover billions of apoptotic cells daily, and these are removed by professional and non-professional phagocytes via efferocytosis1. Characterizing the transcriptional program of phagocytes, we discovered a novel solute carrier family (SLC) gene signature (involving 33 SLC members) that is specifically modified during efferocytosis, but not antibody-mediated phagocytosis. Assessing the functional relevance of these SLCs, we noted a robust induction of an aerobic glycolysis program in efferocytic phagocytes, initiated by SLC2A1-mediated glucose uptake, with concurrent suppression of oxidative phosphorylation program. Interestingly, the different steps of phagocytosis2, i.e. smell (‘find-me’ signals/ sensing factors released by apoptotic cells), taste (phagocyte-apoptotic cell contact), and ingestion (corpse internalization), activated different SLCs and other molecules to promote glycolysis. Further, lactate, a natural by-product of aerobic glycolysis3, was released via another SLC (SLC16A1) that was upregulated after corpse uptake. While glycolysis within phagocytes contributed to actin polymerization and the continued uptake of corpses, the lactate released via SLC16A1 influenced the establishment of an anti-inflammatory tissue environment. Collectively, these data reveal a novel SLC program activated during efferocytosis, identify a previously unknown reliance on aerobic glycolysis during apoptotic cell uptake, and that glycolytic byproducts of efferocytosis can also influence other cells in the microenvironment.
How a phagocyte maintains its homeostasis while coordinating corpse uptake, processing ingested materials, and secreting anti-inflammatory mediators is incompletely understood1,2. To define potential pathways involved, we performed RNA sequencing of LR73 hamster phagocytes engulfing apoptotic human Jurkat cells (to clearly distinguish phagocyte-derived RNA, Fig. 1a, and Extended Data1). Efferocytic phagocytes modified multiple transcriptional programs, including the decreased pro-inflammatory gene expression, increased expression of actin rearrangement/cell motility genes, and anti-inflammatory mediators, consistent with previous findings4,5 (Fig. 1a). We also uncovered new gene programs such as upregulation of glycolysis-associated genes, and downregulation of genes required for oxidative phosphorylation (OXPHOS), fatty acid oxidation (FAO), and de novo cholesterol synthesis (Fig.1a, and Supplemental Table 1).
Figure 1. Transcriptional programs initiated during efferocytosis.
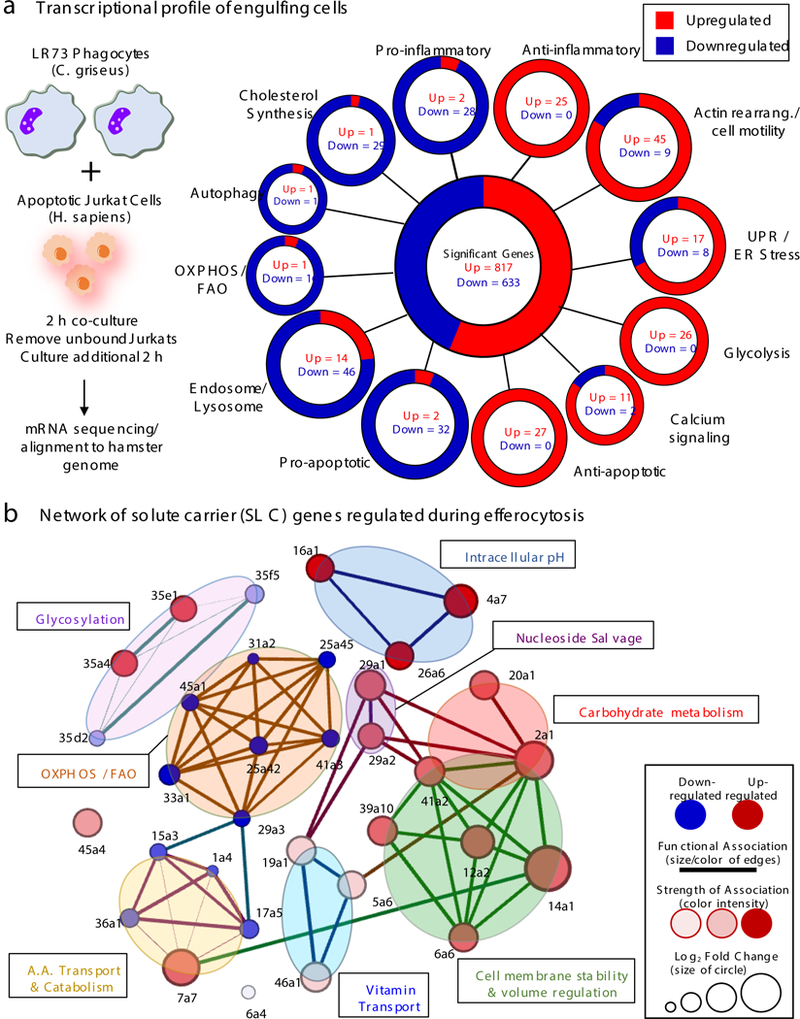
(a) Phagocytes regulate distinct transcriptional modules during efferocytosis. LR73 hamster fibroblasts were incubated with apoptotic human Jurkat cells and RNAseq performed. Focusing on hamster-derived mRNA, the 1450 total genes modulated were categorized per primary function and sequence similarity. Significance was assigned if multiple-comparisons and adjusted p value per DESeq2 algorithm was < 0.1. Data are from four independent experimental replicates. (b) Differentially regulated SLC genes are represented using network analysis to determine family clusters (shaded areas) and connectedness between individual SLCs.
We also noted extensive modulation of genes encoding solute carrier (SLC) proteins. SLCs are membrane proteins located in the plasma membrane and mitochondrial/other internal membranes, facilitating transfer of different molecules, including sugars, nucleotides, and amino acids6–8. Among the 400 SLCs (in 52 families), mutations in ~100 SLCs are linked to human diseases6–8. In LR73 phagocytes, 33 SLCs (out of 165 detected) were modified during efferocytosis: 19 upregulated and 14 downregulated (Extended Data 2, and Supplemental Table 2). As relatively little is known about SLC proteins in efferocytosis, we addressed this further.
We curated the 33 SLCs based on linkage to physiological processes, experimentally or by homology (Extended Data 2b). We constructed an integrated network of how each SLC and its assigned functions linked with other SLCs modified during efferocytosis (Fig. 1b). All but two SLCs (Slc6a4 and Slc45a4) could be clustered into eight categories: carbohydrate metabolism; intracellular pH regulation; membrane stability and volume regulation; nucleoside salvage; vitamin transport; glycosylation; amino acid transport and catabolism; and, OXPHOS/FAO. This analysis also revealed coordinate regulation of SLCs linked to particular physiological function(s); multiple SLCs associated with carbohydrate metabolism were upregulated, while OXPHOS- and FAO-linked SLCs were downregulated (Fig. 1b). The SLC expression changes were confirmed by qPCR (hamster-specific primers) (Extended data 3a,b). Thus, efferocytosis induces a specific SLC signature impacting multiple physiological processes.
Mouse peritoneal macrophages showed similar SLC modulation during efferocytosis, suggesting similar responses in professional and non-professional phagocytes (Fig. 2a, Extended Data 3b and Supplemental Table 3). Interestingly, macrophages ingesting anti-CD3 coated Jurkat cells (with comparable phagocytosis), did not show a change in the same SLCs, except for Slc29a2 and Slc29a3 (changing in opposite directions) (Fig. 2a). Thus, beyond the cargo itself, the type of phagocytic receptors used influences the SLC program in phagocytes. Further, after peritoneal injection of apoptotic Jurkat cells, the efferocytic CD11bhigh F4/80high macrophages showed similar changes in SLC gene expression as in vitro efferocytosis (Fig. 2b).
Figure 2. Specific SLC signatures induced during different contexts of efferocytosis.
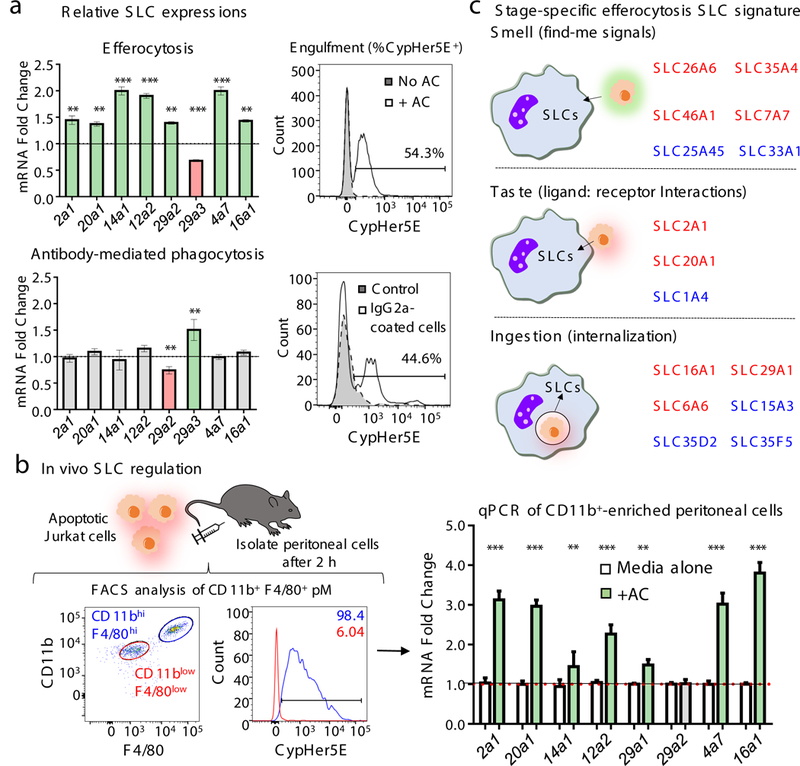
(a) SLC signature during efferocytosis is distinct from antibody-mediated phagocytosis. Peritoneal macrophages were incubated with apoptotic or anti-CD3 (IgG)-coated Jurkat cells, and qPCR of mouse SLC genes performed. Upregulated (green), downregulated (red), and unchanged (grey) are shown. (right) CypHer5E fluorescence within macrophages engulfing the targets. **p < .01, ***p < .001. Two independent experiments with 3–4 replicates per condition. (b) SLC modulation in efferocytic peritoneal macrophages in vivo. (left) Flow cytometric profiles of CD11bhighF4/80high and CD11blowF4/80low macrophages, and engulfing peritoneal macrophages (CypHer5e+). (right) qPCR using mouse-specific primers. **p < .01, ***p < .001. Data represent two replicates with 6 mice per group/experiment. (c) Specific SLC signature during different stages of efferocytosis. RNAseq was performed using mRNA from LR73 cells treated (4hr) with supernatants of apoptotic cells, or CytoD-treated LR73 cells incubated with apoptotic cells. SLC genes altered by supernatant alone (Smell), and CytoD-sensitive SLCs (Ingestion) were used to identify ligand:receptor responding SLCs (Taste) (red, upregulated; blue, downregulated). For clarity, SLCs in more than one stage are not shown.
In an efferocytosis time course, some SLCs were upregulated early (0–4hr), while others were upregulated later (>4h). Even within a group linked to a particular function, some SLCs were modulated early and others later. These changes were not strict, and the mRNA and protein changes occurred as a continuum (Extended Data 4).
Distinct stages/phases in the efferocytosis has been defined, including1,2: (i) apoptotic cells and phagocytes communicating via soluble mediators/find-me signals - ‘smell’ phase; (ii) ligand:receptor interactions between apoptotic cells and phagocytes – ‘taste’ phase; and (iii) corpse internalization and processing – ‘ingestion’ phase. We performed and compared RNAseq analyses between LR73 cells treated only with apoptotic cell supernatants (smell), and phagocytosis using LR73 cells treated with cytochalasin D, which allows corpse binding without internalization, to identify taste versus ingestion specific SLCs (Fig. 2c). This helped identify SLCs specifically modified during different stages of efferocytosis (Fig. 2c), and some SLCs regulated during more than one phase. These data, using SLC induction as a readout, provide further evidence for the continuous communication between apoptotic cells and phagocytes.
Efferocytosis is an energy-intensive process, requiring energy for dynamic actin rearrangement to engulf corpses often nearly the size of the phagocyte9. We focused on SLC2A1 (GLUT1), a glucose transporter that facilitates glucose uptake from the extracellular medium28,34−36, as SLC2A1 was strongly upregulated in LR73 cells and macrophages early during efferocytosis (Fig.2 and Extended Data 4b). First, LR73 cells overexpressing SLC2A1 showed increased efferocytosis (Fig. 3a). Second, STF-31, a small molecule targeting SLC2A1, reduced the efferocytosis of wild type and SLC2A1-overexpressing LR73 cells (Fig. 3a). Third, siRNA knockdown of Slc2a1 reduced corpse uptake (Fig. 3b), which was rescued by siRNA-resistant Slc2a1 (Fig.3b). Fourth, LR73 cells lacking Slc2a1 (via CRISPR/Cas9 deletion) showed reduced efferocytosis (Fig. 3c). Fifth, Slc2a1-deficient bone marrow-derived macrophages (BMDM) displayed decreased efferocytosis (Fig. 3d), without affecting antibody-mediated phagocytosis (which does not modulate Slc2a1 expression) (Extended Data 5a). Deletion efficiencies for Slc2a1 are shown in Extended Data 5b-d.
Figure 3. SLC2A1 promotes glucose uptake and efferocytosis.
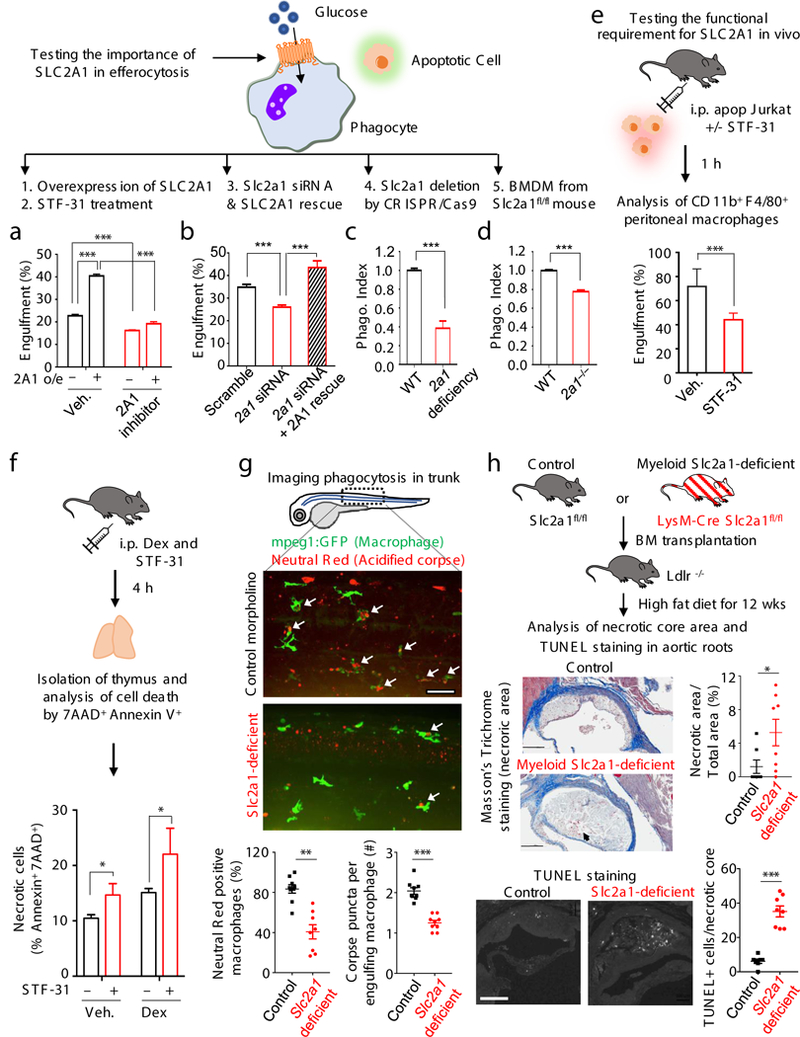
(a-d) SLC2A1 function during efferocytosis addressed by five approaches. In b, ‘rescue’ used siRNA-resistant Slc2a1 cDNA. In c, deletion in BMDM from Slc2a1fl/fl mice was achieved via TAT-Cre. Phagocytosis index, % experimental / % control engulfment. ***p < .001. Data from >2 independent experiments with 3–4 replicates per condition. (e) The SLC2A1 inhibitor STF-31 reduces efferocytosis in vivo. (f) STF-31 promotes accumulation of necrotic thymocytes after dexamethasone-induced apoptosis in vivo. *p < .05. Data represent two independent experiments with 3–4 mice per group. (g) Targeting slc2a1 reduces efferocytosis in zebrafish. Tg(mpeg1:GFP) embryos were injected with control or slc2a1 morpholino. Neutral Red was used to preferentially stain acidic organelles. slc2al-targeted morphants (50hpf) displayed less apoptotic cell engulfment (Neutral Red-positive GFP-macrophages) in the trunk region, 3 areas and 3 fishes per group, mean±SD. **p < .01. (h) Increased necrotic atherosclerotic area and TUNEL+ cells after myeloid-specific deletion of Slc2a1. (top) Schematic of BM chimera using Slc2a1fl/fl and LysM-Cre Slc2a1fl/fl mice. (middle) Serial interrupted 5μm sections stained with Masson’s Trichrome. Representative photomicrographs and quantification of necrotic core area normalized to total area. (bottom) TUNEL staining and quantitation of TUNEL+ cells per necrotic core. 7–8 mice per group, mean±SEM. *p < .05, *p < .001. (Scale Bar = 200μm).
In vivo, administration of STF-31 (bioactive in vivo10) prior to injection of apoptotic Jurkat cells decreased the efferocytosis by peritoneal macrophages (Fig. 3e), but not anti-CD3-coated Jurkat cells (Extended data 5e). Controlling for off-target effects, STF-31 did not further reduce efferocytosis of Slc2a1-deficient LR73 or BMDM (Extended data 5f). We also tested corpse clearance in the thymus after apoptosis-induction via dexamethasone injection11, with or without co-injection of STF-31. A modest increase in uncleared/ secondarily necrotic thymocytes was seen due to STF-31 alone, and a significant increase in necrotic thymocytes after dexamethasone+STF-31 treatment (Fig. 3f, and Extended data 5g).
To complement the pharmacological approach, we also took two genetic approaches. First, using zebrafish expressing GFP in macrophages [Tg(mpeg1:GFP)], we targeted the Slc2a1 orthologue via morpholino oligonucleotide (MO) injection12. In control morpholino-treated embryos, the GFP+ macrophages showed numerous neutral red+ phagocytic puncta (inside and/or associated), while slc2a1 morphants showed fewer such associations (Fig. 3g). Quantifying z-stack images and focusing on macrophages in the trunk region, slc2a1 morphants showed fewer neutral red+ macrophages, and less neutral red staining per macrophage (Fig. 3g). This also suggested an evolutionarily conserved role for SLC2A1. We also tested Slc2a1 requirement in a mouse model of atherosclerosis, as defective apoptotic cell clearance can manifest as increased necrotic cores within plaques1,13. Bone marrow transplantation was done using cells from myeloid-targeted LysM-Cre-Slc2a1fl/fl mice (which did not affect myeloid differentiation) into atherosclerosis-prone Ldlr−/− mice. After Western diet feeding (12wk), there was a significant increase in the necrotic core area in the aortic roots of mice lacking Slc2a1 in the myeloid lineage (Fig. 3h). The number of TUNEL positive nuclei (late apoptotic cells) also significantly increased within necrotic cores, implying defective corpse clearance (Fig. 3h). Taken together, SLC2A1 contributes to engulfment of apoptotic cells both in vitro and in vivo.
Mechanistically, as SLC2A1/GLUT1 is a glucose transporter8,14, we asked whether glucose uptake is important for efferocytosis. Switching LR73 cells to glucose-free media at the initiation of efferocytosis reduced uptake (Fig. 4a); conversely, adding exogenous glucose increased uptake (Fig. 4a), a phenotype attenuated by silencing Slc2a1 (Extended Data Fig. 6a). When we directly measured glucose uptake using the non-metabolizable glucose analog 2-deoxyglucose (2-DG), ~3-fold more 2-DG was taken up during efferocytosis (Fig. 4b). Further, 2-DG pre-treated phagocytes showed decreased efferocytosis (Extended Data 6b). Thus, SLC2A1-mediated glucose uptake is an important step in efferocytosis.
Figure 4. Glycolytic pathway intermediates facilitate efferocytosis.
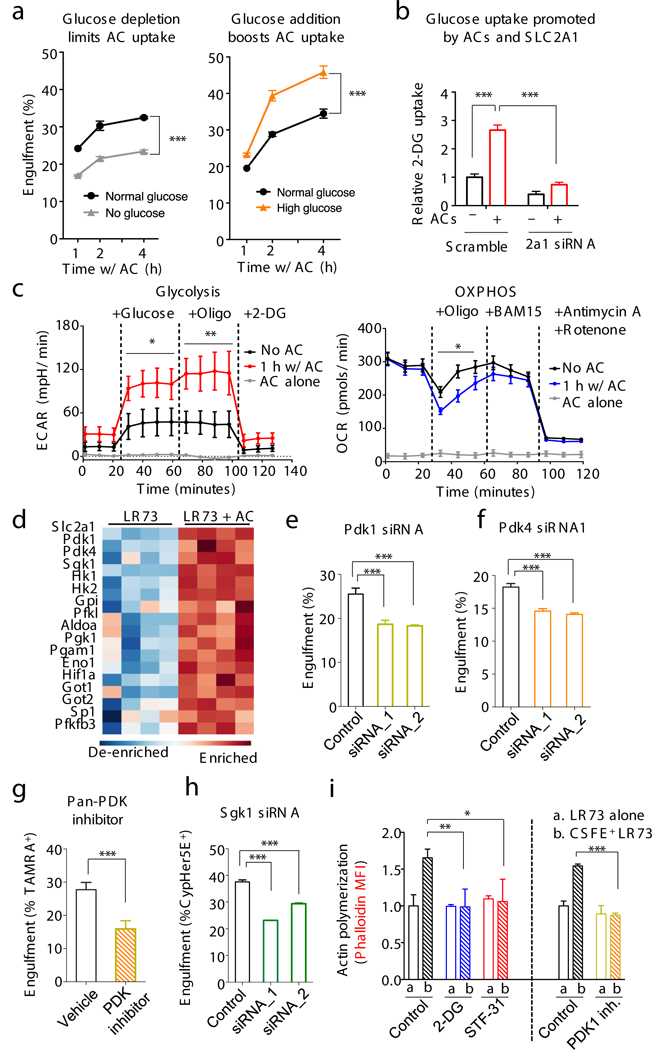
(a) Efferocytosis is affected by media glucose concentration. Physiological glucose (1mg/ml, black), no glucose (grey), or high glucose (5mg/ml, orange). Glucose was supplemented when apoptotic cells were added. ***p < .001. Data from ≥3 independent experiments with 2–3 replicates per condition. (note: this differs from long-term glucose-free pretreatment of phagocytes11). (b) Increased glucose uptake via SLC2A1 during efferocytosis. LR73s were co-cultured with apoptotic Jurkat cells (2hr), washed, and 2-DG uptake measured. ***p < .001. Data from two independent experiments with 3 replicates each. (c) Phagocytes increase glycolysis during apoptotic cell clearance. Glycolysis and oxidative phosphorylation were measured during efferocytosis (with Seahorse XF) via extracellular acidification (ECAR, mpH/min) and oxygen consumption (OCR, pmol/min) rates. Mean+/−SD is shown. Two replicates per condition in two independent experiments. *p < .05, **p < .01. (d) Heatmap showing upregulation of glycolysis-associated genes during efferocytosis. (e-h) Effect of siRNA targeting of Pdk1, Pdk4 or Sgk1 in LR73 cells (e, f, h) or pan-PDK inhibitor (g) on efferocytosis. ***p< .001. Data represent three independent experiments with 3–4 replicates per condition. (i) F-actin formation during efferocytosis. LR73 phagocytes were mixed with CFSE-labeled apoptotic thymocytes (30min), stained with phalloidin (F-actin), and assessed by flow cytometry (MFI shown). PDK1 inhibitor data were performed separately. *p < .05, **p < .01, ***p < .001. Data represent ≥3 independent experiments with 3–4 replicates.
Seahorse analysis of LR73 phagocytes (Fig 4c) or BMDMs (Extended Data 6c) showed increased aerobic glycolysis in engulfing phagocytes, and decreased oxidative phosphorylation (Fig 4c). Mining the RNAseq data of engulfing phagocytes (Fig.1a) revealed a striking upregulation of multiple genes involved in sequential steps of glycolysis (Fig. 4d, and Extended Data 6d), with concurrent downregulation of OXPHOS and FAO genes. Functionally, siRNA-mediated knockdown of PDK1 (Fig. 4e) or PDK4 (Fig. 4f), which promote aerobic glycolysis15, and a pan-PDK inhibitor (Fig.4g) resulted in reduced efferocytosis. Interestingly, when we compared BMDMs treated with a pan-PDK inhibitor to block aerobic glycolysis versus rotenone and antimycin A1 to block OXPHOS, the PDK inhibition reduced efferocytosis but not antibody-mediated phagocytosis, while OXPHOS inhibition reduced the FcR-mediated uptake, but not efferocytosis (Extended Data 7a).
SGK1 kinase, which phosphorylates SLC2A1 to promote its optimal membrane expression, was also upregulated during efferocytosis (Fig. 4d and Extended Data 6d)16. Targeting SGK1 by siRNA or an inhibitor decreased engulfment (Fig. 4h and Extended Data 7b). Further, efferocytic BMDM from transgenic mice with an extracellular Myc-tag in SLC2A114 showed more Myc-SLC2A1, which was stunted by SGK1 inhibition (Extended Data 7c).
Phagocytes often ingest multiple apoptotic corpses sequentially11. To address whether SLC2A1 is required for the uptake of the first corpse or the continued uptake, we treated phagocytes with inhibitors for SLC2A1 or SGK1 from the beginning or at different times during efferocytosis. SLC2A1 function was needed for taking up the first corpse, and for continued uptake of additional corpses (Extended Data 7d).
Corpse internalization requires significant actin polymerization, and aerobic glycolysis has been linked to actin polymerization during cell migration1,9. Increased actin polymerization in efferocytic phagocytes (via phalloidin staining) was inhibited by either STF-31 or 2-DG treatment (Fig. 4i). Further, inhibiting PDK1, which favors aerobic glycolysis, also reduced F-actin formation (Fig. 4i). Thus, SLC2A1-mediated glucose uptake, and glucose usage in aerobic glycolysis contributes to actin polymerization during efferocytosis.
Remarkably, distinct steps of this SLC2A1-dependent aerobic glycolysis in phagocytes were regulated by the smell, taste, and ingestion phases of efferocytosis (Fig. 5a-c). Apoptotic supernatant was sufficient to increase Sgk1 expression, but not Slc2a1 (Fig. 5a). ATP (a known find-me signal)17 was by itself capable of upregulating Sgk1 (Extended Data 8a). In comparison, the binding of apoptotic targets or PtdSer liposomes to phagocytes (without internalization) was sufficient to induce Slc2a1 (Fig. 5b). Masking PtdSer on targets (via a GST-TSR) reduced upregulation of Slc2a1 (but not Sgk1) during efferocytosis (Extended Data 8b). Thus, SGK1, triggered by factors released from apoptotic cells ‘prepares the phagocytes’ by promoting endogenous SLC2A1 on the plasma membrane, and PtdSer-dependent interactions further increase SLC2A1 expression via new transcriptional induction.
Figure 5. SLC16A1-mediated lactate release promotes an anti-inflammatory environment.
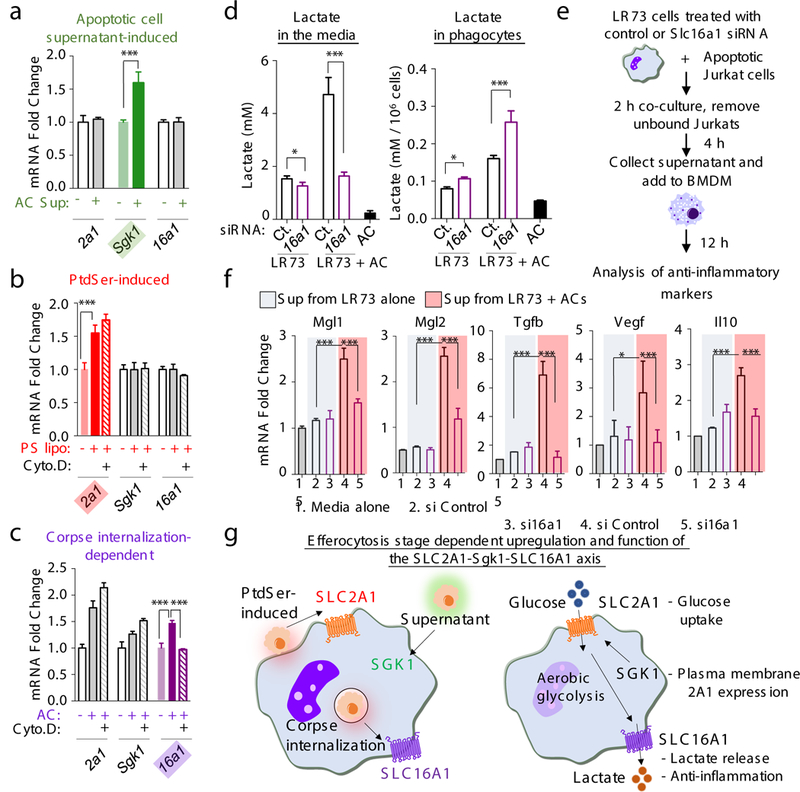
(a-c) qPCR of Slc2a1, Slc16a1, and Sgk1 during distinct steps of efferocytosis. Supernatants from apoptotic cells, PtdSer-containing liposomes, or apoptotic cells (AC) were added to LR73 cells with or without cytochalasin D (1μM) for 4h, and qPCR performed. ***p < .001. (d) Lactate release from efferocytic phagocytes. LR73 cells (control or Slc16a1 siRNA) were incubated with apoptotic cells, washed, incubated an additional 4h, and lactate measured. ***p < .001. *p < .05. Data in a-d represent two independent experiments with 3–4 replicates per condition. (e) Schematic of supernatant preparation from LR73 phagocytes, adding supernatants to BMDMs, and analysis. (f) Determination of anti-inflammatory genes by qPCR. ***p < .001. Data represent two independent experiments with 2–3 replicates per condition. (g) Schematic of the upregulation and function of the SLC2A1-SGK1-SLC16A1 axis during efferocytosis.
A byproduct of aerobic glycolysis is lactate. Interestingly, in efferocytic phagocytes, we noted higher expression of Slc16a1, a plasma membrane proton-linked monocarboxylate transporter for lactate and pyruvate18, after corpse internalization (Fig. 1b, 2a-c, 5c and Extended Data 8b). Functionally, siRNA-mediated knockdown of Slc16a1 in LR73 cells reduced efferocytosis in vitro (Extended Data 8c), and SR13800, a bioactive inhibitor of SLC16A1, reduced uptake by peritoneal macrophages in vivo (Extended Data 8d). When we measured lactate levels, supernatants of engulfing LR73 cells contained 3-fold more lactate (~5mM) compared to phagocytes without apoptotic cells (~1.5mM) (Fig. 5d). siRNA knockdown of caused lower lactate level in the supernatants (~2mM), with concomitant accumulation within phagocytes (Fig. 5d). Thus, SLC16A1 contributes significantly to lactate release from engulfing phagocytes.
Lactate released from solid tumors could act on naïve macrophages to induce M2-like polarization3. To test whether factors released via SLC16A1 during efferocytosis might also promote anti-inflammatory skewing of naive macrophages19, we tested supernatants from engulfing LR73 phagocytes on BMDM (Fig. 5e). This induced upregulation of anti-inflammatory macrophage genes such as Tgfb and Il10 as well as anti-inflammatory/M2-like markers including Vegf, Mgl-1, Mgl-2, and CD206, while the pro-inflammatory markers (Tnfa and Il6) were not affected. Slc16a1 knockdown in engulfing LR73 cells attenuated this effect (Fig. 5f, Extended Data 8e and f). Thus, aerobic glycolysis induced during efferocytosis affects at least two steps: corpse uptake itself via actin polymerization (involving SLC2A1), and modulating the anti-inflammatory gene expression in neighboring cells (via SLC16A1).
The data presented in this manuscript provide several key insights. Although SLC family is the second largest among membrane proteins (after GPCRs), there is much less knowledge on SLC function in specific physiological contexts49. This work details a coordinated regulation of select SLCs during efferocytosis (Fig. 5g). The smell, touch, and ingestion phases of efferocytosis induce distinct and overlapping sets of SLC genes with functional consequences, distinguishable from antibody-mediated phagocytosis. Metabolically, efferocytosis induces a gene program promoting glucose uptake and subsequent glycolysis, with concurrent downmodulation of genes linked to OXPHOS and FAO. Although efferocytic macrophages are more M2-like20, and M2-like macrophages are reported to be OXPHOS-dependent21, our studies in the first few hours of efferocytosis does not rule out a role for OXPHOS at later times. Although glycolysis is linked to inflammation22, efferocytic phagocytes can influence non-engulfing naïve macrophages in the tissue neighborhood toward anti-inflammatory polarization via the SLC16A1 mediated lactate release, and other factors released by engulfing phagocytes (such as TGFβ and IL-10).
Methods
Methods, additional references, Nature Research reporting summaries, source data, statements of data availability, and associated accession codes are available at Nature.com
In vitro engulfment assay
For induction of apoptosis, human Jurkat T cells resuspended in RPMI with 1% BSA were treated with 150 mJ/cm2 ultraviolet C irradiation (Stratalinker) and incubated for 4h at 37 °C, 5% CO2. For antibody-dependent phagocytosis, Jurkat cells were labeled with αCD3 (25μg/ml, Clone: OKT3 BioLegend) along with Annexin V recombinant protein (to block efferocytosis of any residual dying cells) (3μg/ml, eBioscience) for 1h at 4 °C and the cells were then stained with CypHer5E (GE Healthcare, PA15401) or TAMRA (Invitrogen, C-1171) before use in the engulfment assays. Chines hamster LR73 cells or murine macrophages were seeded in a 24 well plate and incubated with targets at a 1:10 phagocyte to target ratio for the indicated times. Targets were then washed with PBS. Where indicated, phagocytes were rested in culture medium for an additional period of time. Cells were dissociated from the plate with trypsin and the phagocytes were assessed by a flow cytometry-based assay or used in their analysis of RNA or protein23,24. Phalloidin staining was conducted according to the manufacturer’s instruction (Invitrogen). When primary macrophages were used as phagocyte, there is an inherent difference in the absolute % uptake of corpses between experiments performed on different days. Therefore, phagocytic index was used to better compile data from multiple experiments.
RNA sequencing
LR73 cells were co-cultured with apoptotic Jurkat cells for 2h, unbound Jurkat cells removed by washing with PBS, and the phagocytes were rested in culture medium for an additional 2h. Total RNA was extracted, and an mRNA library was prepared using the Illumina TruSeq platform, followed by sequencing using an Illumina NextSeq 500 cartridge. Four independent experiments were sequenced. Rv3.2.2 was used for graphical and statistical analysis and the R package DESeq2 was used for count normalization and differential gene expression analysis of RNAseq data. All genes were curated using a combination of literature mining and function determination (known or predicted) via Uniprot. Genes involved in multiple associated functions (e.g. kinases or cell cycle related) were excluded. We generated “functional classifications” of solute carrier (SLC) proteins based on several criteria. 1) a known function was ascribed to either the channel directly (e.g. SLC2A1 is required for glycolysis), 2) a known function was ascribed to the solute transported by the channel (e.g., SLC2A1 transports glucose, glucose is required for glycolysis, therefore SLC2A1 is required for glycolysis), or by predictive homology (e.g. SLC2A1 transports glucose and is required for glycolysis; since SLC2A4 is homologous to SLC2A1, therefore SLC2A4 may be important for glycolysis). Several SLCs have been shown or are predicted to perform multiple functions. These alternative functions are listed in a Table at the end of Extended of Data. Network analysis was performed using the network analytical software Gephi (v.0.9.1 https://gephi.org/). Standard algorithms for calculating clusters were used as implemented in Gephi. The edges and community links were calculated using the “Link Communities” plug-in based on the algorithms proposed for biological network analyses25. Network structure was determined using the Fruchterman Reingold force-directed layout algorithm. All code used for analysis is available upon request.
Quantitative RT-PCR
Total RNA was extracted from cells using RNeasy Mini Kit (Qiagen) and cDNA was synthesized using QuantiTect Reverse Transcription Kit (Qiagen) according to manufacturers’ instructions. Quantitative gene expression for hamster and mouse SLCs was performed using hamster- and mouse-sequence specific Taqman probes that are non-cross reactive with human sequences (Applied Biosystems), respectively, run on a StepOnePlus Real Time PCR System (Applied Biosystems). The catalogue numbers of Taqman primer are listed in supplemental information.
In vivo engulfment assay and quantitative RT-PCR
Six million apoptotic Jurkat cells, stained with CypHer5E, were intraperitoneally injected in 300μl volume per mouse, or as control the X-VIVO 10 media alone. At indicated times post-injection, mice were euthanized, and the peritoneal lavage was collected by 10mL of PBS + 10% FBS. The collected cells were stained with CD11b PE-Cy7 (eBioscience, Cat#: 25–0112-82) and F4/80 APC-eFluor 780 (eBioscience, Cat#: 47–4801-80), and the uptake of the injected CypHer5E positive apoptotic cells by CD11b+ F4/80hi cells was assessed by flow cytometry. For sequencing or other types of analysis of the responses of macrophages, the peritoneal macrophages were isolated using Macrophage Isolation Kit purchased from Miltenyi Biotec. To test the effect of drugs targeting SLC2A1 and SLC16A1 in vivo engulfment, mice were treated with STF-31 (Santa Cruz #sc-364692, 10mg/kg) or SR13800 (EMD Millipore # 509663, 10mg/kg) 1 h before apoptotic cell or IgG-coated cell administration. For quantitative RT-PCR, the cells collected were lysed for RNA isolation.
In vivo thymus efferocytosis assay
Six- to eight-week-old mice were injected i.p. with 300 μl PBS containing 250 μg dexamethasone (Sigma) with or without STF-31 (10mg/kg) dissolved in EtOH. 4h after injection, thymi were harvested from mice and the numbers of thymocytes with annexin V staining only (apoptotic) versus annexin V/7-AAD double positive cells (secondarily necrotic) were determined by flow cytometry.
In vivo bone marrow transplantation and analysis of necrotic cores in atherosclerosis
At six weeks of age, Ldlr−/− mice received two doses of X-ray irradiation (500cGy x 2, spaced 4 h apart; X-RAD, North Branford, CT), and then transplanted with bone marrows isolated from Slc2a1 fl/fl or LysM-Cre/Slc2a1 fl/fl donor mice. Control animals were transplanted with the HBSS buffer only, and these mice died within 10–11 days of lethal irradiation. Following bone marrow transplantation, chimeric Ldlr−/− mice were transferred to sterile cages with ad libitum access to sterile mouse chow and sterile water and were maintained on chow diet for four weeks before challenge with Western Diet (TD88137, 42% of Kcal from milk fat with 0.15% added cholesterol) from Harlan Teklad (Indianapolis, IN) for 12 weeks. Following mice dissection, hearts were isolated for formalin fixed paraffin embedded sections. The sections were stained with Masson’s trichrome for quantification of necrotic core areas and normalized to total quantified area. Necrotic core size was measured using Aperio ePathology software (Aperio, Buffalo Grove, IL). TUNEL staining was conducted according to the manufacturer’s instructions (Promega).
In vivo phagocytosis analysis in zebrafish
To inhibit the expression of slc2a1, antisense morpholinos targeting the translational start site of the zebrafish slc2a1a (5’—GGCCATCATCAGCTGAGGAGTCACC—3’) was synthesized (Gene Tools LLC, Philomath, OR). A control morpholino (5’—GGCCATCATCAGCTGAGGAGTCACC—3’) was used as negative controls. 2.5 ng of the morpholinos were microinjected into Tg(mpeg1:GFP) embryos at the one-cell stage. Embryos were treated with Phenylthiourea (0.004%) in egg water at 24 hours post fertilization (hpf) to reduce pigmentation as per standard protocols. 8–10 hours before imaging, embryos were soaked in 2.5 μg/ml Neutral Red (Sigma) in egg water. At 50 hpf, morphants were anesthetized with 3-aminobenzoic acid ester (Tricaine), immersed in 0.8% low-melting point agarose and mounted laterally in glass-bottomed 35 mm petri dishes for confocal imaging. Three identical z-stack images were taken for each embryo covering hemi-segments of somites 6 to 20. More than 100 macrophages were counted per group for the evaluation of GFP and Neutral Red colocalization.
CRISPR/Cas9 Deletion or siRNA knockdown of SLCs
Stable, individual clones of Cas9/GFP-expressing LR73 cells were generated by lentiCas9-EGFP plasmid via lentiviral transduction and a protocol adapted from Zhang and colleagues26, followed by single cell cloning of GFP –expressing cells and Cas9 expression verification. Slc2a1 was deleted from LR73 cells using two independent Cas9/GFP LR73 cell clones and using the Zhang lab lentiGuide-Puro sgRNA plasmid with two unique guides for Slc2a1. LentiCas9-EGFP was a gift from Phil Sharp & Feng Zhang (Addgene plasmid # 63592) and lentiGuide-Puro was a gift from Feng Zhang (Addgene plasmid # 52963).
Guide RNAs targeting Slc2a1 were generated using the following oligo pairs:
Guide 1:
5’---CACCGATTCTTCCGGACATCATCGC-−−3’
3’---CTAAGAAGGCCTGTAGTAGCGCAAA-−−5’
Guide 2:
5’---CACCGTTCGGCCTGGACTCCATTA-−−3’
3’---CAAGCCGGACCTGAGGTAATCAAA-−−5’.
For siRNA and plasmid transduction experiments, LR73 cells were treated with Lipofectamine 2000 (ThermoFisher) with specific siRNAs according to the manufacturer’s instructions 2 days before the engulfment assay. GLUT1-eGFP/pcDNA-DEST47 was gift from Wolf Frommer (Addgene plasmid #18729)5. siRNAs targeting hamster mRNAs were customized by GE Healthcare Dharmacon.
siRNA against Slc2a1:
5’---CCAAGAGUGUGCUGAAGAAUU---3’
Two siRNAs against Sgk1:
5’---CUUCUAUGCUGCUGAAAUAUU---3’
5’---CUGCAGAAGGACAGGACAAUU---3’
Two siRNAs against Pdk1:
5’---CGACAAGAGUUGCCUGUUAUU---3’
5’---GGACAAAAGUGCUGAAGAUUU---3’
Two siRNAs against Pdk4:
5’---UCACACAAGUAAAUGGAAAUU---3’
5’---CAUCAAAGUUCGAAACAGAUU---3’
siRNA against Slc16a1:
5’---AGAAACAGGAAGAAGGUAAUU---3’
Macrophages isolation and analysis
To obtain bone-marrow derived macrophages, femurs from control mice, or mice carrying floxed alleles of Slc2a1 or Glut1myc knock-in mice were removed and flushed with 5mL of sterile PBS containing 5% FBS28,29. The cell suspension was centrifuged, treated with red blood cell lysis buffer, washed, and then plated onto sterile petri dishes in DMEM containing 10% L929 media, 10% FBS and 1% penicillin/ streptomycin/glutamine (PSQ). Media was replenished every 2 to 3 days and differentiated cells were used at day 6 post-harvest. To delete Slc2a1, macrophage cultures were treated with TAT-Cre (EMD Millipore) according to manufacturer’s instructions. For staining, BMDMs were stained with F4/80 APC-eFluor 780 (eBioscience, Cat#: 47–4801-80) and subsequently stained with Myc PerCP antibody (Novus Biologicals, 9E10 Cat#: NB600–302PCP) or fixed and permeabilized using FoxP3/Transcription Factor Staining Buffer Set (eBioscience), and intracellular staining was performed using CD206 PE (BioLegend, Cat#: 141706). Resident peritoneal macrophages were obtained by flushing the peritoneal cavity of mice with 10mL of cold PBS containing 5% FBS. Collected cells were spun down, resuspended in X-VIVO 10 (Lonza), and plated at a concentration of 5×10⁵ cells per well. Floating cells were removed the next day, and remaining peritoneal macrophages were used 2 days after isolation.
Glucose uptake assay
LR73 cells were incubated with apoptotic Jurkat cells for 2h, washed 3 times with PBS and incubated with 10 mM 2-deoxygloucs (2-DG), a glucose analog, in glucose free media for 30 min. Following incubation, cells were washed 3 times with PBS and lysed with Extraction Buffer (Sigma Cat#: MAK083). Lysate was frozen/thawed in dry ice/ethanol, and then heated at 85°C for 40 min. Lysate was then cooled on ice for 5 min and then neutralized by Neutralization Buffer (Sigma Cat#: MAK083). Samples were spun down at 13,000x g to remove insoluble fraction and then diluted 10-fold by adding Assay Buffer. Using the lysate, glucose uptake was measured using Glucose Uptake Colorimetric Assay Kit (Sigma). 2-DG is taken up by cells and phosphorylated by hexokinase to 2-DG6P. 2-DG6P cannot be further metabolized and accumulates in cells, directly proportional to the glucose uptake by cells. 2-DG uptake is determined by a coupled enzymatic assay in which the 2-DG6P is oxidized, resulting in the generation of NADPH, which is then determined by a recycling amplification reaction in which the NADPH is utilized by glutathione reductase in a coupled enzymatic reaction that produces glutathione. Glutathione reacts with DTNB to produce TNB, which was detected at 412 nm as per the manufacturer’s recommendations.
Seahorse analysis
LR73 cells or bone marrow-derived macrophages (BMDMs) were seeded into a Seahorse 24-well tissue culture plate (Agilent Technologies, Santa Clara, CA). The cells adhered overnight prior to treatment. For assessing respiratory capacity, cells were subjected to a mitochondrial stress test (MST). Briefly, at the beginning of the assay, the media was changed to DMEM with pyruvate (Thermo-Fisher Cat#:12800017, pH=7.35 at 37°C) and cells were allowed to equilibrate for 30 minutes. Oxygen consumption rate (OCR) was measured using a Seahorse XF24 Flux Analyzer (Agilent Technologies, Santa Clara, CA). After three basal OCR measurements, the drugs of interest were injected into the plate and OCR was measured using four-minute measurement periods. Compounds to modulate cellular respiratory function [1μM oligomycin (Sigma-Aldrich); 2μM BAM15 (Cayman Chemical Company); 1μM antimycin A & 100nM Rotenone (Sigma-Aldrich)] were injected after every three measurements. Basal respiration was calculated by subtracting the average of the first three measurements by the average of the post-Antimycin A & rotenone measurements. Maximum respiratory capacity was calculated by subtracting the average of the post-BAM15 measurements by the average of the post- antimycin A & rotenone measurements. The reserve capacity was calculated by subtracting the average of the basal measurements from the average of the post-BAM15 measurements.
For assessing glycolytic capacity, the cells were subjected to a glycolytic stress test (GST). Briefly, extracellular acidification rate (ECAR), a measurement of lactate export, was measured using a Seahorse XF24 Flux Analyzer. Cells were seeded into a Seahorse 24-well tissue culture plate. At the beginning of the assay, the media was changed to unbuffered, glucose-free, DMEM (Sigma-Aldrich Cat# D5030, pH=7.35 at 37°C), supplemented with 143mM NaCl and 2mM Glutamine. After three basal ECAR measurements, the drugs of interest were injected into the plate and ECAR was measured using 3-min measurement periods. Compounds to modulate glycolysis (20mM Glucose; 1μM oligomycin; 80mM 2-deoxyglucose) (Sigma) were injected after every three measurements. Basal glycolysis was calculated by subtracting the average of the post- 2-DG measurements from the average of the post-glucose measurements. Maximum glycolytic capacity was calculated by subtracting the average of the post- 2-DG measurements from the average of the post-oligomycin measurements. The glycolytic reserve capacity was calculated by subtracting the average of the post-oligomycin measurements from the average of the post-glucose measurements.
Liposome construction
Liposomes were prepared by dissolving the lipids (phosphatidylserine, dioleoyl phosphatidylcholine, cholesterol, and the lipid DiD dye) in chloroform, evaporating chloroform under flow of argon gas in a glass vial and subjecting the lipid layer to overnight lyophilization to remove traces of organic solvent. Normal saline was then added for hydration, and after vortexing was done to prepare multilamellar vesicles (MLV). Particle size was verified by dynamic light scattering using Nicomp 370.
Determination of lactate concentration
The lactate concentration was measured using a Lactate Assay Kit (Sigma) according to the manufacturer’s instructions. The mean values +/− SD of the lactate concentration in the media and cells were calculated for each condition.
Immunoblotting
LR73 cells were seeded in a 100 mm dish at a concentration of 2 million cells/dish. Apoptotic Jurkat cells were added as indicated. Cells were lysed in RIPA buffer and immunoblotted for SLC2A1 (Abcam #ab652), SLC16A1 (LSBio LS-C335287), SLC12A2 (Cell Signaling Technology #14581) and total Erk2 (Santa Cruz Biotechnology, #sc-154-G) antibodies in Can Get Signal solution (TOYOBO Cat# NKB-101) followed by chemiluminescence detection.
Research Animals
Animal breeding and experiments were performed in a specific pathogen-free animal facility using protocols approved by the University of Virginia Animal Studies Committee. Ethical guidelines determined by the Institutional Animal Care and Use Committee were followed in all experiments performed in this manuscript.
Statistical analysis
Statistical significance was determined using GraphPad Prism 7, using unpaired Student’s two-tailed t-test, one-way ANOVA or two-way ANOVA, according to test requirements. Grubbs’ Outlier Test was used to determine outliers, which were excluded from final analysis. A p value of <.05 (indicated by one asterisk), <.01 (indicated by two asterisks), or <.001 (indicated by three asterisks) were considered significant. Replicates, repeats of individual experiments, statistical tests used are shown in Supplemental Table 4
Extended Data
Extended Data Figure 1. RNA preparation for the RNA-seq.

(a) Representative FACS plots of engulfment assays with LR73 hamster phagocytes (left) and Annexin V/7-AAD staining of apoptotic human Jurkat cells (right) in conditions matching experiments performed for RNAseq (2h with apoptotic cells followed by 2h rest in the absence of apoptotic cells).
(b) Principal component analysis was performed on hamster genome-aligned RNAseq data as a quality control statistic (right).
Extended Data Figure 2. SLC modified during efferocytosis.
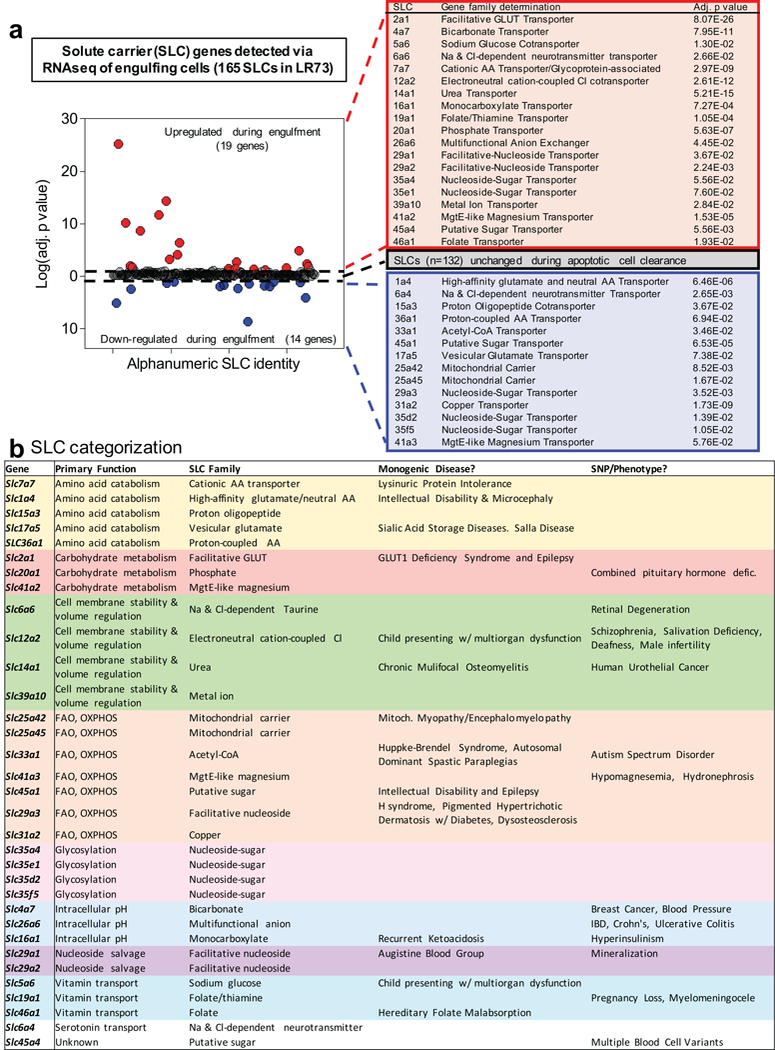
(a) Solute carrier (SLC) genes are differentially regulated during efferocytosis. (left) Plotting of the 165 SLC genes detected by RNAseq of efferoytic LR73 cells highlighting the 19 significantly upregulated (red) and 14 downregulated (blue) SLC genes that were altered during efferocytosis. The 132 SLC genes that were not altered are located on the midline (black). The current genetic classifications of these 33 SLC genes altered during engulfment are shown (right).
(b) Efferocytosis associated SLCs and their properties. Current genetic classification/functional linkages of the 33 SLCs modulated during apoptotic cell engulfment. Shown are the significantly upregulated and downregulated SLCs and the substrates they are known to transport grouped by predicted general function, as well as the known monogenic diseases and SNP/disease phenotype to which the specific SLCs have been linked.
Extended Data Figure 3. qPCR confirmation of the RNAseq data.
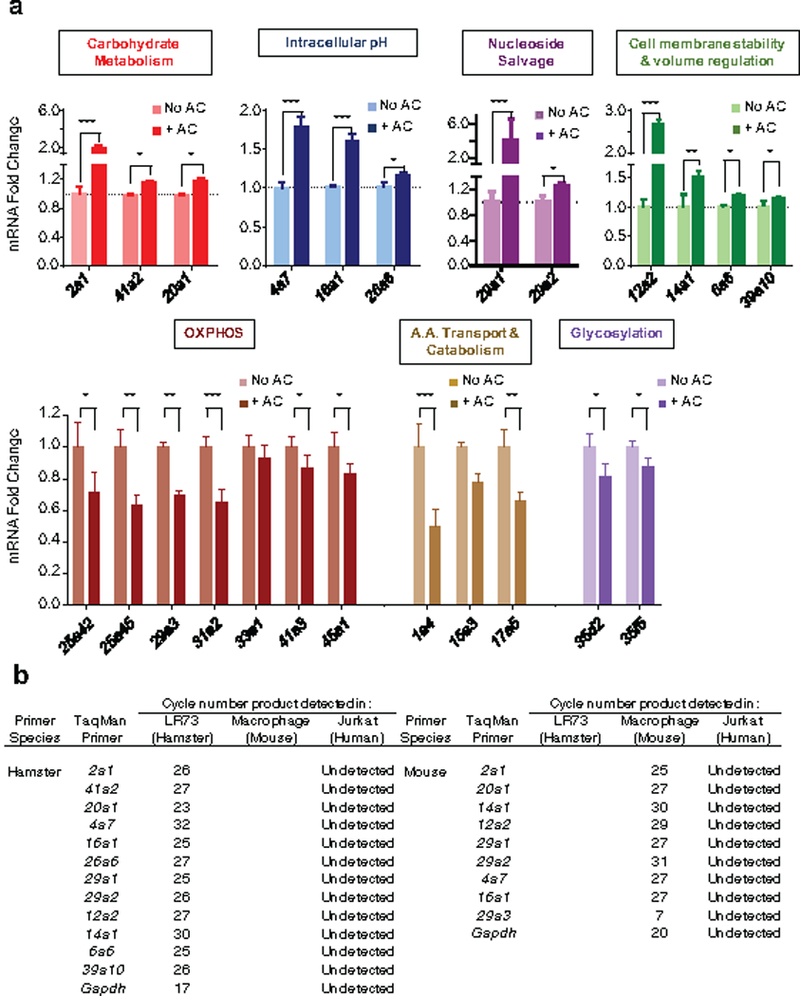
(a) qPCR determination of the modulation of specific SLCs during efferocytosis. Indicated SLC genes were tested for mRNA expression levels during engulfment assays performed similar to Fig. 1a. AC = apoptotic cell. *p < .05, **p < .01, ***p < .001. Data are representative of at least two independent experiments with 3–4 replicates per condition.
(b) Table presents the cycle numbers for each species-specific qPCR primer. None of these primers gave signals when tested against human Jurkat cell mRNA (target) alone.
Extended Data Figure 4. Dynamic expression of SLCs during efferocytosis.
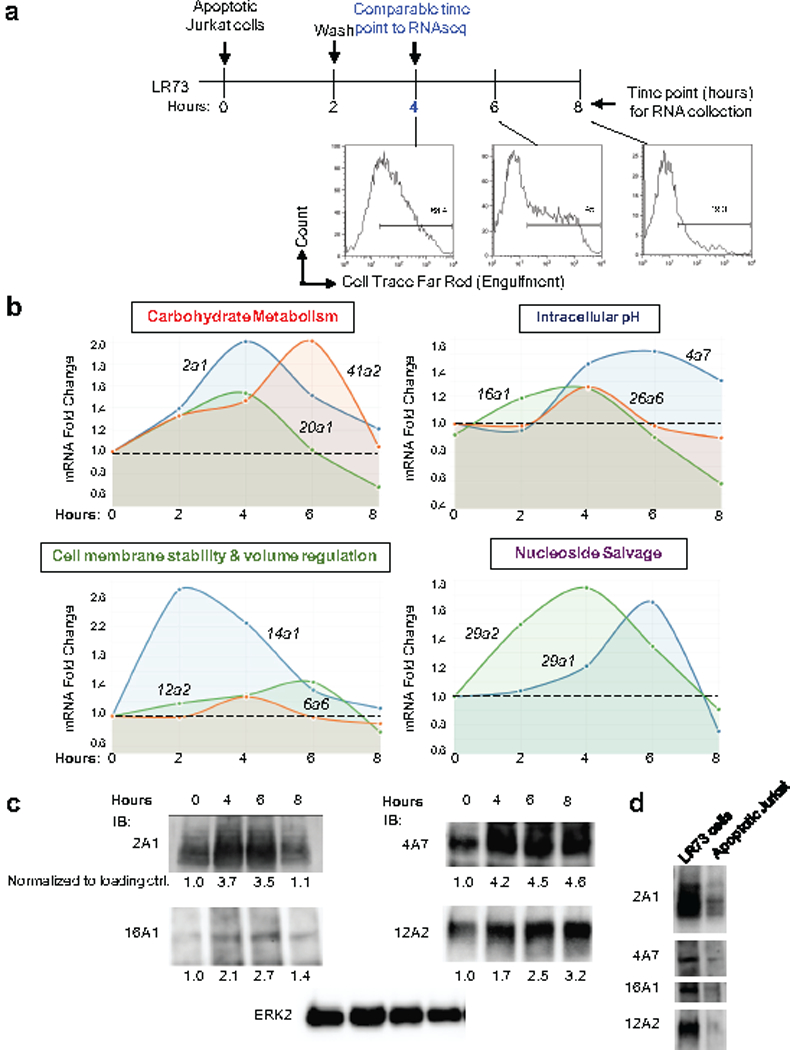
(a) Schematic of the experiment and time points when RNA from phagocytes was assessed for specific Slc gene expression. Apoptotic Jurkat cells were added to LR73 cells and co-cultured for 2 h. Unbound/floating apoptotic cells were then washed, and LR73 cells were cultured in fresh media for the indicated amounts of time. Time scale bar reflects total time of experiment, such that the 4 h time point reflects 2 h with apoptotic cells plus 2hr subsequent incubation (to match the time frame used in our RNAseq experiment). Total RNA was subsequently isolated and qPCR for specific Slc genes was performed. Flow cytometry plots indicate that fluorescent signal from the internalized corpses are significantly degraded by the 8 h time point.
(b) Expression of Slc genes are regulated over the time course of efferocytosis. Relative expression of mRNAs for specific slc genes belonging to different functional classes over the time course of engulfment is shown. Data are representative of three biological replicates.
(c) Immunoblotting for the some of the SLCs modified during efferocytosis. Indicated SLCs were probed at various time points after addition of apoptotic cells. Quantification normalized to ERK2 is shown below representative blots. Quantification was done with Photoshop CS6 software, and then normalized to control ERK2.
(d) Immunoblotting for the some of the SLCs in LR73 phagocytes and apoptotic Jurkat cells.
Extended Data Figure 5. The role of SLC2A1 for efferocytosis.
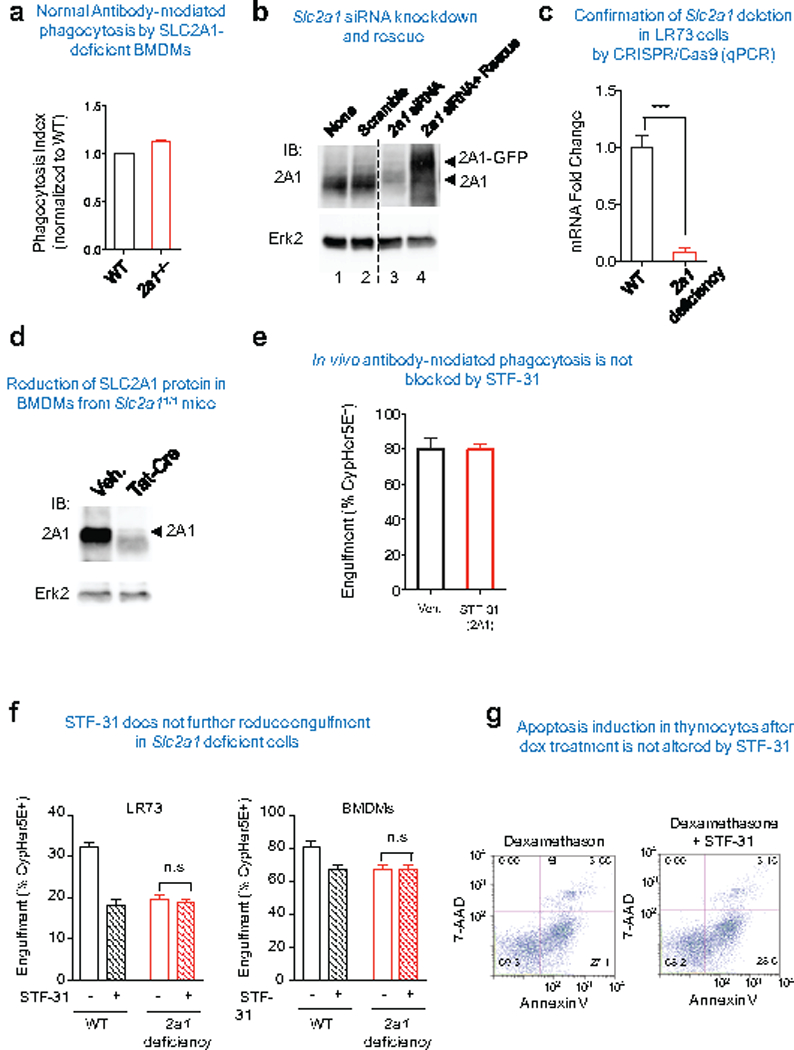
(a) Slc2a1fl/fl BMDM were treated with or without Tat-Cre to delete Slc2a1. The cells were then incubated with IgG-coated Jurkat cells and engulfment was assessed by CypHer5E signal within the BMDM. The uptake by the control BMDM (not treated with Tat-Cre, and denoted WT) were set to 1.
(b) siRNAs targeting of Slc2a1 down-modulates SLC2A1 protein expression. Shown are representative western blots of siRNA knockdown of Slc2a1 in LR73 cells versus scrambled siRNA. Also shown are LR73 cells expressing siRNA-resistant SLC2A1.
(c) Slc2a1 deletion efficiency in Cas9-LR73 cells. Slc2a1 guide was introduced into Cas9-EGFP+ LR73 cell clones. The efficiency of Slc2a1 deletion was quantified using qPCR.
(d) Introduction of TAT-Cre into Slc2a1flfl bone marrow-derived macrophages efficiently knocks down SLC2A1 protein expression. Slc2a1fl/fl bone marrow cells were treated with recombinant TAT-Cre during macrophage differentiation after isolation from the bone marrow.
(e) STF-31 did not affect antibody-mediated phagocytosis by peritoneal macrophages. C57BL/6 mice were intraperitoneally injected with 10mg/kg of either STF-31 in X-VIVO media 1h prior to IgG-coated Jurkat cell injection. CypHer5E labeled Jurkat cells were injected intraperitoneally along with the drug. Mice were euthanized 1h later, peritoneal cells collected, and apoptotic cell engulfment by CD11b+ F4/80hi macrophages was analyzed by FACS.
(f) Slc2a1-deficient LR73 cells or BMDMs were treated with STF-31, and the engulfment assay was conducted using CypHer5E-labeled apoptotic Jurkat cells. The CypHer5E+ phagocytic cells after 2h of incubation was determined by flow cytometry. n.s., not significant. Data are representative of at least two independent experiments with 3–4 replicates per condition.
(g) The SLC2A1 inhibitor STF-31 does not increase 7AAD+ thymocytes in vitro. Isolated thymocytes were incubated with dexamethasone (10μM) with or without STF-31 (2mM). 4h later, the thymocytes cell death were addressed by Annexin+ 7-AAD+. Data are representative of two independent experiments.
Extended Data Figure 6. The role of glycolytic genes for efferocytosis.
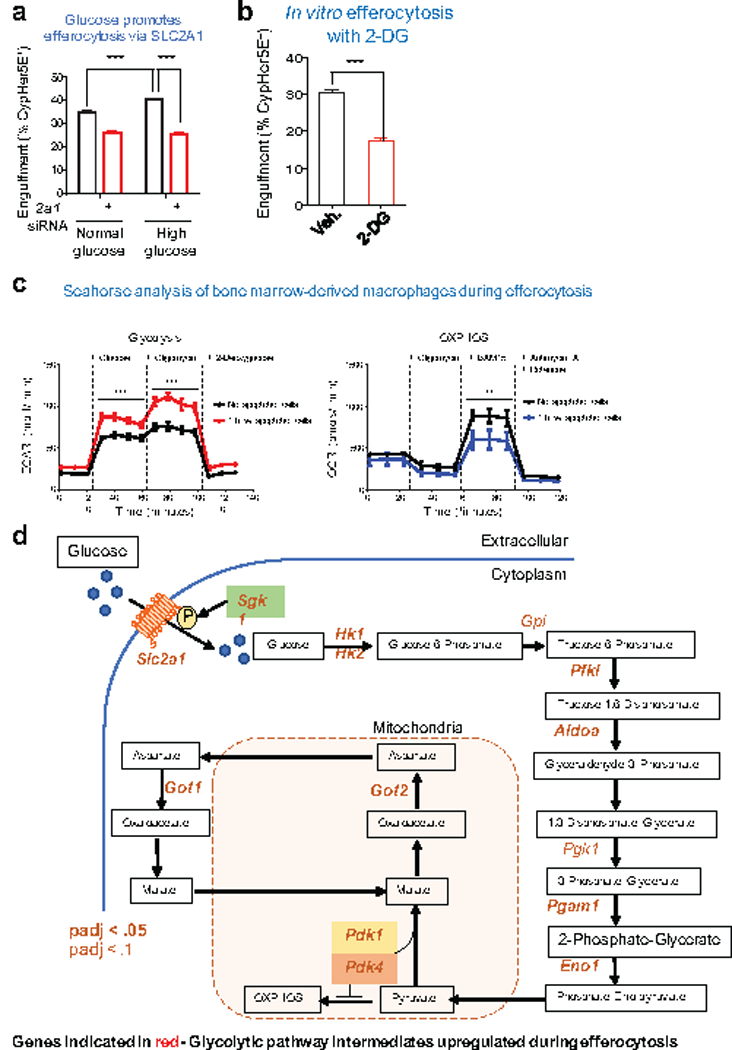
(a) The effect of physiological (1 mg/ml) or high (5mg/ml) glucose on apoptotic cell engulfment (2 h) in control and Slc2a1 siRNA-treated LR73 cells. Note that the enhanced engulfment due to higher glucose levels is lost in siRNA treated conditions. ***p < .001. Data are representative of at least three independent experiments with 3–4 replicates per condition.
(b) Apoptotic cell engulfment by LR73 cells in the presence of the glucose analog 2-DG (10mM). ***p < .001. Data are representative of two independent experiments with 2–3 replicates per condition.
(c) Bone marrow-derived macrophages undergo glycolytic flux during apoptotic cell clearance. Glycolytic flux and oxidative phosphorylation were measured during engulfment assays using Seahorse XF to assess extracellular acidification (ECAR, left panel) and oxygen consumption rates (OCR, right), respectively. Data are shown as mean +/− SD for ECAR (mpH/min) and OCR (pmol/min) over the course of standard glycolytic flux tests and cellular respiration tests. Data are representative of four replicates per condition. **p < .01, ***p < .001.
(d) Genes within the glycolytic pathway that are significantly upregulated during apoptotic cell clearance. Shown is schematic of the glycolytic pathway and subsequent steps, with the enzymes that are significantly upregulated (determined via RNAseq) indicated in red.
Extended Data Figure 7. Testing SGK1 and glycolysis in efferocytosis.
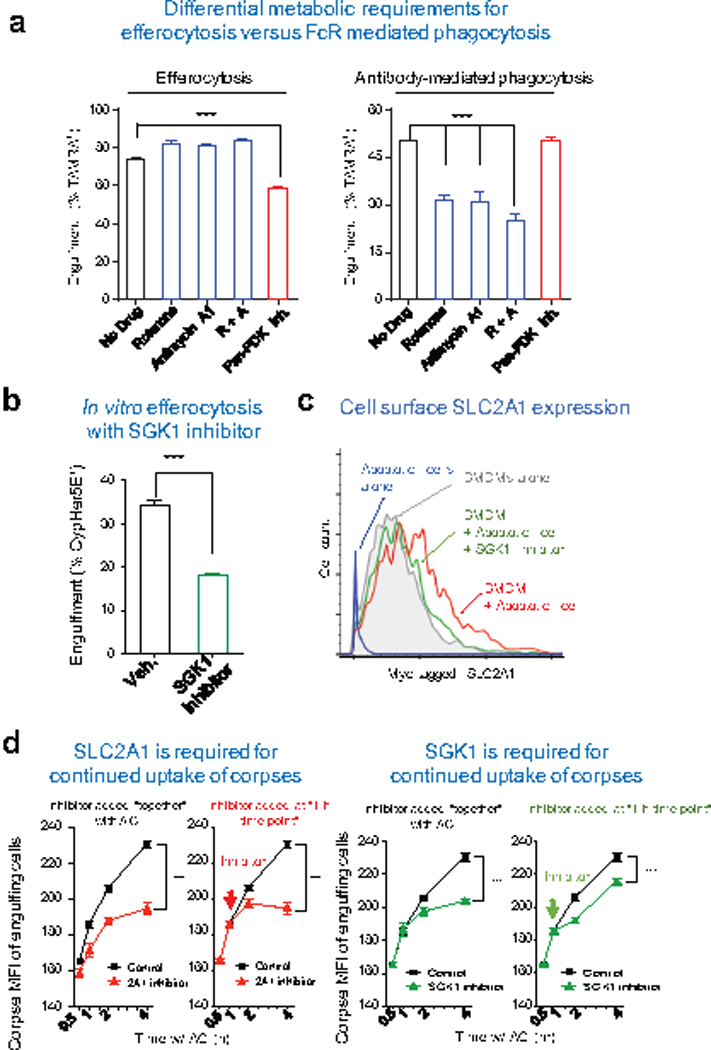
(a) Differential metabolic requirements by macrophages for efferocytosis versus antibody-mediated phagocytosis. Bone marrow-derived macrophages were co-cultured with apoptotic or antibody coated Jurkat cells. Mitochondrial respiration was inhibited by addition of the mitochondrial complex I inhibitor Rotenone (200nM), the mitochondrial complex III inhibitor Antimycin A1 (1μM), or both (R+A). Aerobic glycolysis was inhibited by the addition of the Pan-PDK inhibitor dichloroacetate (1mM). ***p < .001. Data are representative of three independent experiments.
(b) SGK1 inhibition blocks efferocytosis in vitro. LR73 cells were treated with SGK1 inhibitor and uptake of CypHer5E labeled apoptotic Jurkat cells assessed. ***p < .001.
(c) Bone marrow-derived macrophages (BMDM) from Glut1myc knock-in mice were co-cultured with apoptotic thymocytes with or without SGK1 inhibitor, GSK650394 (5μM), for 2 h, unbound apoptotic cells were washed, and the cell surface expression of SLC2A1 was measured by flow cytometry after staining for surface Myc-tag. Data are representative of at least two independent experiments.
(d) Continued uptake of apoptotic thymocytes was determined by the mean fluorescent intensity (MFI, indicating of corpse-derived signal per phagocyte) of LR73 phagocytes over a time course of engulfment. SLC2A1 or SGK1 inhibitors were added at the beginning of engulfment (left) or 1h post apoptotic cell addition (right). ***p < .001. Data are representative of at least three independent experiments with 3–4 replicates per condition.
Extended Data Figure 8. Tetsting SLC16A1 in efferocytosis.
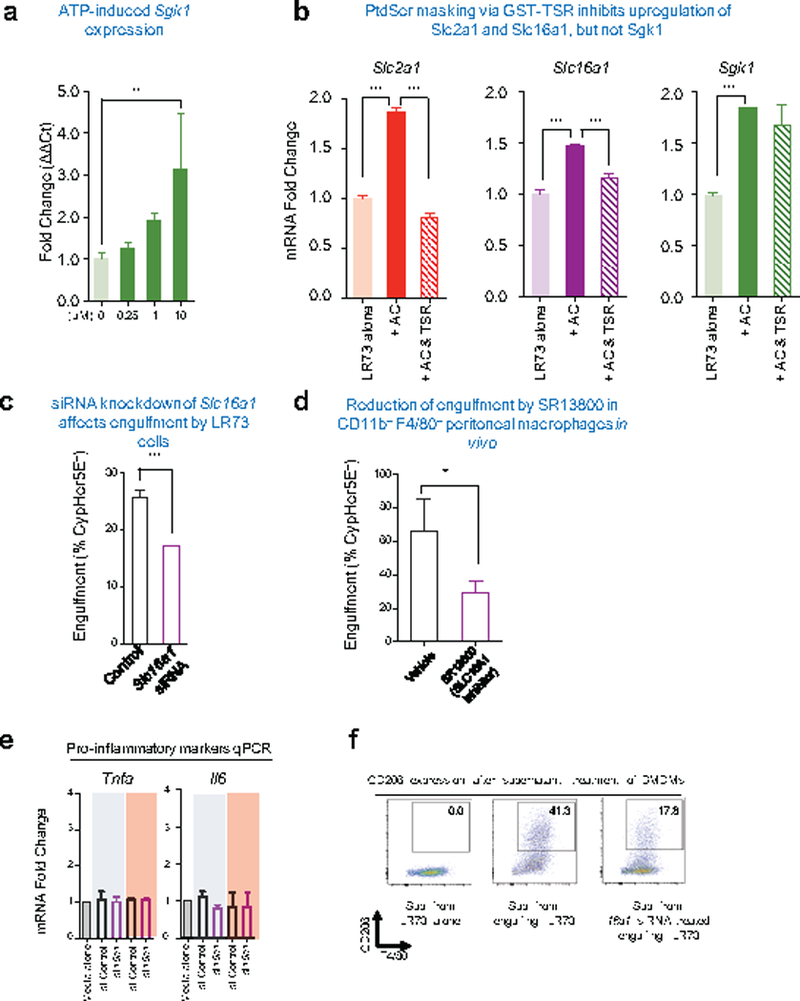
(a) qPCR determination of Sgk1 expression phagocytes treated with ATP. LR73 cells were treated with indicated amount of ATP for 4h. Expression of Sgk1 was determined by qPCR using hamster-specific primers. **p < .01. Data are representative of at least two independent experiments with 3–4 replicates per condition.
(b) qPCR determination of Slc2a1, Slc16a1, and Sgk1 expression in phagocytes after addition of the PtdSer masking peptide (GST-TSR) during efferocytosis. Apoptotic cells (AC) were added with or without TSR peptide (10ng/μl) for 4hr. Expressions of indicated genes were determined by qPCR using hamster-specific primers. ***p < .001. Data are representative of at least two independent experiments with 3–4 replicates per condition.
(c) SLC16A1 inhibition blocks efferocytosis in vitro. LR73 cells were treated with Slc16a1 siRNA and uptake of CypHer5E labeled apoptotic Jurkat cells assessed. ***p < .001.
(d) SLC16A1 inhibitor SR13800 dampens efferocytosis by peritoneal macrophages. C57BL/6 mice were intraperitoneally injected with SR13800 (10mg/kg) in X-VIVO media for 1h prior to apoptotic cell injection. CypHer5E-labeled apoptotic Jurkat cells were injected intraperitoneally along with the drug. After 1hr, apoptotic cell engulfment by CD11b+ F4/80hi peritoneal macrophages was analyzed by flow cytometry. *p < .05. Data are representative of two independent experiments with at least 6 mice in each group per experiment.
(e and f) Supernatants from control LR73 or Slc16a1 siRNA-treated LR73 cells engulfing apoptotic cells was prepared, and added to BMDMs, and incubated for 12 h. Expression of inflammatory markers are determined by qPCR. ***p < .001. After 24 h, with supernatant incubation, CD206 and F4/80 expressions were determined by flow cytometry in BMDMs. Data are representative of two independent experiments with 2–3 replicates per condition.
Supplementary Material
Acknowledgments
This work is supported by R35GM122542, P01HL120840, and UVa Center for Cell Clearance (KSR), American Heart Association 13BGIA17070106 and UTHSC funds (LM), Mishima Kaiun Memorial Foundation and Kanae Foundation (SM), CRI–Mark Foundation Fellowship, 5T32CA009109–39 (JSAP), Neuroscience Training Program (MHR), and Erik and Mabel Johansson Scholarship (LZ).
Footnotes
The authors declare no competing financial interests. Correspondence and request for materials should be addressed to: ravi@virginia.edu
Data Availability
RNA sequencing data presented in this study have been deposited in NCBI GEO repository under the accession #GSE119273.
Code Availability
All code used in this manuscript can be accessed from the Github repository perryjs/Perry-R.
References
- 1.Arandjelovic S & Ravichandran KS Phagocytosis of apoptotic cells in homeostasis. Nat Immunol 16, 907–917, doi: 10.1038/ni.3253 (2015). [DOI] [PMC free article] [PubMed] [Google Scholar]
- 2.Elliott MR & Ravichandran KS The Dynamics of Apoptotic Cell Clearance. Dev Cell 38, 147–160, doi: 10.1016/j.devcel.2016.06.029 (2016). [DOI] [PMC free article] [PubMed] [Google Scholar]
- 3.Colegio OR et al. Functional polarization of tumour-associated macrophages by tumour-derived lactic acid. Nature 513, 559–563, doi: 10.1038/nature13490 (2014). [DOI] [PMC free article] [PubMed] [Google Scholar]
- 4.A-Gonzalez N et al. Phagocytosis imprints heterogeneity in tissue-resident macrophages. J Exp Med 214, 1281–1296, doi: 10.1084/jem.20161375 (2017). [DOI] [PMC free article] [PubMed] [Google Scholar]
- 5.Cummings RJ et al. Different tissue phagocytes sample apoptotic cells to direct distinct homeostasis programs. Nature 539, 565–569, doi: 10.1038/nature20138 (2016). [DOI] [PMC free article] [PubMed] [Google Scholar]
- 6.Cesar-Razquin A et al. A Call for Systematic Research on Solute Carriers. Cell 162, 478–487, doi: 10.1016/j.cell.2015.07.022 (2015). [DOI] [PubMed] [Google Scholar]
- 7.Lin L, Yee SW, Kim RB & Giacomini KM SLC transporters as therapeutic targets: emerging opportunities. Nat Rev Drug Discov 14, 543–560, doi: 10.1038/nrd4626 (2015). [DOI] [PMC free article] [PubMed] [Google Scholar]
- 8.Mueckler M & Thorens B The SLC2 (GLUT) family of membrane transporters. Mol Aspects Med 34, 121–138, doi: 10.1016/j.mam.2012.07.001 (2013). [DOI] [PMC free article] [PubMed] [Google Scholar]
- 9.Verdone JE, Zarif JC & Pienta KJ Aerobic glycolysis, motility, and cytoskeletal remodeling. Cell Cycle 14, 169–170, doi: 10.1080/15384101.2014.995493 (2015). [DOI] [PMC free article] [PubMed] [Google Scholar]
- 10.Chan DA et al. Targeting GLUT1 and the Warburg effect in renal cell carcinoma by chemical synthetic lethality. Sci Transl Med 3, 94ra70, doi: 10.1126/scitranslmed.3002394 (2011). [DOI] [PMC free article] [PubMed] [Google Scholar]
- 11.Park D et al. Continued clearance of apoptotic cells critically depends on the phagocyte Ucp2 protein. Nature 477, 220–224, doi: 10.1038/nature10340 (2011). [DOI] [PMC free article] [PubMed] [Google Scholar]
- 12.Jensen PJ, Gitlin JD & Carayannopoulos MO GLUT1 deficiency links nutrient availability and apoptosis during embryonic development. J Biol Chem 281, 13382–13387, doi: 10.1074/jbc.M601881200 (2006). [DOI] [PubMed] [Google Scholar]
- 13.Kojima Y, Weissman IL & Leeper NJ The Role of Efferocytosis in Atherosclerosis. Circulation 135, 476–489, doi: 10.1161/CIRCULATIONAHA.116.025684 (2017). [DOI] [PMC free article] [PubMed] [Google Scholar]
- 14.Macintyre AN et al. The glucose transporter Glut1 is selectively essential for CD4 T cell activation and effector function. Cell Metab 20, 61–72, doi: 10.1016/j.cmet.2014.05.004 (2014). [DOI] [PMC free article] [PubMed] [Google Scholar]
- 15.Zhang S, Hulver MW, McMillan RP, Cline MA & Gilbert ER The pivotal role of pyruvate dehydrogenase kinases in metabolic flexibility. Nutr Metab (Lond) 11, 10, doi: 10.1186/1743-7075-11-10 (2014). [DOI] [PMC free article] [PubMed] [Google Scholar]
- 16.Palmada M et al. SGK1 kinase upregulates GLUT1 activity and plasma membrane expression. Diabetes 55, 421–427 (2006). [DOI] [PubMed] [Google Scholar]
- 17.Elliott MR et al. Nucleotides released by apoptotic cells act as a find-me signal to promote phagocytic clearance. Nature 461, 282–286, doi: 10.1038/nature08296 (2009). [DOI] [PMC free article] [PubMed] [Google Scholar]
- 18.Sprowl-Tanio S et al. Lactate/pyruvate transporter MCT-1 is a direct Wnt target that confers sensitivity to 3-bromopyruvate in colon cancer. Cancer Metab 4, 20, doi: 10.1186/s40170-016-0159-3 (2016). [DOI] [PMC free article] [PubMed] [Google Scholar]
- 19.Biswas SK & Mantovani A Macrophage plasticity and interaction with lymphocyte subsets: cancer as a paradigm. Nat Immunol 11, 889–896, doi: 10.1038/ni.1937 (2010). [DOI] [PubMed] [Google Scholar]
- 20.Kelly B & O’Neill LA Metabolic reprogramming in macrophages and dendritic cells in innate immunity. Cell Res 25, 771–784, doi: 10.1038/cr.2015.68 (2015). [DOI] [PMC free article] [PubMed] [Google Scholar]
- 21.Gaber T, Strehl C & Buttgereit F Metabolic regulation of inflammation. Nat Rev Rheumatol 13, 267–279, doi: 10.1038/nrrheum.2017.37 (2017). [DOI] [PubMed] [Google Scholar]
- 22.Han CZ et al. Macrophages redirect phagocytosis by non-professional phagocytes and influence inflammation. Nature 539, 570–574, doi: 10.1038/nature20141 (2016). [DOI] [PMC free article] [PubMed] [Google Scholar]
References
- 23.Han CZ et al. Macrophages redirect phagocytosis by non-professional phagocytes and influence inflammation. Nature 539, 570–574, doi: 10.1038/nature20141 (2016). [DOI] [PMC free article] [PubMed] [Google Scholar]
- 24.Fond AM, Lee CS, Schulman IG, Kiss RS & Ravichandran KS Apoptotic cells trigger a membrane-initiated pathway to increase ABCA1. J Clin Invest 125, 2748–2758, doi: 10.1172/JCI80300 (2015). [DOI] [PMC free article] [PubMed] [Google Scholar]
- 25.Ahn YY, Bagrow JP & Lehmann S Link communities reveal multiscale complexity in networks. Nature 466, 761–764, doi: 10.1038/nature09182 (2010). [DOI] [PubMed] [Google Scholar]
- 26.Chen S et al. Genome-wide CRISPR screen in a mouse model of tumor growth and metastasis. Cell 160, 1246–1260, doi: 10.1016/j.cell.2015.02.038 (2015). [DOI] [PMC free article] [PubMed] [Google Scholar]
- 27.Takanaga H, Chaudhuri B & Frommer WB GLUT1 and GLUT9 as major contributors to glucose influx in HepG2 cells identified by a high sensitivity intramolecular FRET glucose sensor. Biochim Biophys Acta 1778, 1091–1099, doi: 10.1016/j.bbamem.2007.11.015 (2008). [DOI] [PMC free article] [PubMed] [Google Scholar]
- 28.Macintyre AN et al. The glucose transporter Glut1 is selectively essential for CD4 T cell activation and effector function. Cell Metab 20, 61–72, doi: 10.1016/j.cmet.2014.05.004 (2014). [DOI] [PMC free article] [PubMed] [Google Scholar]
- 29.Michalek RD et al. Cutting edge: distinct glycolytic and lipid oxidative metabolic programs are essential for effector and regulatory CD4+ T cell subsets. J Immunol 186, 3299–3303, doi: 10.4049/jimmunol.1003613 (2011). [DOI] [PMC free article] [PubMed] [Google Scholar]
Associated Data
This section collects any data citations, data availability statements, or supplementary materials included in this article.


