Abstract
The purpose of this study was to determine the relationship between liver histology, exercise tolerance and diastolic function in patients with nonalcoholic fatty liver disease (NAFLD). Myocardial remodeling and diastolic dysfunction have been associated with NAFLD. However, its physiological impact and relationship to the histological severity of NAFLD is not known. Cardiopulmonary exercise testing and stress echocardiography was performed in subjects with biopsy-confirmed NAFLD. Maximal aerobic exercise capacity (peak oxygen consumption [VO2]) was related to diastolic function (mitral annulus Doppler velocity e’ and ratio of early diastolic filling pressure [E] to e’ [E/e’]) at rest and peak exercise. Autonomic dysfunction was determined from heart rate recovery after exercise. Independent predictors of cardiac function and exercise capacity were identified by multivariable regression. Thirty-six subjects (nonalcoholic fatty liver [NAFL=15], nonalcoholic steatohepatitis [NASH=21]) were enrolled. NASH was associated with impaired exercise capacity compared to NAFL (median peak VO2 17.0 [15.4, 18.9] vs. 19.9 [17.4, 26.0], P=001); pVO2 declined with increasing fibrosis (F0=22.5, F1=19.9, F2=19.0, F3=16.6 mlkg−1min−1; P=0.01). Similarly, E/e’ during exercise increased progressively with increasing fibrosis (F0=5.6, F1=6.5, F2=8.7, F3=9.8; P=0.02). Finally, heart rate recovery, a marker of autonomic function, was blunted in those with higher fibrosis stages (F0=25 [20, 30], F1=23 [17.5, 27.0], F2=17 [11.8, 21.5], F3=11 [8.5, 18.0] beats per minute; P<0.01). Fibrosis was an independent predictor of these functional outcomes. In conclusion, NASH is associated with impaired exercise capacity and diastolic dysfunction compared to NAFL. The severity of impairment is directly related to the severity of fibrosis stage in precirrhotic stages of NAFLD.
Keywords: nonalcoholic fatty liver disease, nonalcoholic steatohepatitis, exercise capacity, diastolic dysfunction, fibrosis, cardiopulmonary exercise testing
INTRODUCTION
Nonalcoholic fatty liver disease (NAFLD) is the most common cause of chronic liver disease affecting 1 in 3 Americans and has two principal histological sub-types, i.e. nonalcoholic fatty liver (NAFL) characterized by hepatic steatosis with little to no inflammation and activity, which contrasts with nonalcoholic steatohepatitis (NASH), characterized by hepatic steatosis accompanied by necroinflammatory activity and propensity for fibrosis progression and cirrhosis.1,2 NAFLD, especially NASH, is associated with increased cardiovascular mortality independent of metabolic risk factors.3,4 Recent studies have identified an association between diastolic dysfunction and NAFLD5–8 characterized by impaired ventricular relaxation, increased myocardial thickness and epicardial fat content.5,6,9 It is however unknown if these findings are present in all individuals with NAFLD, those with NASH alone, or NASH with a certain level of disease activity or fibrosis. Furthermore, it is not known if the observed changes in myocardial structure and function are clinically meaningful. Thus, we aimed to define the functional impact of diastolic function using cardiopulmonary exercise testing (CPET) and stress echocardiography in subjects with histologically confirmed NAFLD of varying severity.
METHODS
Patients undergoing a liver biopsy for suspected NAFLD as part of standard of care from 2016 to 2017 were prescreened for this study and subjects with histologically confirmed NAFLD were invited to participate in this study. Subjects with poorly controlled hypertension (systolic pressure >140mmHg and diastolic pressure >90mmHg) or diabetes (hemoglobin A1c≥ 8.5) were excluded to avoid potential confounding effects of increased afterload from hypertension or effects of uncontrolled hyperglycemia. Subjects with cirrhosis were excluded to avoid any potential confounding due to cirrhotic cardiomyopathy. Exclusionary cardiac disease was defined by a history of heart failure (HF), unstable angina, valvular heart disease and known history of cardiac arrhythmias. Those who were unable to exercise due to other co-morbidities or had contraindications for exercise testing were also excluded.10 Alcohol use was assessed using the AUDIT and those consuming more than 20gm/day for women and 30gm/day for men were excluded.11 All liver biopsies were scored for features of NAFLD (steatosis, cytological ballooning and lobular inflammation) using the NASH Clinical Research Network (NASH CRN) scoring system by an expert histopathologist, who was blinded to the cardiac testing and patient data.2 Hepatic fibrosis was quantified from stages 0–4 according to NASH CRN criteria.2 The Duke Activity Status Index (DASI) questionnaire, a self-assessment tool to estimate perceived functional capacity was used to quantify fatigue and exertional intolerance with activities of daily living (ADL).12
A physician supervised, symptom-limited CPET was administered to all subjects using a conservative incremental ramping treadmill protocol.13 Ventilatory gas-analysis was performed pre-, during, and post-exercise using a metabolic cart to measure ventilation (VE), oxygen consumption (VO2), and carbon dioxide production (VCO2). Peak VO2 (pVO2), the criterion measurement of cardiorespiratory fitness (CRF) and a prognostic indicator in diastolic dysfunction14–16, was calculated as the highest interval average value of O2 consumption during the final 30-seconds of exercise and reported relative to bodyweight (mL kg−1min−1). The ventilatory anaerobic threshold (VAT), a marker of submaximal CRF and an indicator of ADL tolerance, was calculated using the dual methods criteria. Ten second averaged VE and VCO2 data, from the initiation of exercise to peak, were used to calculate the minute ventilation/carbon dioxide production (VE/VCO2) slope, a marker of ventilatory efficiency that correlates with severity of diastolic dysfunction.18 Additionally, the VE/VCO2 slope was indexed to VO2 to normalize ventilatory efficiency relative to exercise capacity.19 The oxygen uptake efficiency slope (OUES), a submaximal indicator of aerobic capacity and marker of disease severity in the HF patient was determined from the linear relation of VO2 versus the logarithmic transformation of VE during exercise.20 The percent (%) of age-predicted maximal heart rate (%APMHR) achieved was determined using the equation: APMHR=220-age in years.21 Post-exercise HR recovery was defined as the difference in peak exercise HR minus the HR at 1 -minute into the recovery period (HRR-1’).22
To evaluate the impact of body composition on exercise capacity, all subjects had body mass index (BMI) calculated and body composition assessment via bioelectrical impedance analysis. Similarly, all patients underwent spirometry prior to exercise testing to rule out presence of co-morbid pulmonary disease and quantify respiratory status.14
All subjects underwent resting and exercise transthoracic Doppler echocardiography using standardized protocols to determine left-ventricular end-diastolic and left-ventricular end- systolic volumes, left ventricular ejection fraction (LVEF), early transmitral E wave velocity (E), and the early mitral annulus velocities (e’) by tissue Doppler averaged between the lateral and septal.23 The echocardiographers were blinded to histology and CPET results. The E/e’ ratio was calculated to estimate LV filling pressures.24
Continuous variables were reported with median and interquartile ranges for potential deviation from a Gaussian distribution. Discrete variables are reported as a number and %. The student T-test and Mann-Whitney test were used as appropriate for normal and skewed distribution, respectively. The non-parametric Jonckheere-Terpstra test for linear trend was used to define the association and direction of statistical significance between fibrosis stages (0–3). Pearson chi-square test was utilized to assess differences between fibrosis stage and nominal variables (cardiovascular disease (CVD) risk factors, medication usage). Spearman correlation coefficients were used to assess correlations between exercise test variables, Doppler echocardiography, and body composition variables. Statistical analysis was performed using SPSS version 24.0 software (IBM Corp., Armonk, New York). Statistical significance was set at an alpha of p<0.05.
RESULTS
Thirty-six consecutive subjects with histologically confirmed NAFLD were included and baseline characteristics are presented in Table 1. Twenty-three subjects had NASH, and the distribution of hepatic fibrosis for stages 0, 1, 2, and 3 was 19%, 39%, 11%, and 31%, respectively. No statistically significant differences with regards to medication usage, physical activity levels, obesity, hypertension, or dyslipidemia were noted across fibrosis stages. The presence of diabetes (DM), however, was greater in patients with increasing degrees of hepatic fibrosis (P=0.01), but the hemoglobin A1C was not significantly different across groups.
Table 1:
Clinical characteristics of the study cohort (n = 36).
| Variable | N (% or IQR) |
|---|---|
| Age (years) | 54 (48–60) |
| Female | 24 (67%) |
| White | 29 (81%) |
| Black | 4(11%) |
| Hispanic | 3 (9%) |
| Diabetes mellitus | 23 (64%) |
| Hyperlipidemia | 28 (78%) |
| Hypertension | 31 (86%) |
| Obesity | 29 (81%) |
| Steatosis grade | |
| 1 | 12 (33%) |
| 2 | 16(44%) |
| 3 | 8 (22%) |
| Lobular Inflammation grade | |
| 0 | 3 (8%) |
| 1 | 24 (67%) |
| 2 | 9 (25%) |
| 3 | 0 |
| Cytological Ballooning | |
| None | 15 (42%) |
| Few | 14 (39%) |
| Many | 7(19%) |
| Fibrosis stage | |
| 0 | 7(19%) |
| 1 | 14 (39%) |
| 2 | 4(11%) |
| 3 | 11 (31%) |
| 4 | 0 |
| Nonalcoholic Steatohepatitis | 23 (64%) |
Hypertension/Hyperlipidemia defined as medical record diagnosis of, hypertension/ hyperlipidemia and/or current use of anti-hypertensive/lipid-lowering pharmacologic therapies. Obesity defined as body mass, index ≥30.0 kg/m2.
The body composition, spirometry and hemoglobin values across fibrosis stages are listed in Table 2. The BMI and %fat mass were 34.0 kg/m2 (31.1–38.8) and 39.1% (33.8–45.9), respectively, and were not significantly different across the groups. No significant respiratory abnormalities were noted on spirometry, which were overall normal in the study cohort (Table 2). Furthermore, the VE/MVV ratio was 0.61 (0.5–0.72) for the entire cohort indicating sufficient breathing reserve (normal < 0.8) at peak exercise. There were no significant differences between any spirometry-related parameter across fibrosis stages.
Table 2:
Body Composition, Spirometry & Hemoglobin data by Fibrosis stage.
| Anthropometries | Overall | Stage 0 | Stage 1 | Stage 2 | Stage 3 | P-value |
|---|---|---|---|---|---|---|
| Body Mass Index (kg/m2) | 34.0 | 31.4 | 34.0 | 34.4 | 36.1 | 0.58 |
| (31.1–38.8) | (27.6–39.2) | (31.1–45.1) | (28.8–43.0) | (31.1–38.0) | ||
| Body Weight (kg) | 91.9 | 77.3 | 94.4 | 90.7 | 98.2 | 0.33 |
| (80.6–116.9) | (70.3–121.4) | (81.9–123.1) | (82.7–120.2) | (84.9–113.7) | ||
| Fat Mass (%) | 39.1 | 38.6 | 44.0 | 44.5 | 35.7 | 0.92 |
| (33.8–45.9) | (31.6–44.1) | (29.7–47.4) | 31.5–47.3) | (35.3–43.4) | ||
| Fat Free Mass (%) | 60.9 | 61.4 | 56.0 | 55.6 | 64.4 | 0.89 |
| (54.1–68.0) | (55.9–68.4) | (52.7–70.3) | (52.7–68.5) | (56.7–67.6) | ||
| Spirometry Parameters | ||||||
| Forced Vital Capacity (Liters) |
3.14 | 3.48 | 3.05 | 3.14 | 3.31 | 0.57 |
| (2.82–3.87) | (3.10–3.85) | (2.58–3.47) | (3.10–3.14) | (2.35–4.22) | ||
| Forced Vital Capacity (%) |
91 | 97 | 90 | 91 | 91 | 0.14 |
| (85–98) | (92–101) | (80–98) | (86–91) | (83–92) | ||
| Forced Expiratory Volume-1second (Liters) |
2.59 | 2.77 | 2.48 | 2.57 | 2.65 | 0.61 |
| (2.25–3.07) | (2.53–3.16) | (2.21–2.82) | (2.49–2.57) | (1.83–3.19) | ||
| Forced Expiratory Volume-lsecond (%) |
94 | 99 | 90 | 95 | 93 | 0.25 |
| (86–100) | (94–105) | (82–106) | (86–95) | (84–96) | ||
| FEV1/FVC ratio | 0.80 | 0.82 | 0.81 | 0.79 | 0.79 | 0.44 |
| (0.78–0.83) | (0.79–0.82) | (0.76–0.85) | (0.72–0.79) | (0.77–0.82) | ||
| Maximal Voluntary Ventilation (Liters/min) |
97.8 | 94.1 | 99.9 | 104.1 | 104.6 | 0.38 |
| (80.1–123.1) | (76.8–111.2) | (82.4–121.2) | (90.5–141.8) | (74.8–127.8) | ||
| Maximal Voluntary Ventilation (%) |
93 | 89 | 99 | 108 | 105 | 0.37 |
| (84–111) | (82–90) | (89–113) | (88–121) | (75–128) | ||
| Breathing Reserve (%) | 39 | 34 | 39 | 42 | 46 | 0.07 |
| (28–49) | (12–41) | (17–45) | (32–56) | (32–59) | ||
| Oxygen Carrying Capacity of Blood | ||||||
| Hemoglobin (g/dL) | 13.9 | 13.6 | 14.3 | 13.0 | 0.57 | |
| (13.3–16.7) | (12.7–15.6) | (13.6–14.3) | (12.4–13.7) | |||
Abbreviations: kg/m2=kilograms per meter squared; %=percent; FVC=forced vital capacity; FEVl=forced expiratory volume in 1-second; g/dL=grams per deciliter.
The pVO2 was moderately reduced at 18.3 mL kg−1min−1 (16.0–22.2), or 66% of predicted, in the entire cohort. Furthermore, pVO2 was significantly lower in those with NASH when compared to those with NAFL (17.0 [15.4–18.9] vs. 19.9 [17.4–26.0] mL kg−1min−1, P=0.01) (Figure 1A). Similarly, subjects with NASH had lower exercise time (9.3 [7.9–11.7] vs. 12.0 [10.0–13.2] minutes, P=0.02) and VO2 at the VAT (13.2 [10.8–14.7] vs. 15.2 [14.2–17.1] mLkg−1min−1; P=0.02) compared to those with NAFL.
Figure 1A:
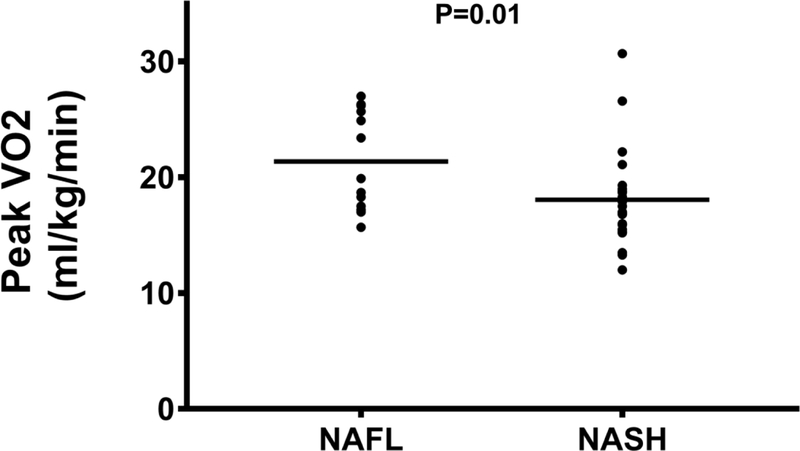
Peak VO2 is higher in patients with NAFL compared to NASH.
Abbreviations: NAFL=nonalcoholic fatty liver disease; NASH=nonalcoholic steatohepatitis; ml/kg/min=milliliters per kilogram per minute; VO2=oxygen consumption.
There was a stepwise decrease in pVO2 (Figure 1B) with increasing fibrosis stage, with a pVO2 of 21.1 (18.3–26.2), 17.2 (16.3–21.4), 18.0 (14.4–24.5), and 16.7 (14.7–18.7) mLkg−1min−1 for fibrosis stages 0–3, respectively (P=0.01). Similarly, the VAT (Figure 1C) also decreased with progressive fibrosis; stage 0 was 16.3 (12.6–18.4); fibrosis stage 1 was 14.6 (12.4–15.6); fibrosis stage 2 was 14.4 (11.1–17.1), and fibrosis stage 3 was 13.1 (10.3–13.9) mLkg−1min−1, respectively (P=0.02). Exercise time also demonstrated a significant inverse linear trend (Figure 1D) relative to histological fibrosis (fibrosis stage 0=12.1 (10.5–13.2), fibrosis stage 1=10.5 (9.7–12.4), fibrosis stage 2=8.9 (7.7–12.2), fibrosis stage 3=9.1 (6.9–10.9) minutes; P<0.01), respectively. Cytological ballooning also correlated with pVO2 (R=−0.41, P=0.02), VAT (R=- 0.42, P=0.02), and exercise time (R=−0.46, P<0.01) (Table 3).
Figure 1B:
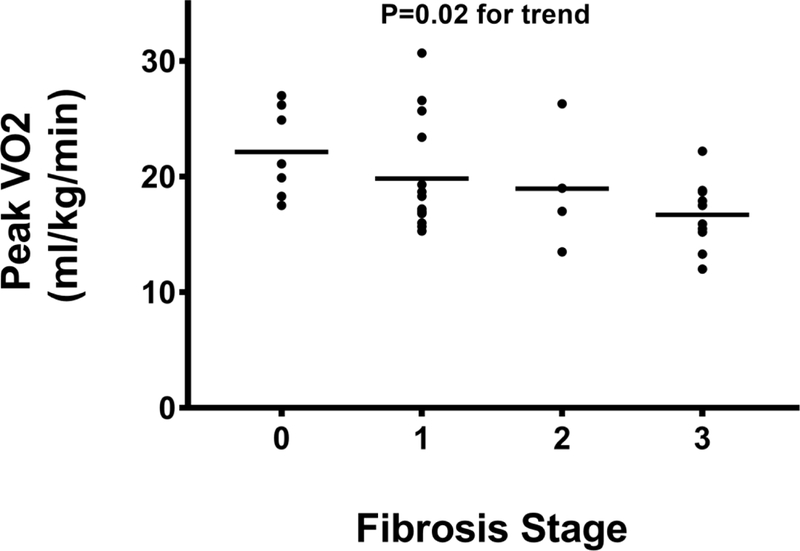
Peak VO2 decreases as fibrosis stage increases.
Abbreviations: ml/kg/min=milliliters per kilogram per minute; VO2=oxygen consumption.
Figure 1C:
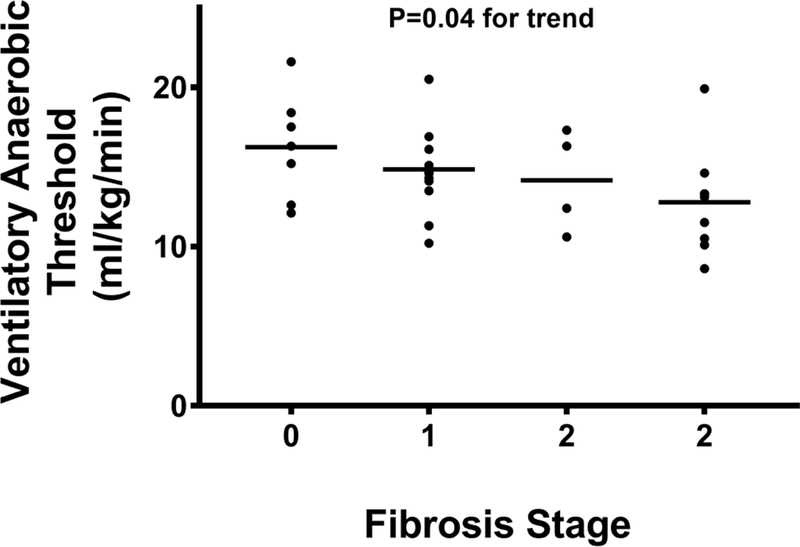
Hepatic fibrosis stage is inversely linked to ventilatory anaerobic threshold.
Abbreviations: ml/kg/min=milliliters per kilogram per minute.
Figure 1D:
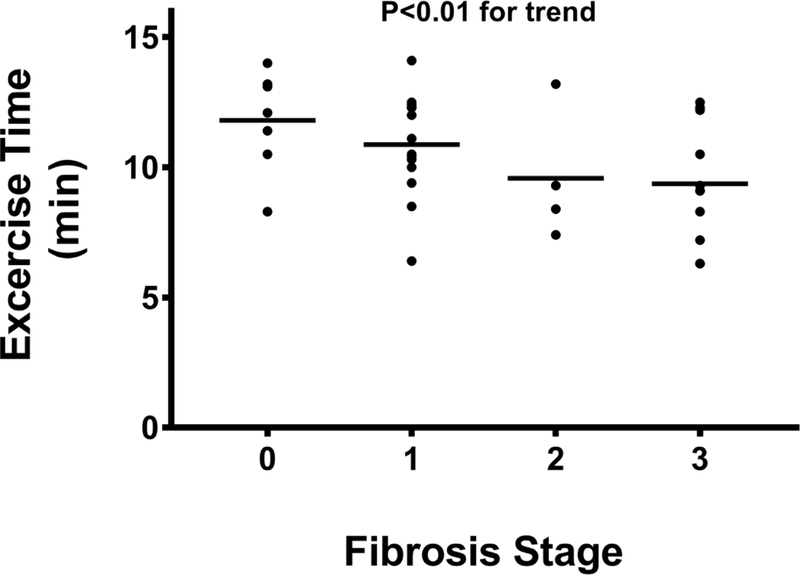
Exercise time declines with increasing fibrosis stage.
Abbreviations: min=minutes.
Table 3:
Correlation between liver histology and key exercise test variables.
| Histological Parameters | Peak VO2 | Ventilatory Anaerobic Threshold | Exercise Time | Heart Rate Recovery at 1 min | Stress E/e’ | |||||
|---|---|---|---|---|---|---|---|---|---|---|
| R | P-value | R | P-value | R | P-value | R | P-value | R | P-value | |
| Steatosis | −0.13 | 0.48 | −0.44 | 0.81 | −0.16 | 0.37 | −0.81 | 0.65 | 0.33 | 0.88 |
| Lobular Inflammation | −0.19 | 0.29 | 0.56 | 0.76 | −0.22 | 0.22 | −0.33 | 0.06 | 0.18 | 0.42 |
| Ballooning | −0.41 | 0.017 | −0.42 | 0.015 | −0.46 | <0.01 | −0.43 | 0.011 | 0.09 | 0.69 |
| Fibrosis | −0.43 | 0.012 | −0.37 | <0.01 | −0.46 | <0.01 | −0.57 | <0.01 | 0.52 | 0.010 |
Abbreviations: VO2=oxygen consumption; E/e’= ratio of early transmitral E wave velocity (E) to early mitral annulus velocities (e’) by tissue Doppler averaged between the lateral and septal.
The most common expressions of exercise ventilatory efficiency, the VE/V CO2 slope and OUES were statistically similar among patients with NAFL and NASH and similar across fibrosis stages. However, there was a significant positive linear trend between ventilatory efficiency when indexed to relative oxygen consumption (VE/VCO2/VO2 ratio, P<0.01) and fibrosis stage (Figure 1E).
Figure 1E:
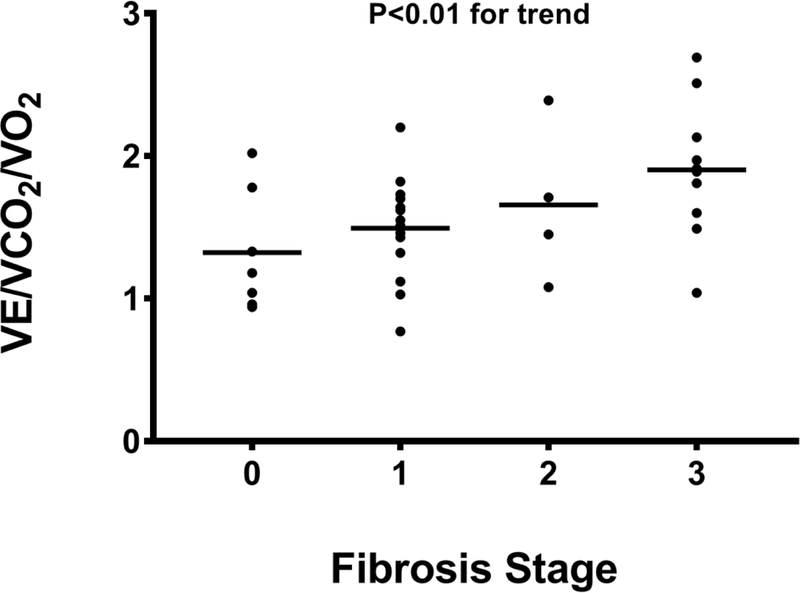
VE/VCO2/VO2 ratio increases with higher fibrosis stage.
Abbreviations: VCO2=carbon dioxide production; VE=minute ventilation; VO2=oxygen consumption
The peak HR and %APMHR were 151 (131–166) bpm and 91 (82–97)% in the entire cohort; no differences in peak HR and %APMHR were noted in patients with NAFL when compared to those with NASH (160 [138–171] vs. 141 [130–156] bpm; P=0.08 and 93 [84– 103]% vs. 88 [80–95]%; P=0.69, respectively). However, peak HR and %APMHR demonstrated a significant inverse linear trend with advancing fibrosis stage (Figures 2A, 2B). No significant association between peak HR and %APMHR with the other individual histological parameters reflective of NASH (steatosis, lobular inflammation, cytological ballooning) was noted. A blunted post-exercise HRR-1’ was noted with increasing fibrosis stage decreasing from 25 (20–30) to 23 (18–27) to 17 (12–22) to 11 (9–18) bpm in subjects with fibrosis stages 0, 1, 2, and 3, respectively (P<0.01) (Figure 2C).
Figure 2A:
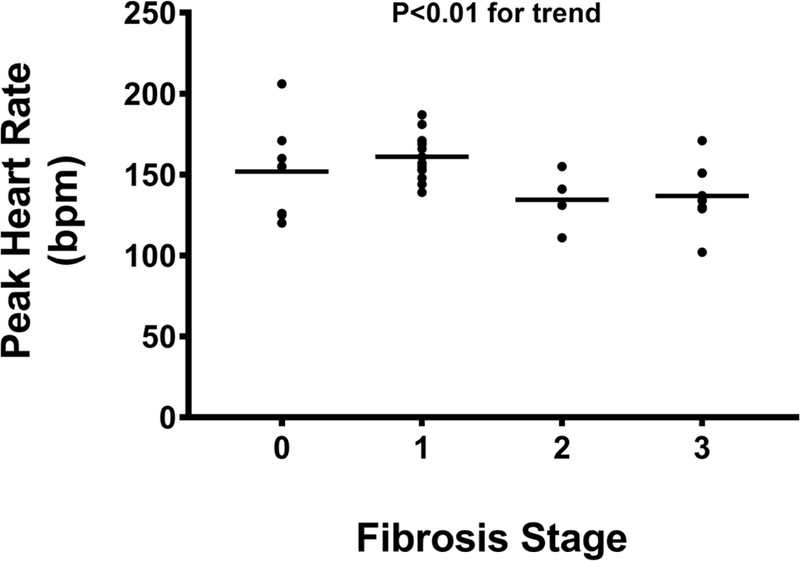
Peak heart rate is lower during cardiopulmonary exercise testing in subjects with moderate and severe hepatic fibrosis.
Abbreviations: bpm = beats per minute.
Figure 2B:
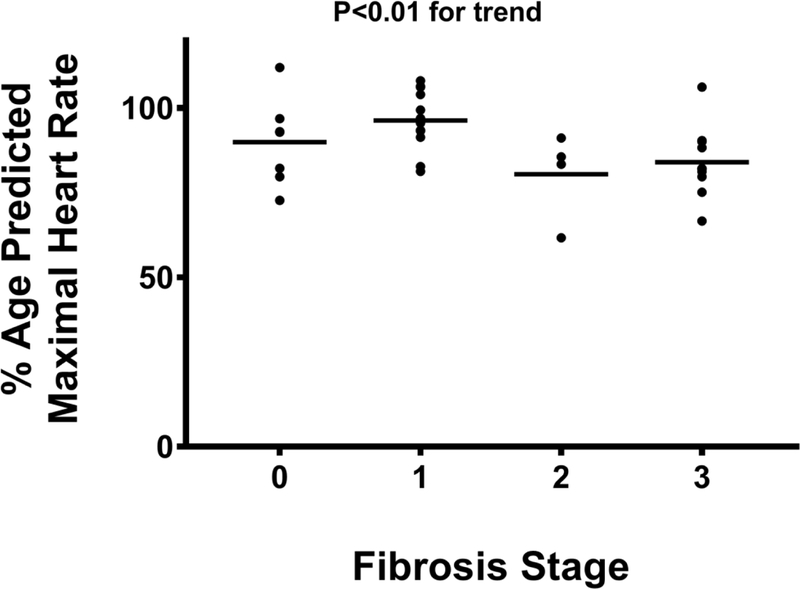
Percent-predicted maximal heart rate achieved during cardiopulmonary exercise testing is lower in patients with bridging fibrosis.
Abbreviations: %=percent.
Figure 2C:
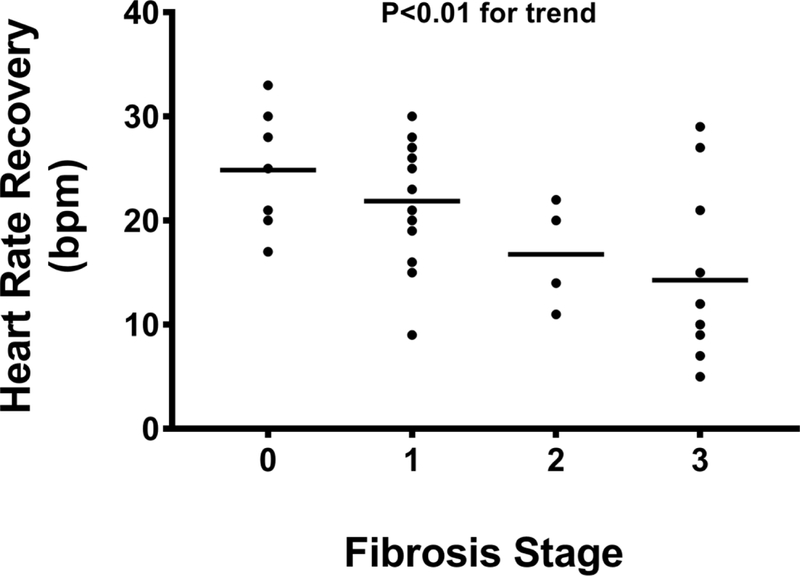
Heart rate recovery at 1-minute after exercise diminishes with increasing fibrosis.
Abbreviations: bpm = beats per minute.
No association between diagnosis of NASH, liver histology, and resting echocardiography parameters was noted (Table 4). Resting E/e’ was inversely associated with pVO2 (R=−0.508, P<0.01), VAT (R=−0.470, P=0.02), exercise time (R=−0.414, P=0.04), OUES (R=−0.407, P=0.04), HRR-1’ (R=−0.530, P<0.01) and positively correlated with the VE/VCO2 slope (R=0.427, P=0.03) and VE/VCO2/VO2 (R=0.617, P<0.01). Likewise, resting e’ was directly related pVO2 (R=0.461, P=0.02), VAT (R=0.472, P=0.02), exercise time (R=0.401, P=0.047), and HRR-1’ (R=0.397, P=0.049), and inversely with VE/VCO2/VO2 (R=−0.537, P<0.01).
Table 4:
Echocardio-Doppler parameters of the cohort stratified based on fibrosis stage.
| Echocardio-Doppler parameters | Overall Group | Stage 0 | Stage 1 | Stage 2 | Stage 3 | P-value |
|---|---|---|---|---|---|---|
| LVEF(%) | 55 (52–58) |
58 (53–58) |
55 (53–62) |
60 (53–64) |
54 (52–57) |
0.21 |
| E/A | 0.95 (0.86–1.1) |
1.07 (1.00–1.15) |
0.96 (0.88–1.03) |
0.99 (0.88–1.10) |
0.87 (0.80–1.22) |
0.10 |
| Rest E/e’ | 7.5 (5.9–9.4) |
7.6 (5.7–8.3) |
7.0 (6.0–8.1) |
7.4 (6.2–10.7) |
11.1 (5.7–16.3) |
0.21 |
| Stress e’ (cm/s) | 13.0 (10.9–14.9) |
14.0 (12.4–17.7) |
13.6 (11.1–16.0) |
11.6 (6.6–14.6) |
11.6 (8.6–13.1) |
0.06 |
| Stress E/e’ | 6.9 (5.6–10.2) |
5.6 (4.8–7.4) |
6.5 (5.2–8.6) |
8.7 (6.0–12.8) |
9.8 (6.6–19.6) |
0.01 |
Abbreviations: LVEF=left-ventricular ejection fraction; E/A=ratio of peak early (E) velocity flow to late (A) peak velocity flow in diastole; E/e’= ratio of early transmitral E wave velocity (E) to early mitral annulus velocities (e’) by tissue Doppler averaged between the lateral and septal.
In contrast, on stress echocardiography, a significant stepwise increase in stress E/e’ with increasing fibrosis stage was noted (Figure 3A). The stress E/e’ increased from 5.6 (4.8–7.4) in subjects with no fibrosis to 6.5 (5.2–8.6) in stage 1 fibrosis, 8.7 (6.0–12.8) in stage 2 fibrosis, and 9.8 (6.6–19.6) in stage 3 fibrosis (P= 0.01). A trend between impaired LV relaxation (e’) with exercise and increasing hepatic fibrosis stages was also noted (P=0.06) (Figure 3B). The VE/VCO2/VO2 was inversely associated with stress e’ (R=−0.485, P=0.02) and positively with E/e’ (R=0.485, P=0.02). No association between echocardiographic parameters and other parameters of liver histology (steatosis, lobular inflammation, cytological ballooning) was noted.
Figure 3A:
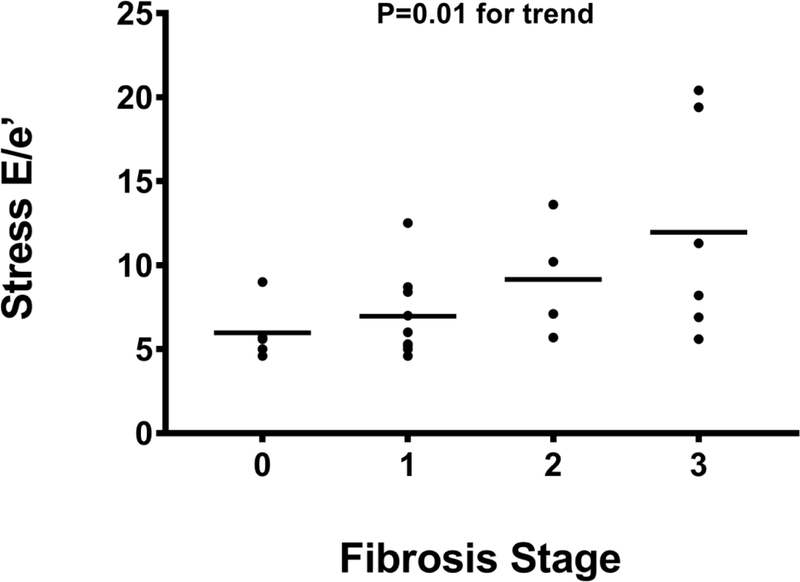
The E/e’ on stress echocardiography is inversely related to hepatic fibrosis.
Abbreviations: E/e’= ratio of early transmitral E wave velocity (E) to early mitral annulus velocities (e’) by tissue Doppler averaged between the lateral and septal.
Figure 3B:
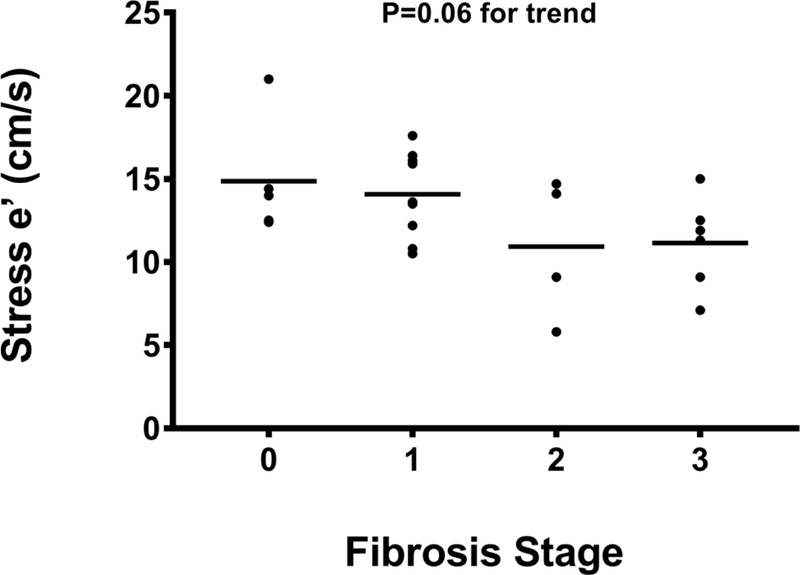
Early mitral annulus velocity (e’) by tissue Doppler averaged between lateral and septal on stress echocardiography correlates with severity of hepatic fibrosis.
Abbreviations: cm/s=centimeters per second; e’= early mitral annulus velocities by tissue Doppler averaged between the lateral and septal.
The median DASI score for the cohort was 42.7 (29.6–50.7) and no significant differences in DASI scores were noted in patients with NASH vs. NAFL or increasing hepatic fibrosis stage. A statistically significant association between the DASI score and pVO2 (R=0.35, P=0.04), VAT (R=0.42, P=0.016), and exercise time (R=0.49, P<0.01) was demonstrated, indicating perceived ADL tolerance tracked appropriately with objective exercise metrics. Finally, no association between DASI and echocardiographic parameters was noted.
DISCUSSION
Diastolic dysfunction is increasingly being described in patients with NAFLD, likely due to shared risk factors such as DM, hypertension, and obesity.5,6 The current study demonstrates that the changes in ventricular relaxation noted in previous studies translates to functional impairment as demonstrated by decreased peak VO2, exercise time, and VAT. Furthermore, a significant inverse relationship between the E/e’, a marker of diastolic dysfunction, and pVO2, VAT, exercise time, and OUES was noted indicating a close link between the severity of diastolic dysfunction and the markers of functional impairment studied. These changes were further significantly impacted by the severity of underlying liver disease.
Prior studies have shown that in early NAFLD, there are bioenergetic changes in the myocardium as defined by a reduced creatine phosphate to adenosine triphosphate ratio that precede structural changes.7 As disease progresses, patients with NAFLD tend to develop higher ectopic cardiac (myocardial, epicardial and pericardial) fat deposition6,25, underscoring the notion that ectopic fat deposition, inflammation and fibrosis are system-wide phenomenon which are occurring in parallel in the liver and the heart in susceptible individuals. In the current study, progressive fibrosis and NASH was linked to a greater degree of diastolic dysfunction. Since diastolic dysfunction has been linked to cardiac fibrosis26, it is possible that the same mechanistic process driving fibrosis progression within the liver to end-stage liver disease also drives changes within the heart that can then lead to cardiac fibrosis and diastolic dysfunction.
Mirroring the levels of diastolic dysfunction, patients with higher fibrosis stages or NASH were more likely to have reduced exercise capacity. Reduced exercise capacity can arise from cardiac causes (diastolic and/or systolic dysfunction), impaired lung function, obesity, anemia, or skeletal muscle abnormalities.27 However, in this cohort, the spirometry values, BMI, body composition, and serum hemoglobin were similar across fibrosis stages, thus underscoring the independent relationship between NAFLD and cardiorespiratory fitness.
In healthy individuals, heart rate decreases rapidly after cessation of exercise, and the rate of decline is a marker of parasympathetic function.28 Abnormal heart rate recovery, defined by a blunted reduction in HR after exercise, is a marker of cardiac autonomic dysfunction and is associated with increased morbidity and mortality even in the absence of overt CVD.29 In the current study, many patients without overt diagnosis or signs of HF demonstrated marked abnormalities in HR recovery post-exercise which inversely trended with liver fibrosis stages; the worst HR recovery occurred in those subjects with bridging fibrosis, suggesting an increased risk of CVD and all-cause mortality.30 These findings build on prior studies showing that the severity of liver disease is associated with increases in CVD-related mortality.4 Our results support the concept that the degree of diastolic dysfunction, exercise capacity, and heart rate recovery in patients with NAFLD represent a system-wide process that also affects the heart.
As with all studies, while the current study provides several novel insights, it also raises new questions and has limitations. When the study was developed, there were no data to model sample size. While our projections indicate that the key findings have reasonable power, larger studies are needed to evaluate the impact of varying combinations of risk factors, disease activity, and fibrosis stage on diastolic dysfunction. Furthermore, it will be important to study if improvement in NASH fibrosis with weight-loss or drug intervention results in improved diastolic function and/or exercise capacity in this population. Further studies are also needed to better understand the mechanisms by which diastolic dysfunction progresses along with progression of NASH.
In summary, this study provides proof that diastolic dysfunction in NAFLD is linked to impaired exercise capacity. The severity of impairment in exercise capacity and diastolic function is directly related to the stage of the liver disease.
Acknowledgements/Funding Sources:
This study was funded in part by a grant from the National Heart, Lung, and Blood Institute, Grant Award Number: R34HL118348 and Virginia Commonwealth University’s UL1TR000058 from the National Center for Advancing Translational Science.
Footnotes
Conflict of Interest Statement: The authors have no conflict of interest to report related to this manuscript.
Publisher's Disclaimer: This is a PDF file of an unedited manuscript that has been accepted for publication. As a service to our customers we are providing this early version of the manuscript. The manuscript will undergo copyediting, typesetting, and review of the resulting proof before it is published in its final citable form. Please note that during the production process errors may be discovered which could affect the content, and all legal disclaimers that apply to the journal pertain.
References
- 1.Younossi ZM, Koenig AB, Abdelatif D, Fazel Y, Henry L, Wymer M. Global epidemiology of nonalcoholic fatty liver disease—Meta-analytic assessment of prevalence, incidence, and outcomes. Hepatology 2016;64:73–84. [DOI] [PubMed] [Google Scholar]
- 2.Kleiner DE, Brunt EM, Van Natta M, Behling C, Contos MJ, Cummings OW, Ferrell LD, Liu YC, Torbenson MS, Unalp-Arida A, Yeh M, McCullough AJ, Sanyal AJ, Network NSCR. Design and validation of a histological scoring system for nonalcoholic fatty liver disease. Hepatology 2005;41:1313–1321. [DOI] [PubMed] [Google Scholar]
- 3.Lee JH, Kim D, Kim HJ, Lee CH, Yang JI, Kim W, Kim YJ, Yoon JH, Cho SH, Sung MW, Lee HS. Hepatic steatosis index: a simple screening tool reflecting nonalcoholic fatty liver disease. Dig Liver Dis 2010;42:503–508. [DOI] [PubMed] [Google Scholar]
- 4.Kim D, Kim WR, Kim HJ, Therneau TM. Association between noninvasive fibrosis markers and mortality among adults with nonalcoholic fatty liver disease in the United States. Hepatology 2013;57:1357–1365. [DOI] [PMC free article] [PubMed] [Google Scholar]
- 5.VanWagner LB, Wilcox JE, Colangelo LA, Lloyd-Jones DM, Carr JJ, Lima JA, Lewis CE, Rinella ME, Shah SJ. Association of nonalcoholic fatty liver disease with subclinical myocardial remodeling and dysfunction: A population-based study. Hepatology 2015;62:773–783. [DOI] [PMC free article] [PubMed] [Google Scholar]
- 6.Graner M, Nyman K, Siren R, Pentikainen MO, Lundbom J, Hakkarainen A, Lauerma K, Lundbom N, Nieminen MS, Taskinen MR. Ectopic fat depots and left ventricular function in nondiabetic men with nonalcoholic fatty liver disease. Circ imaging 2014;8: 10.1161/CIRCIMAGING.114.001979. Print 2015 Jan. [DOI] [PubMed] [Google Scholar]
- 7.Perseghin G, Lattuada G, Cobelli F De, Esposito A, Belloni E, Ntali G, Ragogna F, Canu T, Scifo P, Del Maschio A, Luzi L. Increased mediastinal fat and impaired left ventricular energy metabolism in young men with newly found fatty liver. Hepatology 2008;47:51–58. [DOI] [PubMed] [Google Scholar]
- 8.Goland S, Shimoni S, Zornitzki T, Knobler H, Azoulai O, Lutaty G, Melzer E, Orr A, Caspi A, Malnick S. Cardiac abnormalities as a new manifestation of nonalcoholic fatty liver disease: echocardiographic and tissue Doppler imaging assessment. J Clin Gastroenterol 2006;40:949–955. [DOI] [PubMed] [Google Scholar]
- 9.Petta S, Argano C, Colomba D, Camma C, Di Marco V, Cabibi D, Tuttolomondo A, Marchesini G, Pinto A, Licata G, Craxi A, Camma C, Di Marco V, Cabibi D, Tuttolomondo A, Marchesini G, Pinto A, Licata G, Craxi A. Epicardial fat, cardiac geometry and cardiac function in patients with non-alcoholic fatty liver disease: association with the severity of liver disease. J Hepatol 2015;62:928–933. [DOI] [PubMed] [Google Scholar]
- 10.Klocke FJ, Baird MG, Lorell BH, Bateman TM, Messer J V, Berman DS, O’Gara PT, Carabello BA Jr, Cerqueira MD, Sutton MGSJ, DeMaria AN, Udelson JE, Kennedy JW, Verani MS, Williams KA, Antman EM Jr, Alpert JS, Gregoratos G, Anderson JL, Hiratzka LF, Faxon DP, Hunt SA, Fuster V, Jacobs AK, Gibbons RJ, Russell RO, of Cardiology AC, Association AH, for Nuclear Cardiology AS. ACC/AHA/ASNC guidelines for the clinical use of cardiac radionuclide imaging--executive summary: a report of the American College of Cardiology/American Heart Association Task Force on Practice Guidelines (ACC/AHA/ASNC Committee to Revise the 1995 Guideli. J Am Coll Cardiol 2003;42:1318–1333. [DOI] [PubMed] [Google Scholar]
- 11.Siddiqui MS, Fuchs M, Idowu M, Luketic VA, Boyett S, Sargeant C, Stravitz RT, Puri P, Matherly S, Sterling RK, Contos M, Sanyal AJ. Severity of Nonalcoholic Fatty Liver Disease and Progression to Cirrhosis Associate With Atherogenic Lipoprotein Profile. Clin Gastroenterol Hepatol 2014. [DOI] [PMC free article] [PubMed] [Google Scholar]
- 12.Hlatky MA, Boineau RE, Higginbotham MB, Lee KL, Mark DB, Califf RM, Cobb FR, Pryor DB. A brief self-administered questionnaire to determine functional capacity (the Duke Activity Status Index). Am J Cardiol 1989;64:651–654. [DOI] [PubMed] [Google Scholar]
- 13.Arena R, Humphrey R, Peberdy MA, Madigan M. Predicting peak oxygen consumption during a conservative ramping protocol: implications for the heart failure population. J Cardiopulm Rehabil 2003;23:183–189. [DOI] [PubMed] [Google Scholar]
- 14.Guazzi M, Arena R, Halle M, Piepoli MF, Myers J, Lavie CJ. 2016 Focused Update: Clinical Recommendations for Cardiopulmonary Exercise Testing Data Assessment in Specific Patient Populations. Circulation 2016. [DOI] [PubMed] [Google Scholar]
- 15.Shafiq A, Brawner CA, Aldred HA, Lewis B, Williams CT, Tita C, Schairer JR, Ehrman JK, Velez M, Selektor Y, Lanfear DE, Keteyian SJ. Prognostic value of cardiopulmonary exercise testing in heart failure with preserved ejection fraction. The Henry Ford HospITal CardioPulmonary EXercise Testing (FIT-CPX) project. Am Heart J 2016;174:167–172. [DOI] [PMC free article] [PubMed] [Google Scholar]
- 16.Palau P, Dominguez E, Nunez E, Ramon JM, Lopez L, Melero J, Sanchis J, Bellver A, Santas E, Bayes-Genis A, Chorro FJ, Nunez J . Peak Exercise Oxygen Uptake Predicts Recurrent Admissions in Heart Failure With Preserved Ejection Fraction. Rev Esp Cardiol (EnglEd) 2018;71:250–256. [DOI] [PubMed] [Google Scholar]
- 17.Wasserman K, Beaver WL, Whipp BJ. Gas exchange theory and the lactic acidosis (anaerobic) threshold. Circulation 1990;81:II14–30. [PubMed] [Google Scholar]
- 18.Guazzi M, Labate V, Cahalin LP, Arena R. Cardiopulmonary exercise testing reflects similar pathophysiology and disease severity in heart failure patients with reduced and preserved ejection fraction. Eur JPrev Cardiol 2014;21:847–854. [DOI] [PubMed] [Google Scholar]
- 19.Guazzi M, De Vita S, Cardano P, Barlera S, Guazzi MD. Normalization for peak oxygen uptake increases the prognostic power of the ventilatory response to exercise in patients with chronic heart failure. Am Heart J 2003;146:542–548. [DOI] [PubMed] [Google Scholar]
- 20.Van Laethem C, Bartunek J, Goethals M, Nellens P, Andries E, Vanderheyden M. Oxygen uptake efficiency slope, a new submaximal parameter in evaluating exercise capacity in chronic heart failure patients. Am Heart J 2005;149:175–180. [DOI] [PubMed] [Google Scholar]
- 21.Jones NL. Clinical Exercise Testing Saunders; 1997. [Google Scholar]
- 22.Cole CR, Blackstone EH, Pashkow FJ, Snader CE, Lauer MS. Heart-rate recovery immediately after exercise as a predictor of mortality. N Engl J Med 1999;341:1351–1357. [DOI] [PubMed] [Google Scholar]
- 23.Gardin JM, Adams DB, Douglas PS, Feigenbaum H, Forst DH, Fraser AG, Grayburn PA, Katz AS, Keller AM, Kerber RE, Khandheria BK, Klein AL, Lang RM, Pierard LA, Quinones MA, Schnittger I, of Echocardiography AS. Recommendations for a standardized report for adult transthoracic echocardiography: a report from the American Society of Echocardiography’s Nomenclature and Standards Committee and Task Force for a Standardized Echocardiography Report. J Am Soc Echocardiogr 2002;15:275–290. [DOI] [PubMed] [Google Scholar]
- 24. Dini FL, Ballo P, Badano L, Barbier P, Chella P, Conti U, De Tommasi SM, Galderisi M, Ghio S, Magagnini E, Pieroni A, Rossi A, Rusconi C, Temporelli PL. Validation of an echoEDoppler decision model to predict left ventricular filling pressure in patients with heart failure independently of ejection fraction. Eur J Echocardiogr 2010;11:703–710. [DOI] [PubMed] [Google Scholar]
- 25.Rijzewijk LJ, van der Meer RW, Smit JW, Diamant M, Bax JJ, Hammer S, Romijn JA, de Roos A, Lamb HJ. Myocardial steatosis is an independent predictor of diastolic dysfunction in type 2 diabetes mellitus. J Am Coll Cardiol 2008;52:1793–1799. [DOI] [PubMed] [Google Scholar]
- 26.Lewis GA, Schelbert EB, Williams SG, Cunnington C, Ahmed F, McDonagh TA, Miller CA. Biological Phenotypes of Heart Failure With Preserved Ejection Fraction. J Am Coll Cardiol 2017;70:2186–2200. [DOI] [PubMed] [Google Scholar]
- 27.Weisman IM, Weisman IM, Marciniuk D, Martinez FJ, Sciurba F, Sue D, Myers J, Casaburi R, Marciniuk D, Beck K, Zeballos J, Swanson G, Myers J, Sciurba F, Johnson B, Whipp B, Zeballos J, Weisman IM, Beck K, Mahler D, Cotes J, Sietsema K, Ross RM. ATS/ACCP statement on cardiopulmonary exercise testing. Am JRespir Crit Care Med 2003;167:1451; author reply 1451. [DOI] [PubMed] [Google Scholar]
- 28.Imai K, Sato H, Hori M, Kusuoka H, Ozaki H, Yokoyama H, Takeda H, Inoue M, Kamada T. Vagally mediated heart rate recovery after exercise is accelerated in athletes but blunted in patients with chronic heart failure. J Am Coll Cardiol 1994;24:1529–1535. [DOI] [PubMed] [Google Scholar]
- 29.Kizilbash MA, Carnethon MR, Chan C, Jacobs DR, Sidney S, Liu K. The temporal relationship between heart rate recovery immediately after exercise and the metabolic syndrome: The CARDIA study. Eur Heart J 2006;27:1592–1596. [DOI] [PubMed] [Google Scholar]
- 30.Qiu S, Cai X, Sun Z, Li L, Zuegel M, Steinacker JM, Schumann U. Heart rate recovery and risk of cardiovascular events and all-cause mortality: A meta-analysis of prospective cohort studies. J Am Heart Assoc 2017;6. [DOI] [PMC free article] [PubMed] [Google Scholar]


