

Abstract
Hippocampal microglia are vulnerable to the effects of ageing, displaying a primed phenotype and hyper-responsiveness to various stimuli. We have previously shown that short-term high fat diet (HFD) significantly impairs hippocampal- and amygdala-based cognitive function in the aged without affecting it in the young. Here we assessed if morphological and functional changes in microglia might be responsible for this. We analysed hippocampus and amygdala from young and ageing rats that had been given three days HFD; a treatment sufficient to cause both hippocampal- and amygdala-dependent cognitive and neuroinflammatory differences in the aged. Ageing led to the expected priming of hippocampal microglia in that it increased microglial numbers and reduced branching in this region. Ageing also increased microglial phagocytosis of microbeads in the hippocampus, but the only effect of HFD in this region was to increase the presence of enlarged synaptophysin boutons in the aged, indicative of neurodegeneration. In the amygdala, HFD exacerbated the effects of ageing on microglial priming (morphology) and markedly suppressed phagocytosis without notably affecting synaptophysin. These data reveal that, like the hippocampus, the amygdala displays ageing-related microglial priming. However, the microglia in this region are also uniquely vulnerable to the detrimental effects of short-term HFD in ageing.
Keywords: microglia, synaptophysin, ageing, high fat diet
1.1. Introduction
Microglia are the brain’s resident immune cells (Arcuri, Mecca, Bianchi, Giambanco, & Donato, 2017; Del Río Hortega, 1920). In young healthy adults they perform various important immunoregulatory functions including phagocytosing pathogens after infection and dead cells after injury (Davalos et al., 2005; Nimmerjahn, Kirchhoff, & Helmchen, 2005). They are involved in chronic stress (Hinwood et al., 2013; Lehmann, Cooper, Maric, & Herkenham, 2016; Tynan et al., 2010) and are likely to be highly important in the neuronal response to various learning tasks with their key role in synaptic remodeling (De Luca et al., 2016; Parkhurst et al., 2013). Microglia are known to be responsive to high fat diet (HFD) and both obesity in humans and HFD in rodent models contribute to acute microgliosis in hypothalamic regions responsible for the regulation of feeding and metabolism (Jeon et al., 2012; Thaler et al., 2012). The long-term outcome in this regard is that microgliosis disrupts hypothalamic networks so as to prevent satiety signals communicating positive energy balance. The resulting leptin resistance encourages further eating (Borges et al., 2011; Kleinridders et al., 2009).
The hypothalamus is a particularly vulnerable brain region to circulating inflammatory factors, and subsequent microgliosis, given its proximity to a more permeable blood-brain barrier (Banks, 2016; Williams, 2012). The arcuate nucleus and other circumventricular organs are physically located such that they are acutely affected by circulating factors from the periphery, including free fatty acids that may activate toll-like receptors on microglia and so lead to a pro-inflammatory central response (D. Cai & Liu, 2012; Milanski et al., 2009; Miller & Spencer, 2014). Indeed, we have even seen that hypothalamic microgliosis can occur in the absence of an overt peripheral pro-inflammatory signal in cases of neonatal overfeeding (G. Cai et al., 2015). In addition to these studies, recent data suggest long-term HFD can lead to microgliosis in extra-hypothalamic regions, including those relevant for cognition (Cope et al., 2018). As such, elevated levels of microglial marker, ionized calcium binding adaptor molecule 1 (Iba1), are seen in the rat hippocampus after 20 weeks’ HFD feeding, accompanied by high tumor necrosis factor α (TNFα) expression (Jeon et al., 2012). High Iba1 is also seen in prefrontal cortex after 14 weeks’ HFD (Pepping, Freeman, Gupta, Keller, & Bruce-Keller, 2013). This microgliosis in these regions is linked to cognitive dysfunction, since elevated hippocampal Iba1 occurs with deficits in Morris water maze performance and both are reversed with the anti-inflammatory anti-oxidant, resveratrol (Jeon et al., 2012). Nonetheless, cognitive regions are very well protected from this pro-inflammatory onslaught. In young adult rats a HFD of three to four months is necessary to cause overt inflammation-related cognitive deficits unless additional factors are present to compound these effects (Almeida-Suhett, Graham, Chen, & Deuster, 2017; Jeon et al., 2012; Pepping et al., 2013). Thus, in rodent models, a high sugar diet, neonatal or juvenile HFD, or HFD in conjunction with immune challenge can lead to memory deficits, but short-term HFD alone, in the young adult, does not (Beilharz, Maniam, & Morris, 2016; Boitard et al., 2014; De Luca et al., 2016; Sobesky et al., 2014; Sobesky et al., 2016; Tran & Westbrook, 2017).
In the ageing, the pro-inflammatory response to HFD is another matter. Several elegant studies have clarified that microglia proliferate, hypo-ramify, and are hyper-responsive to challenge with ageing (Mrak & Griffin, 2005a; Spittau, 2017). This microgliosis and microglial priming may account for some of the ageing-associated decline in cognitive function and vulnerability to diseases of ageing like Alzheimer’s (Mrak & Griffin, 2005b). In our recent work, we have shown that ageing animals have hippocampal and amygdala-based cognitive deficits after three days’ HFD, and not if they are fed only normal chow (Spencer et al., 2017). This effect of HFD on cognition is not seen in young animals. Corresponding with this poor performance in tests of contextual and cued fear conditioning is indications of inflammation in the hippocampus and amygdala (Spencer et al., 2017). Interleukin 1β (IL-1β) protein is elevated with HFD in ageing in both regions and there is also an increase in the gene expression of major histocompatibility complex II (MHCII) (Spencer et al., 2017), a microglial marker that is typically increased with increased microglial activity. Given microglia’s primed phenotype in the ageing animal and the potential for microglial vulnerability to HFD throughout life, a logical extension of this work is to hypothesize that microglia play a key role in the cognitive disabilities seen in ageing rats after a short-term HFD.
We therefore examined the morphological and functional changes in microglia in ageing rats, compared with young, in the context of HFD. To examine if these changes are likely to be associated with the deficits these HFD-fed ageing rats have in contextual and cued fear conditioning, we also investigated microglial responses to the conditioning footshock stimulus used to induce contextual memory. While ageing clearly led to morphological changes consistent with priming as expected, these changes were largely not exacerbated by HFD and were not sufficient to explain the cognitive deficits we see in HFD-fed aged animals. On the other hand, the microglial capacity for phagocytosis was markedly affected by HFD and ageing and, in accordance, HFD in ageing exacerbated the appearance of enlarged synaptophysin- immunoreactive synaptic boutons, indicative of neurodegeneration.
2.1. Materials and Methods
2.1.1. Animals
Animals were male F344xBN F1 rats obtained from the National Institute on Aging Rodent Colony maintained by Charles River Laboratories. Upon arrival at the facility, aged rats were 24 months old and weighed approximately 500 g. Young adult rats were three months old and weighed approximately 300 g. Following arrival, animals were allowed to acclimatize to the facility for at least seven days prior to diet modifications. The rats were pair-housed, age-matched, in standard cages (46 × 26 × 21cm; L × W × H) with food and water available ad libitum. The colony room was maintained at 22 °C on a 12 hr light/dark cycle (lights on at 07:00). All experiments were performed during the light phase. All experiments were conducted in accordance with protocols approved by the University of Colorado Animal Care and Use Committee. All efforts were made to minimize the number of animals used and their suffering. A subset of the rats used in this study was also used in (Spencer et al., 2017), where weight and cognitive characteristics are reported.
2.1.2. Diet
Animals were assigned to either continue consuming their regular chow (Teklad Diets, TD.8640; energy density of 3.0 kcal/g; 29% calories from protein, 54% from carbohydrates (no sweetener added), and 17% from fat (0.9% saturated, 1.2% monounsaturated, 2.7% polyunsaturated)), or an adjusted calorie HFD (TD.06414, Envigo, energy density of 5.1 kcal/g; 18.4% calories from protein, 21.3% from carbohydrates (90 g/kg sucrose, 160 g/kg maltodextrin), and 60.3% from fat (37% saturated, 47% monounsaturated, 16% polyunsaturated)).
2.1.3. Tissue collection including microglial isolation
After three days on HFD, or regular chow, rats were injected (i.p.) with a lethal dose of sodium pentobarbital until unresponsive to toe-pinch (Fig. 1A; experiment 1). Then the rats were transcardially perfused with ice cold 0.9% saline for 3 min. Following saline perfusion, brains were extracted from the skull and hemisected in the sagittal plane. The right hemisphere was immersion-fixed for 24 hr in 4% paraformaldehyde before being placed in 20% sucrose in PBS (4 °C). The left hemisphere was processed for use in other experiments.
Figure 1.
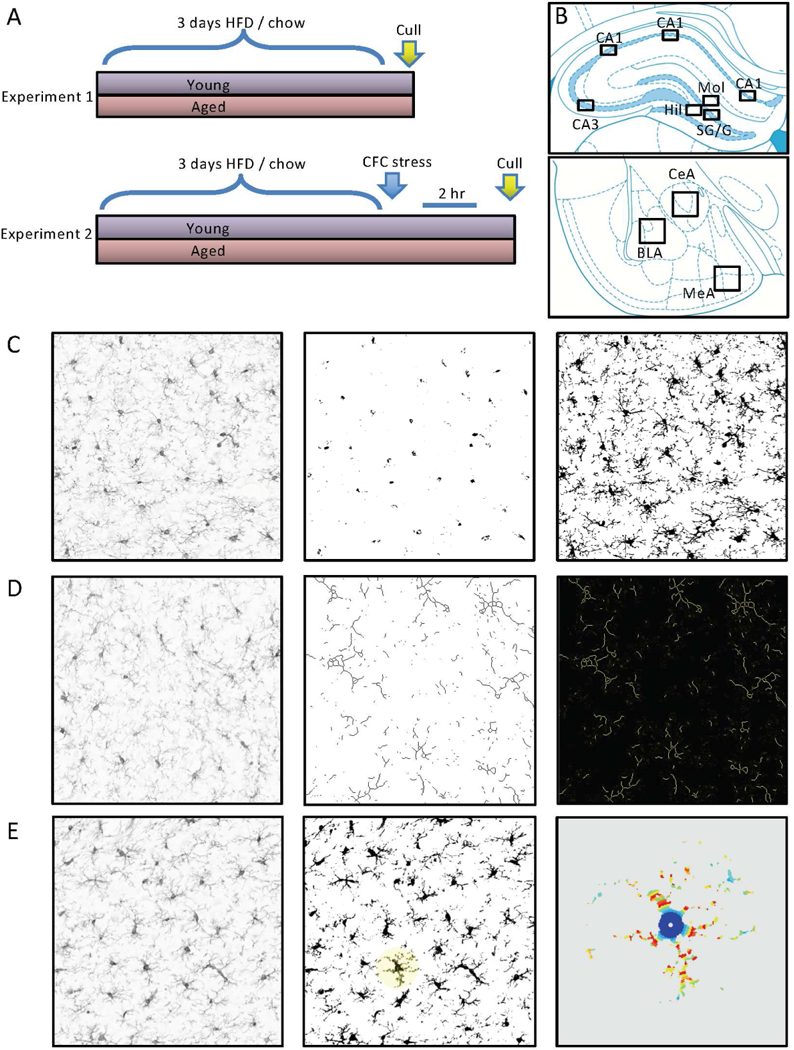
Experimental design and morphological assessment of microglia. A) Experiment 1: after three days high fat diet (HFD), or regular chow, rats were culled and brains collected. Experiment 2: after three days HFD, or regular chow, rats were given footshocks within a contextual fear conditioning (CFC) context. They were culled 2 hr later and brains collected. B) Paxinos and Watson brain atlas schematics illustrating regions from which photomicrographs were taken for analysis. C) Illustration of the thresholding method applied to assess area of ionized calcium binding adaptor molecule 1 (Iba1) immunolabelling. Left panel is the unprocessed image. Middle panel is the image thresholded for cell counts (i.e. soma only). Right panel is the image thresholded for total Iba1 labelling (i.e. soma and processes). D) Illustration of the skeletonization method applied to assess branching of Iba1-labelled cells. Left panel is the unprocessed image. Middle panel is the skeletonized image. Right panel is the analysis output showing branching and end points. D) Illustration of the Sholl analysis method applied to assess complexity of Iba1-labelled cells. Left panel is the unprocessed image. Middle panel is the binarized image with a cell selected for Sholl analysis. Right panel is the heat map analysis output showing Iba1-labelling intersections with the Sholl concentric circles.
A separate cohort of rats was used for the phagocytosis assay experiment. Following saline perfusion, amygdala and hippocampus were dissected bilaterally and microglia were isolated using a Percoll density gradient as previously described (Frank, Wieseler-Frank, Watkins, & Maier, 2006), as this procedure yields highly pure microglia (Iba1+/MHCII+/CD163-/GFAP-). Briefly, dissected tissues were homogenized using hand-held glass homogenizers containing 3 mL of 0.2% glucose in 1X Dulbecco’s phosphate buffered saline (DPBS). The homogenate was passed through a 40 μm filter into a 50 mL conical flask, and then rinsed with an additional 2 mL of DPBS. Cells were pelleted at 1000 g for 10 min at 22 °C, and the supernatant was discarded. The pellet was resuspended in 2 mL of 70% isotonic Percoll (GE Healthcare, Chicago, IL, USA). A layer of 50% Percoll (2 mL) was gently pipetted over the 70% layer. A final layer of DPBS (1 mL) was pipetted over the 50% layer. This preparation was spun at 1200 g for 45 min at 22 °C with no acceleration or braking. Myelin debris was removed from the DPBS/50% interface and then microglia were extracted from the 50/70% interface using a glass pipette. Microglia were washed in DPBS and then pelleted at 1000 g for 10 min at 22 °C. After isolation, microglia were resuspended in media (filtered sterile high glucose Dulbecco’s modified eagle medium [Gibco, Dublin, Ireland] + 10% fetal bovine serum [Atlanta Biologicals, Flowery Branch, GA, USA]), and the concentration of viable microglia was determined by trypan blue dye exclusion.
2.1.4. Microglial responses to acute footshock
To assess microglial responses to the acute footshock that is the encoding stimulus for contextual and cued fear memory, in the context of ageing and HFD, we examined brain tissue from rats that had been exposed to footshock for a contextual fear conditioning experiment (Fig. 1A; experiment 2). Cognitive data from this experiment are presented in (Spencer et al., 2017). Three days after consuming their respective diets, rats were taken two at a time from their home cage and each was placed in a separate conditioning chamber (26 × 21 × 24 cm; L × W × H) made of clear plastic and topped with a wire mesh top. Rats were allowed to explore the chamber for 2 min before the onset of a 15 s tone (76 dB), followed immediately by a 2 s footshock (1.5 mA) delivered through a removable floor of stainless steel rods that were each wired to a shock generator and scrambler (Coulbourn Instruments, Allentown, PA, USA). Immediately after the termination of the shock, rats were removed from the chamber and returned to their home cage for 2 hr. At this point, they were culled as above and tissue dissected. The right hemisphere was immersion fixed as above for immunohistochemistry.
2.1.5. Immunohistochemistry
For immunohistochemistry, 30 μm cryostat-cut sections through the hippocampus and amygdala were immunolabelled for Iba1. Sections from each treatment group were randomly selected and processed at the same time. Briefly, sections were incubated in primary Iba1 antibody (overnight; 4 °C; 1:1000; rabbit; Wako Chemicals USA Inc., Richmond, VA, USA). For the non-footshocked experiment, sections were incubated in biotinylated secondary antibody (1.5 hr; 1:200; anti-rabbit; Vector Laboratories, Burlingame, CA, USA) and avidin-biotin horseradish peroxidase (HRP) complex (ABC; 45 min; Vector Elite Kit; Vector). To visualize the HRP activity, the sections were incubated in diaminobenzidine (DAB), seen as amber staining. The reactions were stopped when the contrast between specific cellular and non-specific background labeling was optimal. Sections were mounted and air-dried, dehydrated in a series of alcohols, cleared in histolene and coverslipped. For the footshock experiments, sections were incubated in Alexa-fluor 488-conjugated secondary antibody (1 hr; 1:500; goat anti-rabbit; Thermo Scientific, Rockford, IL, USA), then mounted on slides using Fluoroshield with DAPI mounting solution (Sigma-Aldrich, St Louis, MO, USA). We also assessed synaptophysin and postsynaptic density (PSD)-95 immunoreactivity in sections from the non-footshocked rats using primary anti-synaptophysin antibody (overnight; 4 °C; 1:1000; mouse; Sigma-Aldrich) or primary PSD-95 antibody (36 hr; 4 °C; 1:200; rabbit; Life Technologies Carlsbad, CA, USA) followed by Alexa-fluor 594-conjugated secondary antibody (2 hr; 1:500; donkey anti-mouse; Life Technologies) and Alexa-fluor 488-conjugated secondary antibody (2 hr; 1:500; goat anti-rabbit; Life Technologies), respectively. These sections were then mounted on slides using Fluoroshield with DAPI mounting solution (Sigma-Aldrich).
2.1.6. Immunohistochemistry analysis
Microglial analysis
We first assessed numbers of cells and area of staining with Iba1 labeling in our region of interest using the thresholding method on photomicrograph images imported into image analysis software ImageJ (National Institutes of Health, Bethesda, MD, USA) as previously described (Beynon & Walker, 2012; Radler, Hale, & Kent, 2014). We took photomicrograph images of all sections on an Olympus upright microscope (Olympus BX41; Olympus, Melbourne, Vic, Au) with a 20 times objective lens using an Olympus DP72 digital camera (Olympus) and LabSens image capture software v1.6 (Olympus) software. Images were taken at 1360 × 1024 pixel density. They were then imported into and processed using Image J. We auto-subtracted background and converted each image to 16 bit for analysis, then cropped each image to take a representative 400 × 300 pixel sample from each region of interest within each section. Regions of interest were identified according to the Paxinos and Watson Rat Brain Atlas (Paxinos and Watson, 2009). A schematic representation of each sampled region of interest assessed is shown in Fig. 1B. We then assessed numbers of Iba1-positive cells and density of staining using the thresholding method, as described (Beynon & Walker, 2012; Radler et al., 2014).
The thresholding procedure involves adjusting the pixels of the image to be included in the quantification to those that encompass the staining of interest and not the background staining (Fig. 1C). We determined the threshold intensity for each brain region by calculating the average optimal (manually obtained) threshold for each animal in the young-regular chow group (as our control) for each region for each experiment. This mean was then applied to all the sections assessed for that region (including to the young-regular chow group) with the section identities blinded to the experimenter. We did this separately for cell count and density; the latter is presented as an area fraction, i.e. the percentage of thresholded material within the region of interest.
Using the same images, we also investigated microglial branching and process length by performing a skeletonization analysis (Fig. 1D). For this analysis, Image J processes each image so that pixels are subtracted sequentially from thresholded material until each structure is only one pixel wide. It then automatically calculates numbers of branches and summed process length for the entire image. We also assessed microglial complexity with a Sholl analysis on three cells per section from the same images (ImageJ; Fig. 1E). The first three cells identified by Image J in the thesholded analysis for cell count (as identified in the ‘outlines’ function) were processed for Sholl analysis except where the processes for that cell overlapped with those of a neighbor or with the edge of the region of interest, in which case the next identified cell was assessed. Because of microglia’s characteristic tiling pattern (Kettenmann, Kirchhoff, & Verkhratsky, 2013) there was minimal overlap between neighboring cells but occasionally we did see cells where two somas were in very close proximity. These were not included. Hippocampal and amygdala sections (Fig. 1B) were all assessed by an experimenter blinded to treatment conditions. For each region, we analysed four sections 120 µm apart. Hippocampus: between 2.52 and 4.56 mm caudal to the bregma per animal; amygdala: 2.16 and 3.36 caudal to the bregma. We saw no differences between the rostrocaudal levels for any of the regions, so we took the sum counts and mean density, skeletonization, and Sholl data as our sampled result.
Synaptophysin and PSD-95 analysis
For synaptophysin intensity we employed the thresholding procedure as described above, manually assessing the young-regular chow group to establish a control value against which to threshold all the sections. Since PSD-95 is more uniformly and ubiquitously expressed in our sections, we could not employ the thresholding procedure, so instead used an integrated density measurement in ImageJ. Regions of interest, image sizes, magnification, numbers of sections etc. were as described above. To assess the number of enlarged synaptophysin-positive boutons, we were not able to employ an automated thresholding procedure due to the variable overall intensity affecting the automated processing, so these enlargements were identified by eye and all synaptophysin-positive aggregates between 4 and 14 μm included as enlarged synaptophysin-positive boutons.
Design-based stereology
For these analyses we were not able to use a strictly design-based stereology approach but we did employ several principles of this technique as far as was feasible. Design-based stereology employs an a priori design to utilize systematic uniformly random sampling of cells of interest to maximize efficiency and accuracy when counting. To ensure uniformly random sampling, we used serial brain slices (i.e. a one in four series of 30 μm brain sections, 120 µm apart), with the starting point for collection of brain tissue being pseudo-randomized (within about 100 μm) to be the second intact brain section obtainable from the most rostral aspect of the brain once the angle with respect to the cryostat blade was adjusted. Once this series was obtained, the sampling site was selected according to known neuroanatomical landmarks as described in the Paxinos and Watson brain atlas with four serial sections from this pseudo-randomized starting point included to reduce the issue of lack of homology within each brain region (Howard & Reed, 2005). Notably, we have found no rostrocaudal differences to indicate such a lack of homology. Our profile-based sampling method from sections separated by 120 μm also eliminates the possibility of an increase in cell size being erroneously interpreted as an increase in number (since the cells would have to increase dramatically for this to be the case and such an increase would be not only visually obvious but would be apparent in our density measurements). A counting procedure employing an optical fractionator was not practicable in this case due to the relatively small total number of microglia within each region. Current standards suggest it is necessary to count several hundred cells to achieve necessary precision (Schmitz & Hof, 2000), thus optical fractionation-based counting is not best-practice for obtaining estimates of microglial numbers. To maintain appropriate rigor in our approach, we have therefore not attempted to estimate the total number of microglia within the region, but have taken samples from each region, counting all cells within the sample. We assert that any under-sampling in the selection of fields (i.e. not counting every cell in the hippocampus) is more likely to generate a type II than a type I error and so we can be confident our reported statistically significant differences reflect real biological differences. Importantly, we employ the same principles for all our groups and our outcome of interest is the comparison between the groups.
2.1.7. Phagocytosis assay
Microglial phagocytosis capacity was measured using an in vitro assay adapted from (Fonken et al., 2018). Briefly, isolated microglia (described above) from amygdala and hippocampus of young and aged rats fed chow or HFD were plated at a density of 1.2 × 10⁴ cells (amygdala) or 2 × 10⁴ cells (hippocampus) per well in eight-well chambered culture slides (Nunc Lab-Tek II; ThermoFisher Waltham, MA, USA). The microglia were incubated at 37 °C, 5% CO3 for 2 hr. Latex beads-rabbit IgG-FITC complex (1:100 final concentration on cells; Cayman Chemicals, Ann Arbor, MI, USA) were then added to the wells. After 30 min incubation, the beads were washed off with PBS and the cells were fixed with cold 4% paraformaldehyde for 30 min. The slides were stored in PBS. For immunocytochemistry, slides were incubated in 10% normal donkey serum for 30 min, then with primary antibody (rabbit anti-Iba1, 1:1000; Wako) overnight. Cells were washed three times with PBS, then incubated with secondary antibody (Alexa 546 donkey anti-rabbit, 1:500; ThermoFisher) and DAPI for 2 hr. Slides were coverslipped and imaged using an inverted Nikon Ti-E microscope (at the CU-Boulder Light Microscopy Core Facility). For image capture and analysis, 20 images per well were taken (random areas within the well) and we assessed the percentage of microglial cells containing green beads.
2.1.8. Data Analysis
All experiments had 6–8 rats per group; exact numbers for each experiment are described in the results section. Unequal sample sizes both within and across experiments are typically related to attrition of aged rats due to naturally occurring ailments, such as tumors. Data were analysed by SPSS using multi-factorial analyses of variance (ANOVAs) with Tukey’s post hoc tests where significant interactions were found. Data are mean ± SEM and statistical significance was assumed when p ≤ 0.05.
3.1. Results
3.1.1. Ageing alters microglial morphology in the hippocampus, with minimal additional effects of three days HFD
In the hippocampus, ageing led to reduced microglial complexity, with a shift from a surveillant morphology towards a more activated phenotype, with HFD having no additional effects; n = 6 per group. Thus, in the CA1, age increased microglial numbers (F(1,20) = 8.53, p = 0.008; Fig. 2A), reduced branching (F(1,20) = 7.28, p = 0.014; Fig. 2C), and reduced the overall process length per microglial cell (F(1,20) = 7.77, p = 0.011; Fig. 2D), with no effect on the area of Iba1 labelling per cell (Fig. 2B), or soma size (not shown), and no additional effect of diet. There were no significant differences between the groups in complexity as assessed with Sholl analysis (Fig. 2E, F).
Figure 2.

Effects of age and high fat diet on CA1 and CA3 Iba1 labelling. A) number of Iba1-positive cells. B) percentage area per cell labelled with Iba1. C) number of branches per cell. D). summed process length per cell. E) number of intersections at increasing distances from the soma, CA1. F) mean number of intersections at increasing distances from the soma binned into 10 µm bins, CA1. G) number of intersections at increasing distances from the soma, CA3. H) mean number of intersections at increasing distances from the soma binned into 10 µm bins, CA3. Data are mean +/− SEM. * main effect of age (p<0.05). I) representative images of Iba1-labelling in the CA3. Scale bar = 50 μm.
In the CA3 there was a similar effect of age on microglial number and complexity to that seen in the CA1, with also no effect of HFD. Age increased microglial numbers (F(1,20) = 24.26, p < 0.001; Fig. 2A, I). It also reduced the per cell area labelled with Iba1 (F(1,20) = 4.24, p = 0.053; Fig. 2B), increased the soma size (F(1,20) = 9.94, p = 0.005; not shown), reduced microglial branching (F(1,20) = 25.70, p < 0.001; Fig. 2C), and reduced the overall process length per cell (F(1,20) = 25.06, p < 0.001; Fig. 2D). There were no additional effects of diet. Sholl analysis indicated a reduced complexity in the aged animals close to the soma, i.e. between 0 and 10 µm (F(1,20) = 40.99, p < 0.001) and between 21 and 30 µm (F(1,20) = 4.637, p = 0.044) from the soma and, again, no effect of diet (Fig. 2G, H).
As with the CA1 and CA3 regions, age increased microglial numbers in the hilus of the dentate gyrus (F(1,20) = 5.86, p = 0.025; Fig. 3A). Age also reduced area per cell labelled with Iba1 (F(1,20) = 13.77, p = 0.001; Fig. 3B), increased soma size (F(1,20) = 4.90, p = 0.039; not shown), and reduced the number of branches (F(1,20) = 10.37, p = 0.004; Fig. 3C) and overall process length per microglial cell (F(1,20) = 9.35, p = 0.006; Fig. 3D). There were no effects of diet. There were also no significant effects of age or diet on complexity with the Sholl analysis (Fig. 3E–F). There were no significant effects of age or diet on any of the parameters measured in the molecular region of the dentate gyrus (Fig. 3A–D) except that, like in the CA3, Sholl analysis indicated a reduced soma-proximate complexity (between 0 and 10 µm) in the aged rats (F(1,20) = 7.33, p = 0.014; Fig. 3G, H). In the subgranular / granular (SG) region of the dentate gyrus, age increased microglial numbers as it did in the other hippocampal regions (F(1,20) = 27.0, p < 0.001; Fig. 3A). Age reduced area per cell labelled with Iba1 (F(1,20) = 11.95, p = 0.002; Fig. 3B), and reduced the number of branches (F(1,20) = 14.68, p = 0.001; Fig. 3C) and overall process length per microglial cell (F(1,20) = 7.37, p = 0.013; Fig. 3D). There was no effect on soma size (not shown). Sholl analysis indicated a reduced complexity in the aged animals close to the soma, i.e. between 11 and 20 µm (F(1,20) = 4.36, p = 0.05), with, again no effect of diet. Diet did significantly reduce complexity distal to the soma, i.e. between 61 and 70 µm (F(1,20) = 5.06, p = 0.036; Fig. 3I, J).
Figure 3.

Effects of age and high fat diet on dentate gyrus Iba1 labelling. A) number of Iba1-positive cells. B) percentage area per cell labelled with Iba1. C) number of branches per cell. D). summed process length per cell. E) number of intersections at increasing distances from the soma, hilus. F) mean number of intersections at increasing distances from the soma binned into 10 μm bins, hilus. G) number of intersections at increasing distances from the soma, molecular.H) mean number of intersections at increasing distances from the soma binned into 10 μm bins, molecular. I) number of intersections at increasing distances from the soma, subgranular. J) mean number of intersections at increasing distances from the soma binned into μm bins, subgranular. Data are mean +/− SEM. * main effect of age (p<0.05).
3.1.2. Ageing alters microglial morphology in the amygdala, with additional effects of three days HFD
In the amygdala, ageing again led to reduced microglial complexity, indicative of priming or activation, with a shift from a ramified morphology towards a more activated phenotype; n = 6 per group. Unlike in the hippocampus, HFD compounded these effects, particularly in the CeA.
In the MeA, age increased microglial numbers in the HFD-fed compared with young given the same HFD (significant ageing by diet interaction: F(1,20) = 4.98, p = 0.037; Fig. 4A). Age also reduced the number of branches per cell (F(1,20) = 16.09, p = 0.001; Fig. 4C) and overall process length (F(1,20) = 8.77, p = 0.008; Fig. 4D), irrespective of diet. Sholl analysis revealed a reduced complexity in the aged animals close to the soma, i.e. between 0 and 10 μm (F(1,20) = 4.96, p = 0.038; Fig. 4E, F), irrespective of diet.
Figure 4.

Effects of age and high fat diet on amygdala Iba1 labelling. A) number of Iba1-positive cells. B) percentage area per cell labelled with Iba1. C) number of branches per cell. D) summed process length per cell. E) number of intersections at increasing distances from the soma, medial amygdala (MeA). F) mean number of intersections at increasing distances from the soma binned into 10 μm bins, MeA. G) number of intersections at increasing distances from the soma, basolateral amygdala (BLA). H) mean number of intersections at increasing distances from the soma binned into 10 μm bins, BLA. I) number of intersections at increasing distances from the soma, central amygdala (CeA). J) mean number of intersections at increasing distances from the soma binned into 10 μm bins, CeA. Data are mean +/− SEM. # significant difference with Tukey post hoc (p<0.05); * main effect of age (p<0.05). K) representative images of Iba1-labelling in the CeA. Scale bar = 50 μ m.
In the BLA there was a significant interaction between age and diet on microglial numbers (F(1,20) = 5.07, p = 0.036; Fig. 4A), with HFD increasing microglia in aged compared with young HFD-fed rats as was seen in the MeA. Age reduced the area of Iba1 labelling per cell (F(1,20) = 8.71, p = 0.051; Fig. 4B), branches per cell (F(1,20) = 7.10, p = 0.015; Fig. 4C), and overall process length (F(1,20) = 7.56, p = 0.012; Fig. 4D), irrespective of diet. Age also reduced complexity, as revealed by Sholl analysis, with main effects of age proximal (0 to 10 μm: F(1,20) = 4.96, p = 0.038 and 11 to 20 μm: F(1,20) = 5.18, p = 0.034) and distal (21 to 30 μm: F(1,20) = 5.21, p = 0.038) to the soma (Fig. 4G, H).
HFD had more notable effects additional to those of ageing in the CeA. In this region, microglial numbers were increased in ageing HFD-fed rats relative to young HFD-fed rats, but not in the ageing chow-fed (significant ageing by diet interaction: F(1,20) = 5.72, p = 0.027; Fig. 4A, K). Similarly, branches per cell (ageing by diet interaction: F(1,20) = 4.56, p = 0.045; Fig. 4C), and overall process length per cell (ageing by diet interaction: F(1,20) = 11.46, p = 0.003; Fig. 4D) were reduced in the ageing HFD-fed group compared with young HFD-fed, but ageing failed to have a significant effect in this region in the absence of the HFD. There was also a main effect of age on microglial complexity proximal to the soma (0 to 10 μm; F(1,20) = 4.42, p = 0.048; Fig. 4I, J).
3.1.3. Ageing and HFD alter microglial morphology in the hippocampus after footshock
To determine if the combination of ageing and HFD might lead to microglial responses to the conditional stimulus used to encode contextual and cued memory, we examined microglial morphology in a cohort of ageing and HFD-fed rats that had been subjected to the footshock; n = 6–8 per group. In the CA1 region of the hippocampus of the rats that had been given the footshock, age increased microglial numbers without an effect on density of Iba1 labelling, as in the absence of footshock, and there were no additional effects of diet (F(1,34) = 11.98, p = 0.001; Fig. 5A). Unlike under basal conditions, after footshock there was an increase in the number of branches per cell (significant main effect of age: F(1,26) = 8.88, p = 0.006; Fig. 5C), and summed process length per cell (significant main effect of age: F(1,26) = 6.60, p = 0.016, and diet: F(1,26) = 4.79, p = 0.038; Fig. 5D) in the aged relative to the young CA1, indicative of increases in ramification of the microglia with ageing in this cohort.
Figure 5.

Effects of age and high fat diet on A-D) CA1 and CA3 Iba1 labelling after footshock. A) number of Iba1-positive cells. B) percentage area per cell labelled with Iba1. C) number of branches per cell. D) summed process length per cell. Effects of age and high fat diet on E-H) dentate gyrus Iba1 labelling after footshock. E) number of Iba1-positive cells. F) percentage area per cell labelled with Iba1. G) number of branches per cell. H) summed process length per cell. Effects of age and high fat diet on I-L) amygdala Iba1 labelling after footshock. I) number of Iba1-positive cells. J) percentage area per cell labelled with Iba1. K) number of branches per cell. L). summed process length per cell. Data are mean +/− SEM. # significant difference with Tukey post hoc (p<0.05); * main effect of age (p<0.05); $ main effect of diet (p<0.05).
In the CA3, age increased microglial numbers in both chow and HFD fed groups (ageing by diet interaction: F(1,26) = 5.87, p = 0.023; Fig. 5A), as was seen in the absence of footshock. As with basal conditions, age reduced CA3 microglial complexity in terms of branches per cell (ageing by diet interaction: F(1,20) = 9.30, p = 0.006; Fig. 5C), and process length per cell (F(1,20) = 113.31, p < 0.001; Fig. 5D).
In the hilus of the footshocked rats, age increased numbers of microglia (significant main effect of age: F(1,25) = 34.35, p < 0.001; Fig. 5E), reduced branches (ageing by diet interaction: F(1,26) = 5.10, p = 0.03; Fig. 5G), and process length (significant main effect of age: F(1,26) = 18.02, p < 0.001, and diet: F(1,26) = 4.22, p = 0.05; Fig. 5H) as it had under basal conditions. Unlike under basal conditions, HFD also reduced complexity in terms of branching, specifically in the young rats, and process length. Age increased numbers of microglia in the molecular region (significant main effect of age: F(1,26) = 17.28, p < 0.001; Fig. 5E), and reduced Iba1 labelling per cell (significant main effect of age: F(1,24) = 4.99, p = 0.04; Fig. 5F). There was an interaction between age and HFD on process length (ageing by diet interaction: F(1,25) =9.43, p = 0.005; Fig. 5H), after footshock that was not seen under basal conditions. Similarly, in the subgranular region, there were effects of diet and age on branches per cell (significant main effect of age: F(1,26) = 13.54, p = 0.001, and diet: F(1,26) = 6.28, p = 0.019; Fig. 5G). Thus, collectively, ageing rats have increased microglial numbers in the hippocampus after footshock and under basal conditions compared with young rats. Microglial complexity is also similarly affected in basal and footshocked conditions except that there is increased CA1 ramification in the footshocked group but reduced ramification under basal conditions with ageing.
3.1.4. The effects of HFD on microglial morphology in the ageing amygdala are not apparent after footshock
In the MeA of the rats that had experienced footshock, ageing increased microglial numbers (F(1,26) = 19.72, p < 0.001; n = 6–8; Fig. 5I) as we had previously seen for non-shocked conditions, but there was no interaction to suggest this effect was more prominent in the HFD ageing rats. In this cohort, there was more MeA Iba1 labelling in the young HFD rats per cell (significant ageing by diet interaction: F(1,25) = 5.06, p = 0.034; Fig. 5J) with no effect of HFD in the aged. In the BLA, after footshock, ageing increased microglial numbers, as was seen under non-stressed conditions (F(1,26) = 14.21, p = 0.001; Fig. 5I). Interestingly, diet increased BLA Iba1 labelling per cell (F(1,26) = 6.40, p = 0.018; Fig. 5J). In the CeA, there was no effect of HFD or ageing on microglial numbers in the context of footshock. HFD significantly increased Iba1 labelling area per cell in both the groups after footshock (significant main effect of diet: F(1,25) = 4.53, p = 0.043; Fig. 5B). In these footshock-treated rats there was no effect of either diet or ageing on microglial complexity in any of the amygdala sub-regions, as indicated by numbers of branches, or process length per cell (Fig. 5K, L). Thus, amygdala microglial morphology, particularly in the CeA was influenced by both ageing and HFD under basal conditions, but the additional influence of HFD was not evident after footshock.
3.1.5. HFD affects microglial phagocytosis in the ageing amygdala
As changes in microglial function can sometimes occur in the absence of discernable morphological changes (Lehmann et al., 2016), we next tested if HFD could influence the microglial capacity to phagocytose microbeads in vitro as an index of their capacity for phagocytic function; n = 7–8. We measured the percentage of beads phagocytosed by microglia isolated from the hippocampus or amygdala of young and aged rats that were fed either chow or HFD. Microglia isolated from the hippocampus demonstrated greater phagocytosis in the aged groups than in the young (F(1,26) = 26.99, p < 0.0001), but this activity was not significantly altered by HFD in either age group; Fig. 6A, C). For the microglia isolated from the amygdala there was a significant age by diet interaction (F(1,26) = 16.92, p < 0.0001) with heightened phagocytosis in aged chow-fed rats compared to their younger counterparts. Notably, consuming HFD did not significantly alter phagocytic function in young rats (82% of age-matched controls), but robustly suppressed it in aged rats (54% of age-matched controls; Fig. 6B, D).
Figure 6.

Effects of age and high fat diet on hippocampal and amygdala microglial phagocytosis. Hippocampus percentage of microglia containing beads. B) Amygdala percentage of microglia containing beads. Representative microglial phagocytosis images from C) Hippocampus and D) Amygdala showing microglia in purple (red Iba1 co-localised with blue DAPI) and microglia with phagocytosed beads in yellow (green beads co-localised with red Iba1; white arrows). Data are mean +/− SEM. # significant difference with Tukey post hoc (p<0.05); * main effect of age (p<0.05).
3.1.6. HFD affects synaptophysin immunoreactivity in the ageing
Since the microglial capacity for phagocytosis was elevated in the aged relative to the young, and suppressed, in the aged amygdala, by HFD, we next performed synaptophysin and PSD-95 immunolabelling to assess if HFD is likely to stimulate excessive phagocytosis of pre- or post- synaptic boutons in the aged. There were no differences between the groups in any region in postsynaptic marker PSD-95 (Supp. Fig. 1).
In the hippocampus, overall intensity of synaptophysin immunoreactivity was similar between the groups (Fig. 7A–C, M). In the CA3 region of the hippocampus, we saw significant numbers of enlarged synaptophysin-positive boutons in the aged rats, from both groups, and these were not present in the young (F(1,26) = 11.34, p = 0.002; Fig. 7E). In the CA1 and hilus, ageing similarly caused enlarged synaptophysin-positive boutons, an effect that was significantly exacerbated by the HFD (ageing by diet interaction: CA1: F(1,25) = 11.19, p = 0.003; hilus: F(1,25) = 7.18, p = 0.013; Fig. 7D, F, M). These boutons were between 5 and 10 μm in diameter. There were negligible numbers of enlarged boutons seen in the subgranular and molecular regions in all of the groups.
Figure 7.

Effects of age and high fat diet on hippocampal and amygdala synaptophysin. A) CA1, CA3, C) hilus intensity of synaptophysin labelling. D) CA1, E) CA3, F) hilus numbers of enlarged synaptophysin-positive boutons. G) medial amygdala (MeA), H) basolateral amygdala (BLA), I) central amygdala (CeA) intensity of synaptophysin labelling. J) MeA, K) BLA, L) CeA numbers of enlarged synaptophysin-positive boutons. Data are mean +/− SEM. # significant difference with Tukey post hoc (p<0.05); * main effect of age (p<0.05); $ main effect of diet (p<0.05). M) representative images of synaptophysin-labelling in the hilus. Scale bar = 50 μm.
In the amygdala ageing increased the overall intensity of synaptophysin in the MeA (F(1,23) = 9.68, p = 0.005; Fig. 7G) and BLA (F(1,25) = 4.14, p = 0.053; Fig. 7H), with a further effect of diet on the MeA (F(1,23) = 7.48, p = 0.012) and no differences in the CeA (Fig. 7I). As with the CA3, in the MeA and BLA ageing led to the appearance of enlarged synaptophysin-positive boutons that were not seen in young rats but there was no effect of the HFD (MeA: F(1,26) = 94.87, p < 0.001; BLA: F(1,24) = 137.36, p < 0.001; Fig. 7J, K). In the CeA there was a similar effect of ageing, but also of diet (significant effect of ageing: F(1,25) = 28.20, p < 0.001; and diet: F(1,25) = 6.56, p = 0.017; Fig. 7L), with ageing increasing and diet reducing the numbers of enlarged boutons. Collectively, these data suggest HFD and ageing interact to alter microglial function in a region-specific manner and these changes may be linked to neuronal integrity and cognitive performance (Fig. 8).
Figure 8.
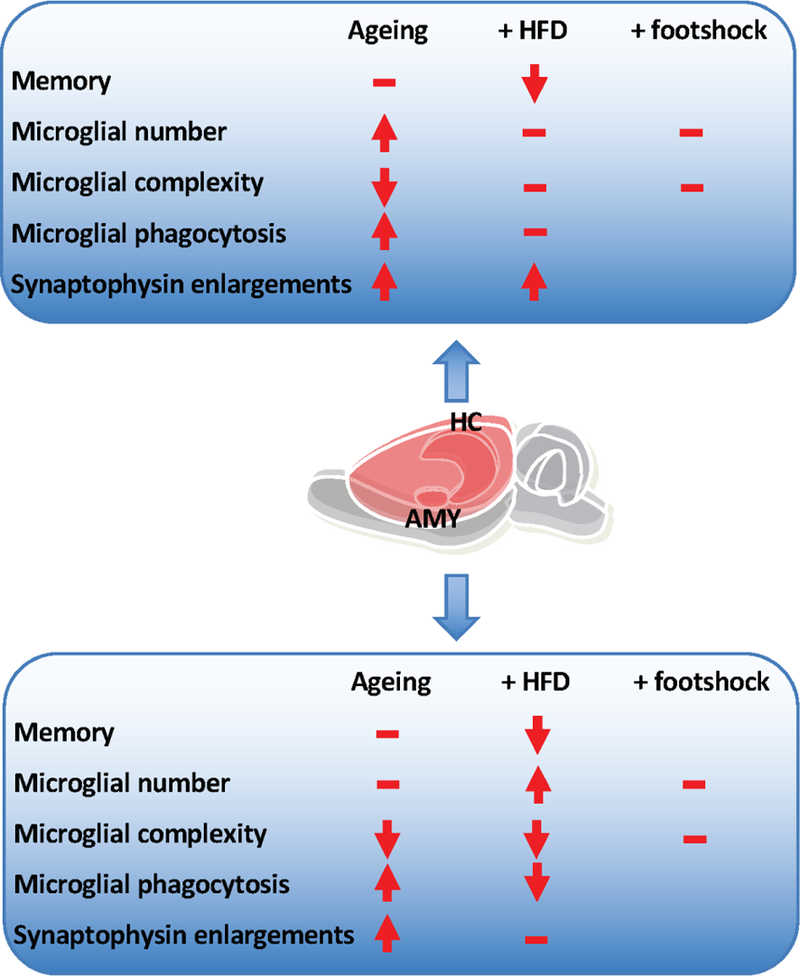
Summary of the effects of age and high fat diet on hippocampal and amygdala microglia. Arrows indicate directions of effect. – indicates no additional effect.
4.1. Discussion
Together these data confirm, characterize and extend previous findings showing that ageing is associated with substantial morphological changes in hippocampal microglia (Sierra, Gottfried-Blackmore, McEwen, & Bulloch, 2007). Hippocampal microglia are thus more numerous as the animal ages and they take on the typical primed phenotype with reduced complexity / ramification. In other studies, including our own, this priming is associated with a hyper- reactivity to stimuli (Barrientos et al., 2015; Frank, Barrientos, Watkins, & Maier, 2010) but not with elevations in hippocampal cytokines (Barrientos et al., 2009) or with memory deficits (Barrientos, Hein, Frank, Watkins, & Maier, 2012; Barrientos et al., 2006; Spencer et al., 2017) under resting conditions. In accordance with this primed phenotype, we observed increased phagocytic capacity in hippocampal microglia in the ageing relative to the young.
Here we also demonstrate, for the first time, that microglial priming also occurs in the amygdala with ageing, with reduced microglial complexity (branching and process length) in the MeA and BLA in the ageing relative to the young under basal conditions. Interestingly, the morphology of the amygdala, but not the hippocampal, microglia is further vulnerable to the short-term influence of a HFD. In all assessed regions of the amygdala, HFD increased numbers of microglia in the aged relative to the young on HFD, with no effect of ageing under chow-fed conditions. In the CeA in particular, HFD reduced microglial complexity / ramification in the aged, but, again, not in the young. Interestingly, this response to HFD appears to be driven, in part, by the young animals reducing microglial number and increasing complexity. Amygdala microglia also seem uniquely vulnerable to the effects of HFD on their phagocytic capacity. Thus, amygdala microglia from aged rats phagocytose more microspheres than those from young rats and this effect is paradoxically abolished by HFD. Conversely, while hippocampal microglia exhibit heightened phagocytosis with advanced age under chow-fed conditions, this capacity is not altered by HFD. These findings reinforce the idea that just as neurons have region-specific roles, neurotransmitters, electrical properties, morphology, and responses to stimuli, so too do microglia display morphological and functional differences and responses depending upon their location in the brain.
An unexpected finding from this study is the phagocytic response to ageing and HFD within the amygdala. It is not surprising that ageing per se elevates microglial phagocytosis, and this is consistent with the ageing-related decline in synaptic plasticity (Morrison & Baxter, 2012; Petralia, Mattson, & Yao, 2014). However, the effect of HFD on this response is paradoxical. At face value it appears HFD “rescues” this hyper-phagocytosis and restores the aged animals to a young phenotype. Given the ageing-related memory deficits (Spencer et al., 2017) and synaptophysin immunoreactivity, it is highly unlikely this is the case. Microglial phagocytosis is an adaptive process with two major roles: one, to ‘mop up’ dead and dying cellular debris, and two, to eliminate dendritic synaptic spines (Neumann, Kotter, & Franklin, 2009; Tremblay, Lowery, & Majewska, 2010; Wake, Moorhouse, Jinno, Kohsaka, & Nabekura, 2009). This latter probably functions to strategically strengthen or weaken neuronal synapses as needed (Ji, Akgul, Wollmuth, & Tsirka, 2013). The ageing-induced increased phagocytosis is consistent with the primed microglial phenotype and is possibly an adaptive response to increased cellular apoptosis in the ageing brain. These data are also supported by previous findings that have shown that aged microglia are more phagocytic than younger controls at baseline (Conde & Streit, 2006), but are less phagocytic upon immune challenge or damage (von Bernhardi, Tichauer, & Eugenin, 2010). These studies suggest that at baseline aged microglia attempt to maintain homeostasis by phagocytosing debris more readily, whereas after challenge or injury the capacity for this anti-inflammatory process is robustly reduced and thus they exhibit an extended and greater inflammatory phenotype. These data suggest that the young microglia, but not those from the aged, are buffered against HFD-induced reductions in phagocytic activity. In this case, a reduction in this adaptive response (as induced by HFD) would lead to reduced microglia-mediated clearing and repairing, and a retention of debris and reactive oxygen species, that could interfere with the neuronal processing required for memory performance. This idea remains to be tested. However, clearly, microglia’s phagocytic role in the ageing brain deserves further study.
Consistent with these regional differences in microglial morphology and phagocytic activity, HFD in ageing induces robust deficits in memory performance in tests that are strongly amygdala-dependent (contextual and cued fear conditioning) and milder deficits in tests dependent on the hippocampus alone (Morris water maze). It is well known that inactivating the amygdala (via neurotoxic lesions or pharmacological manipulations) interferes with consolidation of both contextual and cued fear memories, whereas inactivating the hippocampus interferes with consolidation of contextual but not cued fear memory (Antoniadis & McDonald, 2000; Phillips & LeDoux, 1992). It has been further demonstrated that the basolateral amygdala plays a critical role, in conjunction with the hippocampus, to modulate consolidation of contextual memories (Huff & Rudy, 2004), and it does so through inputs to the medial entorhinal cortex (Wahlstrom et al., 2018). It is therefore very possible that the microglial changes observed here in the amygdala are driving the memory deficits we have previously reported (Spencer et al., 2017). These findings are striking when compared to our previous work, which has shown that other challenges (E. coli and abdominal surgery) cause hippocampal, but not amygdala-dependent memory deficits and these are associated with microglial priming in hippocampus and not amygdala (Barrientos et al., 2012; Frank, Miguel, Watkins, & Maier, 2010). Of these challenges we have investigated, it is only HFD that is able to induce both amygdala microgliosis and amygdala-mediated fear conditioning deficits. It thus seems likely that HFD uniquely induces contextual and cued fear memory deficits through an amygdala microglia-dependent mechanism.
Interestingly, in rats that experienced the footshock conditioning stimulus associated with the fear conditioning, some of the effects of ageing and HFD on microglial morphology were no longer evident. In the CA1 region, ageing under basal conditions led to reduced microglial complexity. After footshock, complexity was increased. Similarly, in the amygdala, complexity was reduced with age under basal conditions but was not different after footshock. This effect is possibly reflective of an adaptive response to the footshock in the young that is not seen in the aged whereby the microglia in these regions are acutely activated, but this idea remains to be tested. Nonetheless, these data suggest that if microglia are involved in the detrimental effects of HFD on memory in the aged, it is not likely that they do this by obstructing the appropriate processing of the footshock stimulus. There were no notable effects of HFD on microglia in these footshock experiments that might account for the memory deficits we see. On the other hand, this study shows regional differences and similarities in synaptophysin immunoreactivity that suggest HFD exacerbates the presence of enlarged synaptophysin-positive boutons in the aged, which may account for the memory impairments. We should note that we did not see differences in post-synaptic marker PSD-95. While unexpected, given our findings with synaptophysin, this is not inconsistent with the literature. Several groups have seen changes in only one of a pre- or a post- synaptic marker (e.g. (Adeosun et al., 2017; Jiang et al., 2015)), and Wang and Mitchell note that eight-carbon medium chain triglycerides in the diet elevate synaptophysin in the hippocampus and improve novel object recognition without affecting PSD-95 (Wang & Mitchell, 2016). Enlarged areas of synaptophysin labelling are associated with dystrophic neurites and have been seen juxtaposed with amyloid plaques (Takeuchi et al., 2000). They are thought to be indicative of pathophysiologic synaptic processing (King & Arendash, 2002) but are usually only seen in models of pathology such as Alzheimer’s disease and multiple sclerosis models (Gudi et al., 2017; King & Arendash, 2002; Rutten et al., 2005). Ageing-related increases in the presence of these enlarged synaptic boutons may suggest the beginning of neurodegeneration that is exacerbated by HFD. This propensity to neurodegeneration reflects the clinical evidence showing hippocampal and amygdala neuronal loss precedes the onset of cognitive decline and dementia in the elderly (Zanchi, Giannakopoulos, Borgwardt, Rodriguez, & Haller, 2017), and amygdala atrophy in particular is associated with certain neuropsychiatric abnormalities in mild Alzheimer’s disease (Poulin et al., 2011).
Thus, it appears that ageing-related priming is evident in hippocampus but is not further affected in this region by HFD. In the amygdala we see ageing-related priming in the sense of reduced complexity in the MeA and BLA that remains consistent irrespective of diet. In the CeA, 3 days HFD leads to more microglia in the aged relative to the young and microglia that are less complex, indicative of hyper-activation; a response that may be driven by a, presumably compensatory, hyper-ramification in the young. Despite morphological changes consistent with a HFD effect on aging being limited to the CeA, phagocytosis in the aged HFD-fed amygdala is strongly suppressed. HFD in the ageing is thus likely to lead to pro-inflammatory cytokine release throughout the amygdala and hippocampus (Spencer et al., 2017) causing heightened cell damage and apoptosis. Without appropriately phagocytic microglia, this damage (including enlarged pre-synaptic boutons) and debris accumulates and neuronal activity is impaired, reflected in poor performance in various memory tasks. In this regard, it is clear from our data that HFD can be detrimental to cognitive performance in the aged in a way that it is not in the young. Supporting the increasing body of evidence implicating microglia in the pathophysiology of neurodegenerative disease (reviewed in (Tay et al., 2017)), our findings suggest that preventing or reversing microglial priming and hyperactivation might therefore improve ageing-related cognitive decline.
Supplementary Material
Highlights:
-
*
Like the hippocampus, the amygdala displays ageing-related microglial priming.
-
*
Microglia in the amygdala are uniquely vulnerable to the detrimental effects of short-term high fat diet in ageing.
-
*
High fat diet does not directly affect hippocampal microglia in ageing rats.
Acknowledgements:
This work was supported by grants from the National Institute on Aging R01AG028271 to R.M.B.; from a National Health and Medical Research Council Career Development Fellowship II, a Club Melbourne Fellowship and a Brain Foundation Research Gift to S.J.S.; from a Dementia Australia Research Foundation Grant to L.S., S.J.S., and R.B.; from the Australian Research Council Centre of Excellence for Nanoscale BioPhotonics (CE140100003) to P.R and B.C.G; and from RMIT Vice-Chancellor’s Postdoctoral Fellowships to P.R. and L.S. These funding bodies had no role in the design of the study or collection, analysis, interpretation of data or in writing the manuscript.
Footnotes
Publisher's Disclaimer: This is a PDF file of an unedited manuscript that has been accepted for publication. As a service to our customers we are providing this early version of the manuscript. The manuscript will undergo copyediting, typesetting, and review of the resulting proof before it is published in its final citable form. Please note that during the production process errors may be discovered which could affect the content, and all legal disclaimers that apply to the journal pertain.
Conflict of interest statement: The authors have no conflicts to declare.
5.1 References
- Adeosun SO, Hou X, Zheng B, Melrose HL, Mosley T, & Wang JM (2017). Human LRRK2 G2019S mutation represses post-synaptic protein PSD95 and causes cognitive impairment in transgenic mice. Neurobiol Learn Mem, 142(Pt B), 182–189. doi: 10.1016/j.nlm.2017.05.001 [DOI] [PMC free article] [PubMed] [Google Scholar]
- Almeida-Suhett CP, Graham A, Chen Y, & Deuster P (2017). Behavioral changes in male mice fed a high-fat diet are associated with IL-1beta expression in specific brain regions. Physiol Behav, 169, 130–140. doi: 10.1016/j.physbeh.2016.11.016 [DOI] [PubMed] [Google Scholar]
- Antoniadis EA, & McDonald RJ (2000). Amygdala, hippocampus and discriminative fear conditioning to context. Behav Brain Res, 108(1), 1–19. [DOI] [PubMed] [Google Scholar]
- Arcuri C, Mecca C, Bianchi R, Giambanco I, & Donato R (2017). The Pathophysiological Role of Microglia in Dynamic Surveillance, Phagocytosis and Structural Remodeling of the Developing CNS. Front Mol Neurosci, 10, 191. doi: 10.3389/fnmol.2017.00191 [DOI] [PMC free article] [PubMed] [Google Scholar]
- Banks WA (2016). From blood-brain barrier to blood-brain interface: new opportunities for CNS drug delivery. Nat Rev Drug Discov, 15(4), 275–292. doi: 10.1038/nrd.2015.21 [DOI] [PubMed] [Google Scholar]
- Barrientos RM, Frank MG, Hein AM, Higgins EA, Watkins LR, Rudy JW, & Maier SF (2009). Time course of hippocampal IL-1 beta and memory consolidation impairments in aging rats following peripheral infection. Brain Behav Immun, 23(1), 46–54. doi: 10.1016/j.bbi.2008.07.002 [DOI] [PMC free article] [PubMed] [Google Scholar]
- Barrientos RM, Hein AM, Frank MG, Watkins LR, & Maier SF (2012). Intracisternal interleukin-1 receptor antagonist prevents postoperative cognitive decline and neuroinflammatory response in aged rats. J Neurosci, 32(42), 14641–14648. doi: 10.1523/JNEUROSCI.2173-12.2012 [DOI] [PMC free article] [PubMed] [Google Scholar]
- Barrientos RM, Higgins EA, Biedenkapp JC, Sprunger DB, Wright-Hardesty KJ, Watkins LR, … Maier SF (2006). Peripheral infection and aging interact to impair hippocampal memory consolidation. Neurobiol Aging, 27(5), 723–732. doi: 10.1016/j.neurobiolaging.2005.03.010 [DOI] [PubMed] [Google Scholar]
- Barrientos RM, Thompson VM, Kitt MM, Amat J, Hale MW, Frank MG, … Maier SF (2015). Greater glucocorticoid receptor activation in hippocampus of aged rats sensitizes microglia. Neurobiol Aging, 36(3), 1483–1495. doi: 10.1016/j.neurobiolaging.2014.12.003 [DOI] [PMC free article] [PubMed] [Google Scholar]
- Beilharz JE, Maniam J, & Morris MJ (2016). Short-term exposure to a diet high in fat and sugar, or liquid sugar, selectively impairs hippocampal-dependent memory, with differential impacts on inflammation. Behav Brain Res, 306, 1–7. doi: 10.1016/j.bbr.2016.03.018 [DOI] [PubMed] [Google Scholar]
- Beynon SB, & Walker FR (2012). Microglial activation in the injured and healthy brain: what are we really talking about? Practical and theoretical issues associated with the measurement of changes in microglial morphology. Neuroscience, 225, 162–171. doi: 10.1016/j.neuroscience.2012.07.029 [DOI] [PubMed] [Google Scholar]
- Boitard C, Cavaroc A, Sauvant J, Aubert A, Castanon N, Laye S, & Ferreira G (2014). Impairment of hippocampal-dependent memory induced by juvenile high-fat diet intake is associated with enhanced hippocampal inflammation in rats. Brain Behav Immun, 40, 9–17. doi: 10.1016/j.bbi.2014.03.005 [DOI] [PubMed] [Google Scholar]
- Borges BC, Rorato R, Avraham Y, da Silva LE, Castro M, Vorobiav L, … Elias LL (2011). Leptin resistance and desensitization of hypophagia during prolonged inflammatory challenge. Am J Physiol Endocrinol Metab, 300(5), E858–869. doi: 10.1152/ajpendo.00558.2010 [DOI] [PubMed] [Google Scholar]
- Cai D, & Liu T (2012). Inflammatory cause of metabolic syndrome via brain stress and NF-kappaB. Aging (Albany NY), 4(2), 98–115. [DOI] [PMC free article] [PubMed] [Google Scholar]
- Cai G, Dinan T, Barwood JM, De Luca SN, Soch A, Ziko I, … Spencer SJ (2015). Neonatal overfeeding attenuates acute central pro-inflammatory effects of short-term high fat diet. Front Neurosci, 8(446), 1–13. [DOI] [PMC free article] [PubMed] [Google Scholar]
- Conde JR, & Streit WJ (2006). Microglia in the aging brain. J Neuropathol Exp Neurol, 65(3), 199–203. doi: 10.1097/01.jnen.0000202887.22082.63 [DOI] [PubMed] [Google Scholar]
- Cope EC, LaMarca EA, Monari PK, Olson LB, Martinez S, Zych AD, … Gould E (2018). Microglia play an active role in obesity-associated cognitive decline. J Neurosci doi: 10.1523/JNEUROSCI.0789-18.2018 [DOI] [PMC free article] [PubMed]
- Davalos D, Grutzendler J, Yang G, Kim JV, Zuo Y, Jung S, … Gan WB (2005). ATP mediates rapid microglial response to local brain injury in vivo. Nat Neurosci, 8(6), 752–758. doi:nn1472 [pii]10.1038/nn1472 [DOI] [PubMed] [Google Scholar]
- De Luca SN, Ziko I, Sominsky L, Nguyen JC, Dinan T, Miller AA, … Spencer SJ (2016). Early life overfeeding impairs spatial memory performance by reducing microglial sensitivity to learning. J Neuroinflammation, 13(1), 112. doi: 10.1186/s12974-016-0578-7 [DOI] [PMC free article] [PubMed] [Google Scholar]
- Del Río Hortega P (1920). Estudios sobre la neuroglía. La microglía y su transformación en células en bastoncito y cuerpos granuloadiposos. . Trab. Lab. Invest. Biol, 18, 37–82. [Google Scholar]
- Fonken LK, Frank MG, Gaudet AD, D’Angelo HM, Daut RA, Hampson EC, … Maier SF (2018). Neuroinflammatory priming to stress is differentially regulated in male and female rats. Brain Behav Immun doi: 10.1016/j.bbi.2018.03.005 [DOI] [PMC free article] [PubMed]
- Frank MG, Barrientos RM, Watkins LR, & Maier SF (2010). Aging sensitizes rapidly isolated hippocampal microglia to LPS ex vivo. J Neuroimmunol, 226(1–2), 181–184. doi: 10.1016/j.jneuroim.2010.05.022 [DOI] [PMC free article] [PubMed] [Google Scholar]
- Frank MG, Miguel ZD, Watkins LR, & Maier SF (2010). Prior exposure to glucocorticoids sensitizes the neuroinflammatory and peripheral inflammatory responses to E. coli lipopolysaccharide. Brain Behav Immun, 24(1), 19–30. doi:S0889–1591(09)00386–9 [pii]10.1016/j.bbi.2009.07.008 [DOI] [PubMed] [Google Scholar]
- Frank MG, Wieseler-Frank JL, Watkins LR, & Maier SF (2006). Rapid isolation of highly enriched and quiescent microglia from adult rat hippocampus: immunophenotypic and functional characteristics. J Neurosci Methods, 151(2), 121–130. doi: 10.1016/j.jneumeth.2005.06.026 [DOI] [PubMed] [Google Scholar]
- Gudi V, Gai L, Herder V, Tejedor LS, Kipp M, Amor S, … Skripuletz T (2017). Synaptophysin Is a Reliable Marker for Axonal Damage. J Neuropathol Exp Neurol doi: 10.1093/jnen/nlw114 [DOI] [PubMed]
- Hinwood M, Tynan RJ, Charnley JL, Beynon SB, Day TA, & Walker FR (2013). Chronic stress induced remodeling of the prefrontal cortex: structural re-organization of microglia and the inhibitory effect of minocycline. Cereb Cortex, 23(8), 1784–1797. doi: 10.1093/cercor/bhs151 [DOI] [PubMed] [Google Scholar]
- Howard CV, & Reed MG (2005). Unbiased Stereology (second edition). : Garland Science/BIOS Scientific Publishers. [Google Scholar]
- Huff NC, & Rudy JW (2004). The amygdala modulates hippocampus-dependent context memory formation and stores cue-shock associations. Behav Neurosci, 118(1), 53–62. doi: 10.1037/0735-7044.118.1.53 [DOI] [PubMed] [Google Scholar]
- Jeon BT, Jeong EA, Shin HJ, Lee Y, Lee DH, Kim HJ, … Roh GS (2012). Resveratrol attenuates obesity-associated peripheral and central inflammation and improves memory deficit in mice fed a high-fat diet. Diabetes, 61(6), 1444–1454. doi: 10.2337/db11-1498 [DOI] [PMC free article] [PubMed] [Google Scholar]
- Ji K, Akgul G, Wollmuth LP, & Tsirka SE (2013). Microglia actively regulate the number of functional synapses. PLoS One, 8(2), e56293. doi: 10.1371/journal.pone.0056293 [DOI] [PMC free article] [PubMed] [Google Scholar]
- Jiang Y, Liu Y, Zhu C, Ma X, Ma L, Zhou L, … Chen X (2015). Minocycline enhances hippocampal memory, neuroplasticity and synapse-associated proteins in aged C57 BL/6 mice. Neurobiol Learn Mem, 121, 20–29. doi: 10.1016/j.nlm.2015.03.003 [DOI] [PubMed] [Google Scholar]
- Kettenmann H, Kirchhoff F, & Verkhratsky A (2013). Microglia: new roles for the synaptic stripper. Neuron, 77(1), 10–18. doi: 10.1016/j.neuron.2012.12.023 [DOI] [PubMed] [Google Scholar]
- King DL, & Arendash GW (2002). Maintained synaptophysin immunoreactivity in Tg2576 transgenic mice during aging: correlations with cognitive impairment. Brain Res, 926(1–2), 58–68. [DOI] [PubMed] [Google Scholar]
- Kleinridders A, Schenten D, Konner AC, Belgardt BF, Mauer J, Okamura T, … Bruning JC (2009). MyD88 signaling in the CNS is required for development of fatty acid-induced leptin resistance and diet-induced obesity. Cell Metab, 10(4), 249–259. doi: 10.1016/j.cmet.2009.08.013 [DOI] [PMC free article] [PubMed] [Google Scholar]
- Lehmann ML, Cooper HA, Maric D, & Herkenham M (2016). Social defeat induces depressive-like states and microglial activation without involvement of peripheral macrophages. J Neuroinflammation, 13(1), 224. doi: 10.1186/s12974-016-0672-x [DOI] [PMC free article] [PubMed] [Google Scholar]
- Milanski M, Degasperi G, Coope A, Morari J, Denis R, Cintra DE, … Velloso LA (2009). Saturated fatty acids produce an inflammatory response predominantly through the activation of TLR4 signaling in hypothalamus: implications for the pathogenesis of obesity. J Neurosci, 29(2), 359–370. doi: 10.1523/JNEUROSCI.2760-08.2009 [DOI] [PMC free article] [PubMed] [Google Scholar]
- Miller AA, & Spencer SJ (2014). Obesity and neuroinflammation: A pathway to cognitive impairment. Brain Behav Immun, 42, 10–21. doi: 10.1016/j.bbi.2014.04.001 [DOI] [PubMed] [Google Scholar]
- Morrison JH, & Baxter MG (2012). The ageing cortical synapse: hallmarks and implications for cognitive decline. Nat Rev Neurosci, 13(4), 240–250. doi: 10.1038/nrn3200 [DOI] [PMC free article] [PubMed] [Google Scholar]
- Mrak RE, & Griffin WS (2005a). Glia and their cytokines in progression of neurodegeneration. Neurobiol Aging, 26(3), 349–354. doi: 10.1016/j.neurobiolaging.2004.05.010 [DOI] [PubMed] [Google Scholar]
- Mrak RE, & Griffin WS (2005b). Potential inflammatory biomarkers in Alzheimer’s disease. J Alzheimers Dis, 8(4), 369–375. [DOI] [PubMed] [Google Scholar]
- Neumann H, Kotter MR, & Franklin RJ (2009). Debris clearance by microglia: an essential link between degeneration and regeneration. Brain, 132(Pt 2), 288–295. doi: 10.1093/brain/awn109 [DOI] [PMC free article] [PubMed] [Google Scholar]
- Nimmerjahn A, Kirchhoff F, & Helmchen F (2005). Resting microglial cells are highly dynamic surveillants of brain parenchyma in vivo. Science, 308(5726), 1314–1318. doi: 10.1126/science.1110647 [DOI] [PubMed] [Google Scholar]
- Parkhurst CN, Yang G, Ninan I, Savas JN, Yates JR 3rd, Lafaille JJ, … Gan WB (2013). Microglia promote learning-dependent synapse formation through brain-derived neurotrophic factor. Cell, 155(7), 1596–1609. doi: 10.1016/j.cell.2013.11.030 [DOI] [PMC free article] [PubMed] [Google Scholar]
- Pepping JK, Freeman LR, Gupta S, Keller JN, & Bruce-Keller AJ (2013). NOX2 deficiency attenuates markers of adiposopathy and brain injury induced by high-fat diet. Am J Physiol Endocrinol Metab, 304(4), E392–404. doi: 10.1152/ajpendo.00398.2012 [DOI] [PMC free article] [PubMed] [Google Scholar]
- Petralia RS, Mattson MP, & Yao PJ (2014). Communication breakdown: the impact of ageing on synapse structure. Ageing Res Rev, 14, 31–42. doi: 10.1016/j.arr.2014.01.003 [DOI] [PMC free article] [PubMed] [Google Scholar]
- Phillips RG, & LeDoux JE (1992). Differential contribution of amygdala and hippocampus to cued and contextual fear conditioning. Behav Neurosci, 106(2), 274–285. [DOI] [PubMed] [Google Scholar]
- Poulin SP, Dautoff R, Morris JC, Barrett LF, Dickerson BC, & Alzheimer’s Disease Neuroimaging I (2011). Amygdala atrophy is prominent in early Alzheimer’s disease and relates to symptom severity. Psychiatry Res, 194(1), 7–13. doi: 10.1016/j.pscychresns.2011.06.014 [DOI] [PMC free article] [PubMed] [Google Scholar]
- Radler ME, Hale MW, & Kent S (2014). Calorie restriction attenuates lipopolysaccharide (LPS)- induced microglial activation in discrete regions of the hypothalamus and the subfornical organ. Brain Behav Immun, 38, 13–24. doi: 10.1016/j.bbi.2013.11.014 [DOI] [PubMed] [Google Scholar]
- Rutten BP, Van der Kolk NM, Schafer S, van Zandvoort MA, Bayer TA, Steinbusch HW, & Schmitz C (2005). Age-related loss of synaptophysin immunoreactive presynaptic boutons within the hippocampus of APP751SL, PS1M146L, and APP751SL/PS1M146L transgenic mice. Am J Pathol, 167(1), 161–173. doi: 10.1016/S0002-9440(10)62963-X [DOI] [PMC free article] [PubMed] [Google Scholar]
- Schmitz C, & Hof PR (2000). Recommendations for straightforward and rigorous methods of counting neurons based on a computer simulation approach. J Chem Neuroanat, 20(1), 93–114. [DOI] [PubMed] [Google Scholar]
- Sierra A, Gottfried-Blackmore AC, McEwen BS, & Bulloch K (2007). Microglia derived from aging mice exhibit an altered inflammatory profile. Glia, 55(4), 412–424. doi: 10.1002/glia.20468 [DOI] [PubMed] [Google Scholar]
- Sobesky JL, Barrientos RM, De May HS, Thompson BM, Weber MD, Watkins LR, & Maier SF (2014). High-fat diet consumption disrupts memory and primes elevations in hippocampal IL-1beta, an effect that can be prevented with dietary reversal or IL-1 receptor antagonism. Brain Behav Immun, 42, 22–32. doi: 10.1016/j.bbi.2014.06.017 [DOI] [PMC free article] [PubMed] [Google Scholar]
- Sobesky JL, D’Angelo HM, Weber MD, Anderson ND, Frank MG, Watkins LR, … Barrientos RM (2016). Glucocorticoids Mediate Short-Term High-Fat Diet Induction of Neuroinflammatory Priming, the NLRP3 Inflammasome, and the Danger Signal HMGB1. eNeuro, 3(4). doi: 10.1523/ENEURO.0113-16.2016 [DOI] [PMC free article] [PubMed] [Google Scholar]
- Spencer SJ, D’Angelo H, Soch A, Watkins LR, Maier SF, & Barrientos RM (2017). High-fat diet and aging interact to produce neuroinflammation and impair hippocampal- and amygdalar- dependent memory. Neurobiol Aging, 58, 88–101. doi: 10.1016/j.neurobiolaging.2017.06.014 [DOI] [PMC free article] [PubMed] [Google Scholar]
- Spittau B (2017). Aging Microglia-Phenotypes, Functions and Implications for Age-Related Neurodegenerative Diseases. Front Aging Neurosci, 9, 194. doi: 10.3389/fnagi.2017.00194 [DOI] [PMC free article] [PubMed] [Google Scholar]
- Takeuchi A, Irizarry MC, Duff K, Saido TC, Hsiao Ashe K, Hasegawa M, … Iwatsubo T (2000). Age-related amyloid beta deposition in transgenic mice overexpressing both Alzheimer mutant presenilin 1 and amyloid beta precursor protein Swedish mutant is not associated with global neuronal loss. Am J Pathol, 157(1), 331–339. [DOI] [PMC free article] [PubMed] [Google Scholar]
- Tay TL, Bechade C, D’Andrea I, St-Pierre MK, Henry MS, Roumier A, & Tremblay ME (2017). Microglia Gone Rogue: Impacts on Psychiatric Disorders across the Lifespan. Front Mol Neurosci, 10, 421. doi: 10.3389/fnmol.2017.00421 [DOI] [PMC free article] [PubMed] [Google Scholar]
- Thaler JP, Yi CX, Schur EA, Guyenet SJ, Hwang BH, Dietrich MO, … Schwartz MW (2012). Obesity is associated with hypothalamic injury in rodents and humans. J Clin Invest, 122(1), 153–162. doi: 10.1172/JCI59660 [DOI] [PMC free article] [PubMed] [Google Scholar]
- Tran DM, & Westbrook RF (2017). A high-fat high-sugar diet-induced impairment in place- recognition memory is reversible and training-dependent. Appetite, 110, 61–71. doi: 10.1016/j.appet.2016.12.010 [DOI] [PubMed] [Google Scholar]
- Tremblay ME, Lowery RL, & Majewska AK (2010). Microglial interactions with synapses are modulated by visual experience. PLoS Biol, 8(11), e1000527. doi: 10.1371/journal.pbio.1000527 [DOI] [PMC free article] [PubMed] [Google Scholar]
- Tynan RJ, Naicker S, Hinwood M, Nalivaiko E, Buller KM, Pow DV, … Walker FR (2010). Chronic stress alters the density and morphology of microglia in a subset of stress-responsive brain regions. Brain Behav Immun, 24(7), 1058–1068. doi: 10.1016/j.bbi.2010.02.001 [DOI] [PubMed] [Google Scholar]
- von Bernhardi R, Tichauer JE, & Eugenin J (2010). Aging-dependent changes of microglial cells and their relevance for neurodegenerative disorders. J Neurochem, 112(5), 1099–1114. doi: 10.1111/j.1471-4159.2009.06537.x [DOI] [PubMed] [Google Scholar]
- Wahlstrom KL, Huff ML, Emmons EB, Freeman JH, Narayanan NS, McIntyre CK, & LaLumiere RT (2018). Basolateral Amygdala Inputs to the Medial Entorhinal Cortex Selectively Modulate the Consolidation of Spatial and Contextual Learning. J Neurosci, 38(11), 2698–2712. doi: 10.1523/JNEUROSCI.2848-17.2018 [DOI] [PMC free article] [PubMed] [Google Scholar]
- Wake H, Moorhouse AJ, Jinno S, Kohsaka S, & Nabekura J (2009). Resting microglia directly monitor the functional state of synapses in vivo and determine the fate of ischemic terminals. J Neurosci, 29(13), 3974–3980. doi: 10.1523/JNEUROSCI.4363-08.2009 [DOI] [PMC free article] [PubMed] [Google Scholar]
- Wang D, & Mitchell ES (2016). Cognition and Synaptic-Plasticity Related Changes in Aged Rats Supplemented with 8- and 10-Carbon Medium Chain Triglycerides. PLoS One, 11(8), e0160159. doi: 10.1371/journal.pone.0160159 [DOI] [PMC free article] [PubMed] [Google Scholar]
- Williams LM (2012). Hypothalamic dysfunction in obesity. Proc Nutr Soc, 71(4), 521–533. doi: 10.1017/S002966511200078X [DOI] [PubMed] [Google Scholar]
- Zanchi D, Giannakopoulos P, Borgwardt S, Rodriguez C, & Haller S (2017). Hippocampal and Amygdala Gray Matter Loss in Elderly Controls with Subtle Cognitive Decline. Front Aging Neurosci, 9, 50. doi: 10.3389/fnagi.2017.00050 [DOI] [PMC free article] [PubMed] [Google Scholar]
Associated Data
This section collects any data citations, data availability statements, or supplementary materials included in this article.