

Abstract
Objective
Identify metabolic changes produced by dimethyl fumarate (DMF) treatment and link them to immunological effects.
Methods
We enrolled 18 MS patients and obtained blood prior to DMF and 6 months postinitiation. We also enrolled 18 healthy controls for comparison. We performed global metabolomics on plasma and used weighted correlation network analysis (WGCNA) to identify modules of correlated metabolites. We identified modules that changed with treatment, followed by targeted metabolomics to corroborate changes identified in global analyses. We correlated changes in metabolite modules and individual metabolites with changes in immunological parameters.
Results
We identified alterations in lipid metabolism after DMF treatment – increases in two modules (phospholipids, lysophospholipids and plasmalogens) and reduction in one module (saturated and poly‐unsaturated fatty acids) eigen‐metabolite values (all P < 0.05). Change in the fatty acid module was greater in participants who developed lymphopenia and was strongly associated with both reduction in absolute lymphocyte counts (r = 0.65; P = 0.005) and change in CD8+ T cell subsets. We also noted significant correlation of change in lymphocyte counts with multiple fatty acid levels (measured by targeted or untargeted methods).
Interpretation
This study demonstrates that DMF treatment alters lipid metabolism and that changes in fatty acid levels are related to DMF‐induced immunological changes.
Introduction
Dimethyl fumarate (DMF) is commonly used to treat relapsing remitting multiple sclerosis (RRMS).1 The action of DMF on the Nrf2 pathway and resultant activation of antioxidant mechanisms has been well described, and DMF thus may have neuroprotective properties.2 However, this mechanism does not explain the profound immune effects of DMF in RRMS.3 The activity of DMF and its metabolites at the hydroxycarboxylic acid‐2 (HCA2) receptor has been proposed as an alternative mechanism of action since mice lacking the HCA2 receptor demonstrate resistance to the immunological effects of DMF.4 Additional proposed mechanisms include modification of reactive cysteine residues in various molecules involved in immunological function, including GAPDH, which can modify immune cell metabolism.5, 6
DMF has several adverse effects, with lymphopenia being the most concerning because it increases the risk for serious infections such as progressive multifocal leukoencephalopathy (PML).7, 8, 9 Recent studies suggest that changes in immune cell subsets may help predict treatment response to DMF in MS patients.10, 11 Understanding the immune effects of DMF and the mechanism by which it causes lymphopenia and alterations in immune cell subsets could help improve the safety of this medication.
Metabolomics is a technique that measures the levels of hundreds of small molecules in biological matrices.12 It provides information that is downstream of other “omics” techniques, such as genomics and proteomics, and has the potential to aid in personalizing the care of MS patients. Since DMF is ultimately metabolized to fumarate, we hypothesized that metabolomics would enable us to identify metabolic alterations produced by DMF and provide insights into its mechanism of action.
In this study, we applied an untargeted global metabolomics approach to evaluate effects of DMF treatment on plasma metabolites and subsequently identify how these changes correlate with changes in immune parameters. Finally, we performed targeted analyses to measure levels of a subset of metabolites identified to be altered by DMF using the global metabolomics approach and confirmed their relationship with immunological changes.
Methods
Participants, consents, and regulatory approvals
Patients with RRMS initiating treatment with DMF were recruited from the Johns Hopkins MS Center. Age‐ (±5 years), race‐, and sex‐matched healthy controls were also recruited. There was no specified washout period for the participants. Two of the participants had received steroids in the 30 days prior to enrollment. The protocol for this study was approved by the Johns Hopkins Institutional Review Board. All participants provided informed consent and attended study visits at baseline and 6 months. Demographic details and data on disease characteristics were collected at each visit. Participants underwent phlebotomy at each visit to obtain plasma and peripheral blood mononuclear cells (PBMCs). We also obtained clinical laboratory testing to monitor adverse effects of treatment, including complete blood count, differential counts, and a comprehensive metabolic panel at baseline and 6 months post‐DMF initiation.
Global untargeted metabolomics analysis
At the end of the study, stored plasma samples from baseline and end‐of‐study visits were subjected to metabolomics analysis at Metabolon Inc. (Durham, NC). Detailed methods have been previously published.13 Briefly, samples were thawed and sample preparation was performed as previously described. The derivatized samples were then subjected to gas chromatography followed by mass spectrometry, or liquid chromatography followed by tandem mass spectrometry. Mass spectra obtained were then matched to a library of standards to identify compounds and the area under the curve for the mass spectra was used to calculate the relative abundance of 660 identified metabolites.
Targeted metabolomics analysis
Detailed methods are included in the Data S1. In brief, samples were extracted with chloroform/methanol, and the organic layer was isolated and subjected to solid phase extraction. Fatty acids were then eluted with chloroform. The eluate was reconstituted in a resuspension solvent containing internal standard (heptadecanoic acid) and used for LC‐MS/MS analysis. A concentrated stock solution was prepared containing five fatty acids: palmitic acid, stearic acid, arachidic acid, behenic acid, and lignoceric acid (250 μg/mL each). Serial dilutions of the stock solution were used to prepare the samples for the calibration curve with concentrations ranging from 10 μg/mL to 0.3125 μg/mL. Data were acquired and analyzed using Analyst version 1.5.1 (Applied Biosystems).
Immunological analysis
PBMCs from both visits were thawed and washed in c‐RPMI medium. They were stained with antibodies for the following antigens – CD3, CD4, CD8, CD45RO, and CCR7 and acquired on a MACS Quant flow‐cytometer (Miltenyi Biotec) as previously described.14 We identified CD4+ and CD8+ T cells and within these we identified memory subsets including effector memory (TEM: CCR7‐ CD45RO+), central memory (TCM: CCR7+ CD45RO+), and naïve cells (Tnaive: CCR7+ CD45RO‐).
Predicted metabolite‐protein interaction network
The Human Metabolome Database (HMDB, www.hmdb.ca) is a freely available electronic resource that contains detailed information (e.g., chemical properties, size, function, associated pathways, etc.) about 114,100 metabolites found in the human body and similar information on 5702 protein sequences which are linked with metabolite entries.15, 16, 17 Protein‐metabolite links are derived from a variety of sources including manual annotation, PubMed, Uniprot, KEGG, or MetaCyc databases. For this study, we used information provided by HMDB to map metabolites to their associated proteins to evaluate descriptively potential interactions between metabolites through previously identified links with common proteins. We also performed descriptive analyses to evaluate if relevant metabolites are enriched in association with proteins with similar functions.
Statistical analysis
Metabolite concentrations obtained from untargeted metabolomics analysis were preprocessed by removal of metabolites with > 50% missing values, imputation using k‐nearest neighbors, normalization (log‐transformation), and standardization. Because our study sample size was relatively small in relation to the number of metabolites, we performed analyses using a weighted gene correlation network analysis (WGCNA), an agnostic approach to identify related metabolite modules.18 Briefly, the WGCNA procedure identifies modules by constructing a correlation network of metabolites, creating a cluster tree, and defining modules as branches. We chose the soft threshold power using the estimated scale‐free topology index and derived nonoverlapping sets of metabolites (metabolic modules).13 These were used to test for a differential association between each module and specific outcome considered.
Initial analyses compared metabolic modules (as the dependent variable) between MS patients and controls using linear regression models adjusted for age and gender. Our primary analyses evaluated the effects of DMF treatment on changes in metabolic modules using generalized estimating equation (GEE) models adjusted for age and sex. Models were not adjusted for race since the cohort was almost entirely Caucasian. Secondary analyses considered each individual metabolite (as the dependent variable) using similarly adjusted GEE models.
We also compared change in the identified metabolic modules as well as individual metabolites with treatment, stratified by development of lymphopenia (absolute lymphocyte count <lower limit of normal (1000 cells/mm3)). We also correlated the change in eigen‐metabolite value of modules or individual fatty acid metabolites with changes in immunological parameters (absolute lymphocyte count and various CD8+ T cell memory subsets) using a Pearson's correlation coefficient.
For the targeted metabolomics data, we compared change in individual fatty acid levels before and after DMF treatment, stratified by development of lymphopenia. We also correlated the change in individual fatty acid measures from targeted metabolomics analyses with changes in immunological parameters mentioned above using a Pearson's correlation coefficient. A P value less than 0.05 was considered significant.
In further analyses among the metabolite module which changed significantly as a result of DMF treatment and was associated with immunological changes, we identified hub‐metabolites with high intramodular importance (e.g., metabolites which are likely to be biologically relevant). We defined metabolite intramodular importance metrics as the correlation between individual metabolites and the relevant given metabolic module score. For these metabolites, we created descriptive metabolite‐protein interaction networks, where we mapped metabolites in significant modules to corresponding associated proteins using information from HMDB. We then evaluated descriptively if metabolites in this module are enriched in associations with proteins with similar functions.
Results
The two groups (MS and healthy control) were well matched for age, sex, and race (Table 1). We detected 660 metabolites in the plasma of participants, of which 576 metabolites passed quality control measures. One hundred and thirty‐one metabolites changed in the MS group following DMF treatment (P < 0.05 in GEE models). While fumarate levels were significantly elevated in the MS group following DMF treatment (Fig. 1A), other tricarboxylic acid (TCA) cycle intermediates did not change during the course of the study.
Table 1.
Demographic characteristics of study population
| Healthy controls (n = 18) | Multiple sclerosis (n = 18) | |
|---|---|---|
| Age (years), mean(SD) | 43.9 (10.8) | 41.3 (10.0) |
| Female sex, n(%) | 13 (72.2) | 13 (72.2) |
| Race | ||
| Caucasian | 16 | 16 |
| African American | 2 | 2 |
| Disease duration (years), mean(SD) | – | 9.8 (6.2) |
| EDSS, median (IQR) | – | 2 (1.5) |
| Previous treatment | ||
| None | – | 6 |
| Glatiramer | – | 5 |
| Interferon beta | – | 5 |
| Natalizumab | – | 2 |
| Lymphopenia | ||
| None | – | 10 |
| Grade 1 | – | 2 |
| Grade 2 | – | 5 |
| Grade 3 | – | 1 |
Figure 1.
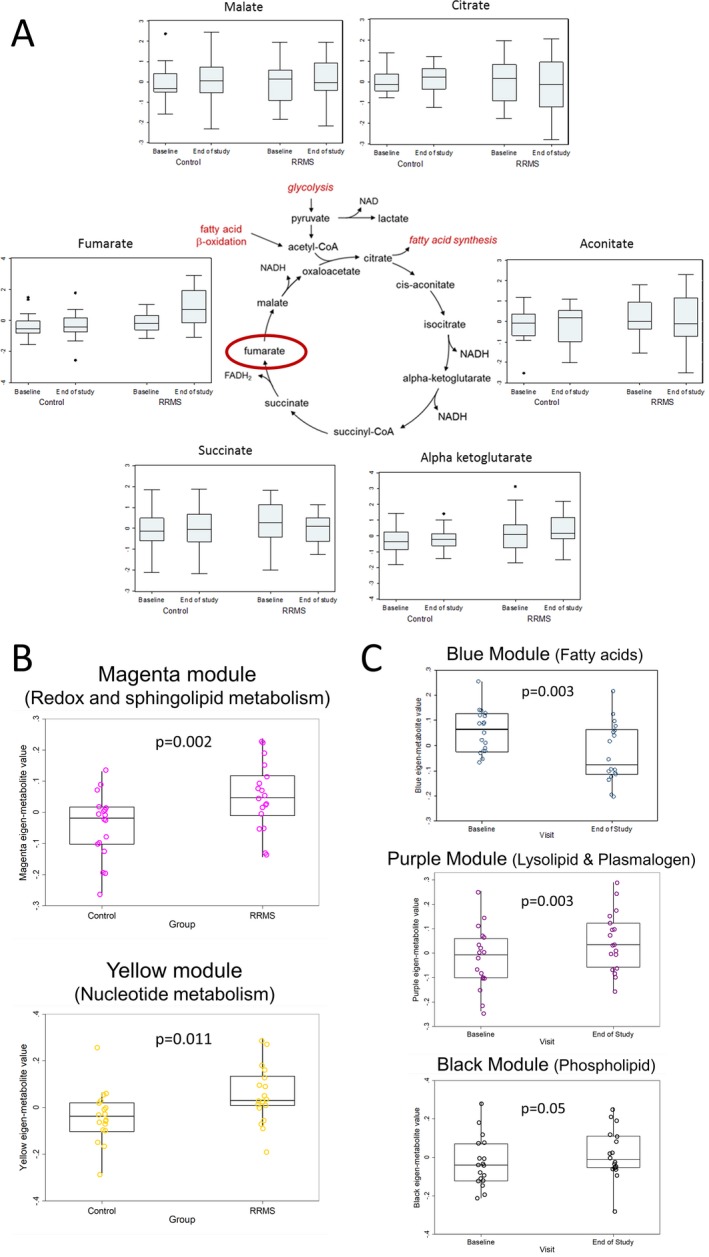
Dimethyl fumarate treatment alters the metabolome of RRMS patients. (A) depicts the change in various tricarboxylic acid cycle metabolites from baseline to the end of the study in both the RRMS and healthy controls groups. (B) includes box plots of eigen‐metabolite values of metabolic modules that differed at baseline between RRMS and healthy control groups. The modules were compared between groups using linear regression and models were adjusted for age and sex. The contents of these modules are listed in Table 2 and Table S1. (C) includes box plots of eigen‐metabolite values of metabolite modules that changed significantly in the RRMS group with DMF treatment. Comparisons were made using generalized estimating equation models. The contents of these modules are listed in Table 3 and Table S2.
Metabolomic profiles differ between multiple sclerosis patients and healthy controls at baseline
Fifty‐eight metabolites differed at baseline between the two groups (P < 0.05). In the WGCNA analysis, two modules (magenta and yellow) differed between the groups at baseline (Fig. 1B). The contents of these modules are listed in Table 2, along with the module membership scores (measure of correlation between an individual metabolite and the eigen‐metabolite) and the results of t‐tests for difference in metabolite concentrations between the two groups (adjusted for age and sex). The magenta module contained metabolites primarily linked to sphingolipid metabolism and redox homeostasis (Table 2, Table S1), while the yellow module contained metabolites that were primarily linked to nucleotide metabolism (Table 2, Table S1). Several of the metabolites identified as having a high module membership (MM) score within these modules also had highly significant P‐values in univariate comparisons of individual metabolites (e.g., sphingosine‐1‐phosphate) as seen in Table 2.
Table 2.
Metabolite modules that differ between healthy controls and MS patients at baseline
| Module | Metabolite | MMa Score | Comparisons of adjusted metabolite level (HC vs. RRMS) | ||
|---|---|---|---|---|---|
| Mean difference | 95% CI | P‐value for differenceb | |||
| Magenta | Glutathione metabolism | ||||
| 5‐oxoproline | 0.90 | −0.65 | −1.26, −0.03 | 0.039 | |
| cysteinyl glycine – oxidized | 0.65 | −0.29 | −0.93, 0.34 | 0.35 | |
| cysteinyl glycine | 0.64 | −0.51 | −1.14, 0.12 | 0.11 | |
| Sphingolipid metabolism | |||||
| sphingosine‐1‐phosphate | 0.88 | −1.0 | −1.61, −0.49 | 6.14 × 10⁻⁴ | |
| sphinganine‐1‐phosphate | 0.74 | −1.32 | −1.81, −0.82 | 7.22 × 10⁻⁶ | |
| sphingosine | 0.70 | −1.2 | −1.72, −0.66 | 7.22 × 10⁻⁵ | |
| Urea cycle | |||||
| ornithine | 0.72 | −0.58 | −1.18, 0.02 | 0.06 | |
| thyroxine | 0.69 | −0.58 | −1.22, 0.083 | 0.08 | |
| Glycolysis | |||||
| pyruvate | 0.85 | −0.58 | −1.22, 0.06 | 0.07 | |
| lactate | 0.83 | −0.70 | −1.32, −0.08 | 0.027 | |
| Yellow | Nucleotide metabolism | ||||
| N1‐methylinosine | 0.85 | −0.91 | −1.51, −0.3 | 0.004 | |
| N6‐carbamoylthreonyladenosine | 0.85 | −0.98 | −1.58, −0.39 | 0.002 | |
| N2,N2 dimethylguanosine | 0.82 | −0.86 | −1.47, −0.26 | 0.006 | |
| N1‐methyladenosine | 0.79 | −0.59 | −1.24, 0.06 | 0.07 | |
| Xanthine | 0.65 | −0.57 | −1.22, 0.08 | 0.08 | |
| hypoxanthine | 0.59 | −0.34 | −1.02, 0.33 | 0.30 | |
| pseudouridine | 0.77 | −0.80 | −1.41, −0.18 | 0.01 | |
| orotidine | 0.74 | −0.65 | −1.29, −0.01 | 0.045 | |
| N4‐acetylcytidine | 0.62 | −0.65 | −1.28, −0.03 | 0.04 | |
| 5,6 dihydrothymine | 0.58 | −0.48 | −1.12, 0.17 | 0.14 | |
| Methionine & cysteine metabolism | |||||
| N‐formylmethionine | 0.72 | −0.30 | −0.98, 0.38 | 0.37 | |
| N‐acetylmethionine | 0.60 | −0.69 | −1.29, 0.09 | 0.025 | |
| Tryptophan metabolism | |||||
| C‐glycosyl tryptophan | 0.84 | −0.76 | −1.38, −0.14 | 0.017 | |
| kynurenine | 0.72 | −0.34 | −1.01, 0.33 | 0.3 | |
| Alanine metabolism | |||||
| N‐acetylalanine | 0.87 | −0.69 | −1.31, −0.07 | 0.03 | |
| Glutamate metabolism | |||||
| gamma‐glutamyl glutamate | 0.61 | −0.17 | −0.84, 0.51 | 0.62 | |
| Amino sugar metabolism | |||||
| N‐acetylglucosaminyl asparagine | 0.58 | −0.93 | −1.52, −0.34 | 0.003 | |
| Serine & threonine metabolism | |||||
| N‐acetylserine | 0.71 | −0.65 | −1.27, −0.03 | 0.04 | |
| N‐acetylthreonine | 0.64 | −0.41 | −1.07, 0.25 | 0.21 | |
| Fatty acid | |||||
| 2 aminoheptanoate | 0.62 | −0.03 | −0.71, 0.65 | 0.93 | |
MM (module‐membership). We defined module membership scores as the correlation of individual metabolites with eigen‐metabolite for the “Magenta” module as a metric to define “hub” metabolites. Metabolites displayed have >median among total metabolite module scores. Complete list of metabolites in Table S1.
The P‐value is derived from unpaired two‐tailed t‐tests using metabolite concentrations adjusted for age and sex.
DMF treatment produced alterations in lipid metabolism in MS patients
We then examined the metabolite modules that were significantly altered by DMF treatment in the MS group. Three modules were altered by DMF treatment – blue (P = 0.003), purple (P = 0.003), and black (P = 0.05) (Fig. 1C). The blue module eigen‐metabolite value decreased with DMF treatment; this module consisted of multiple fatty acids – both saturated and poly‐unsaturated (Table 3, Table S2). The purple module eigen‐metabolite value increased with DMF treatment; this module consisted of multiple lysolipids and plasmalogens (Table 3, Table S2). The black module consisted of several phospholipids, and the eigen‐metabolite values for this module also increased with DMF treatment (Table 3, Table S2). Thus, all modules altered by DMF treatment predominantly contained metabolites linked to lipid metabolism. Again, as in the baseline comparison, the metabolites with higher MM scores within a module appeared to have highly significant P‐values for individual metabolite GEE models.
Table 3.
Metabolite modules and metabolites (with high module membership score) that changed with DMF treatment
| Module | Metabolite | MMa Score | Individual metabolite model results for change with DMF treatment | |
|---|---|---|---|---|
| GEE estimate (95% CI) | P‐value for differenceb | |||
| Blue | 10‐nonadecenoate | 0.96 | −0.66 (−1.27, −0.04) | 0.03 |
| dihomo‐linoleate | 0.96 | −0.75 (−1.34, −0.13) | 0.018 | |
| oleate | 0.94 | −0.75 (−1.38, −0.13) | 0.018 | |
| eicosenoate | 0.94 | −0.64 (−1.22, −0.06) | 0.03 | |
| palmitate | 0.94 | −0.64 (−1.31, 0.03) | 0.06 | |
| 10‐ heptadecenoate | 0.94 | −0.55 (−1.18, 0.07) | 0.08 | |
| palmitoleate | 0.93 | −0.62 (−1.22, −0.01) | 0.04 | |
| docosadienoate | 0.92 | −0.71 (−1.29, −0.13) | 0.016 | |
| linoleate | 0.91 | −0.74 (−1.36, −0.11) | 0.02 | |
| myristate | 0.91 | −0.44 (−1.11, 0.23) | 0.19 | |
| margarate | 0.90 | −0.61 (−1.25, 0.03) | 0.06 | |
| adrenate | 0.89 | −0.74 (−1.39, −0.09) | 0.02 | |
| linolenate | 0.89 | −0.65 (−1.28, −0.02) | 0.04 | |
| docosapentaenoate | 0.87 | −0.78 (−1.29, −0.27) | 0.003 | |
| dihomo‐linoleate | 0.86 | −0.61 (−1.26, 0.05) | 0.07 | |
| Purple | 1‐stearoyl GPC | 0.85 | 0.56 (0.34, 0.78) | 7.33 × 10⁻⁷ |
| 1‐oleoyl GPC | 0.84 | 0.67 (0.45, 0.90) | 4.00 × 10⁻⁹ | |
| 1,1‐enyl‐stearoyl GPE | 0.80 | 0.07 (−0.38, 0.52) | 0.76 | |
| 1‐arachidonyl GPC | 0.80 | 0.38 (0.06, 0.69) | 0.02 | |
| 1‐linoleoyl GPC | 0.79 | 0.48 (0.10, 0.87) | 0.01 | |
| 1,1‐enyl‐palmitoyl GPC | 0.77 | 0.49 (0.18, 0.80) | 0.002 | |
| 1‐palmitoyl GPC | 0.75 | 0.55 (0.29, 0.81) | 2.91 × 10⁻⁵ | |
| 1,1‐enyl‐palmitoyl GPE | 0.75 | 0.15 (−0.31, 0.60) | 0.52 | |
| 1,1‐enyl‐oleoyl GPE | 0.74 | 0.23 (−0.24, 0.69) | 0.34 | |
| Black | 1‐palmitoyl‐2‐oleolyl GPE | 0.88 | 0.17 (−0.10, 0.44) | 0.21 |
| 1‐palmitoyl‐2‐arachidonyl GPE | 0.85 | 0.07 (−0.26, 0.40) | 0.67 | |
| 1‐palmitoyl‐2‐linoleoyl GPE | 0.84 | 0.06 (−0.25, 0.39) | 0.69 | |
| 1‐palmitoyl GPE | 0.84 | 0.33 (0.08, 0.58) | 0.009 | |
| 1‐stearoyl‐2‐linoleoyl GPE | 0.82 | 0.28 (−0.11, 0.67) | 0.16 | |
| 1‐stearoyl‐2‐oleoyl GPE | 0.82 | 0.48 (0.11, 0.85) | 0.01 | |
| 1‐palmitoyl‐2‐oleoyl GPC | 0.78 | 0.39 (0.05, 0.72) | 0.02 | |
| 1‐stearoyl GPE | 0.78 | 0.24 (−0.03, 0.52) | 0.08 | |
| 1‐stearoyl‐2‐arachidonoyl GPE | 0.77 | 0.02 (−0.39, 0.44) | 0.92 | |
| 1‐palmitoyl‐2‐oleoyl GPI | 0.74 | 0.52 (0.25, 0.80) | 0.0002 | |
| retinol | 0.68 | 0.50 (0.16, 0.85) | 0.004 | |
| 1‐stearoyl‐2‐oleoyl GPI | 0.67 | 0.49 (0.18, 0.80) | 0.002 | |
| 1‐palmitoyl‐2‐palmitoleoyl GPC | 0.67 | 0.46 (0.10, 0.82) | 0.01 | |
| 1‐palmitoyl‐2‐linoleoyl GPC | 0.66 | −0.03 (−0.29, 0.24) | 0.83 | |
| 1‐stearoyl‐2‐oleoyl GPC | 0.64 | 0.63 (0.28, 0.97) | 0.0004 | |
MM (module‐membership). We defined module membership scores as the correlation of individual metabolites with eigen‐metabolite for the “Blue” module as a metric to define “hub” metabolites. Metabolites displayed have high module membership scores (top 15 shown for Blue and Black modules and top 9 for Purple module). Complete list of metabolites in Table S2.
The P‐value is derived from individual GEE metabolite models.
We also examined the change in these three metabolite modules in the healthy control group. The fatty acid (blue) and phospholipid (black) modules did not change in the control group over the course of the study. The lysolipid and plasmalogen (purple) module changed significantly in the control group but in the opposite direction compared to the MS group, with a reduction over the 6 months of the study (Figure S1). The reason for this change could relate to the inherent variability in the levels of these metabolites and be related to short‐term dietary factors or other physiological factors – such as aging.19, 20
Changes in the fatty acid metabolite module and individual fatty acid levels with DMF treatment correlated with change in immunological parameters in MS patients
We then assessed whether the changes in modules that were altered with DMF treatment were associated with immunological changes produced by DMF. We first examined the relationship of the three modules with change in absolute lymphocyte counts. As previously published, there was a significant reduction in absolute lymphocyte counts with DMF treatment in this cohort.21 We noted a significant reduction in the fatty acid module eigen‐metabolite values only in those MS patients who developed lymphopenia over the course of the study (Fig. 2A). There was also a strong correlation between reduction in fatty acid module eigen‐metabolite value with reduction in absolute lymphocyte counts (r = 0.65, P = 0.005) (Fig. 2B). The change in the other two modules did not correlate with change in absolute lymphocyte counts.
Figure 2.
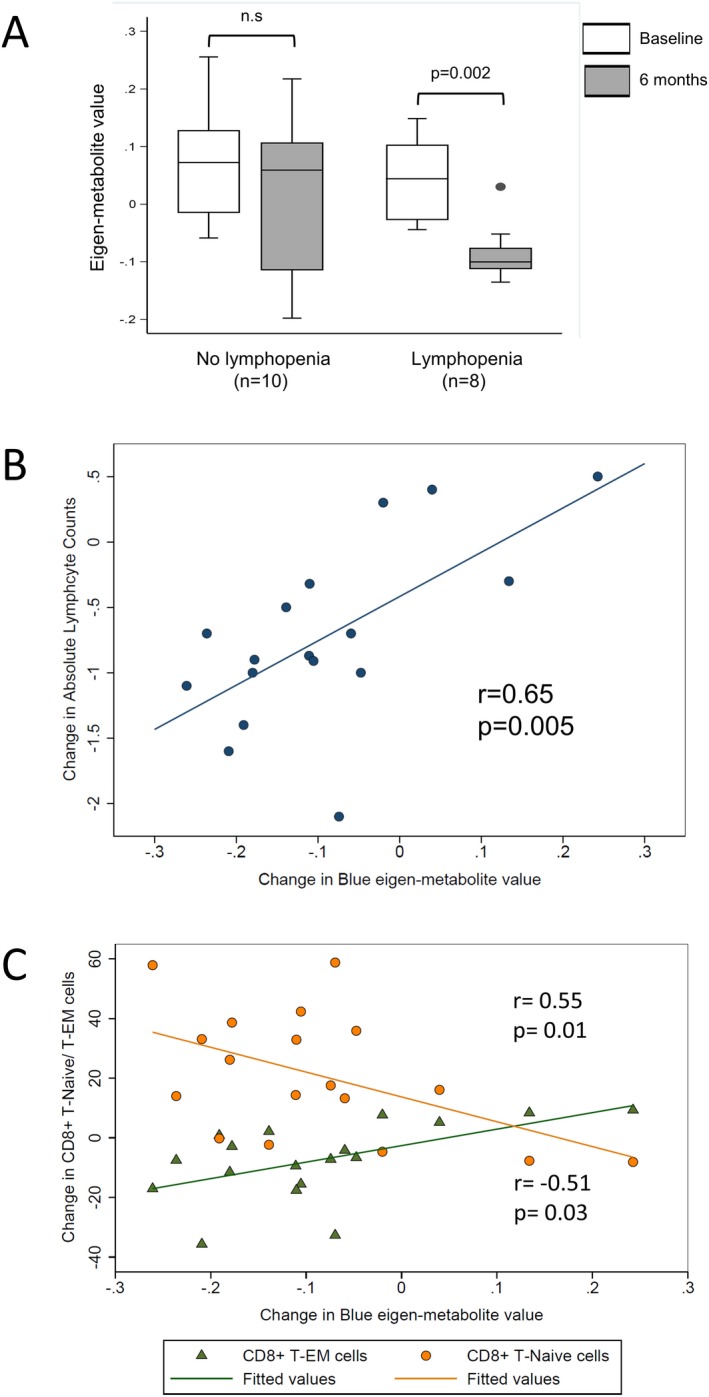
Metabolic changes induced by dimethyl fumarate treatment are related to changes in absolute lymphocyte counts and CD8+ T cell subsets. (A) depicts the change in the fatty acid module over the course of the study stratified by development of lymphopenia. The two groups were compared using a paired t‐test. A significant change was noted only in the RRMS patients who developed lymphopenia with DMF treatment. (B) depicts the correlation between the change in absolute lymphocyte counts and the change in fatty acid module eigen‐metabolite values in patients with RRMS over the course of the study. (C) depicts the correlation between the change in the fatty acid metabolite module and the changes in proportion of both the CD8+ effector memory and CD8+ naïve T cells.
We have previously demonstrated that immunophenotyping of PBMCs from these patients revealed an increase in the CD4+:CD8+ ratio with DMF treatment consistent with the preferential targeting of CD8+ T cells by DMF.14 Within the CD8+ T cell compartment, there was a significant reduction in the proportion of CD8+ effector memory T cells and a corresponding increase in CD8+ Naïve T cells with DMF treatment.14 We observed a strong correlation between the change in fatty acid module eigen‐metabolite values and the changes in these immune cell subsets (Fig. 2C). Changes in the other two metabolite modules were not correlated with the change in CD8+ T cell subsets. There was no correlation noted between the change in the fatty acid module and changes observed in CD4+ T cell subsets.
To corroborate the results of our global untargeted metabolomics analysis, we also utilized a targeted metabolomics approach to measure the levels of 20 different saturated and unsaturated fatty acids in plasma obtained at both study time‐points from MS patients in this study. We noted significant reductions in the levels of multiple fatty acids, measured by either untargeted or targeted methods, only in patients who developed lymphopenia (Fig. 3A and B). We also noted strong correlations in the change in various individual fatty acid levels (using either targeted or untargeted methods) and the change in absolute lymphocyte counts (Fig. 3C).
Figure 3.
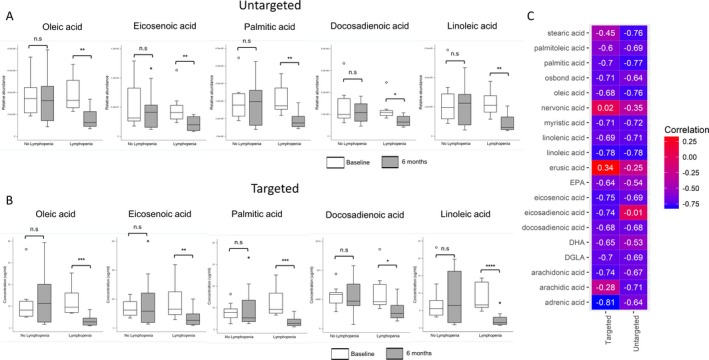
Changes in individual fatty acid levels measured by untargeted or targeted methods correlate with change in absolute lymphocyte counts. (A) shows box plots of various fatty acids (contained in the fatty acid (blue) metabolic module) measured at baseline and 6 months post‐DMF initiation, stratified by development of lymphopenia. (A) contains plots of values derived from the global untargeted metabolomics analysis, while (B) contains similar box plots of fatty acids measured as part of a targeted metabolomics panel to confirm findings noted in the global analysis. There were significant changes in fatty acid levels measured by targeted or untargeted analysis only in the lymphopenic subgroup. Baseline and 6 month values were compared using a paired t‐test. (C) shows a heat‐map of correlations between the change in individual fatty acid levels (targeted/untargeted) and the change in absolute lymphocyte counts. This demonstrates the overall concordance between values derived from the two analytical methods and the high correlation between change in individual fatty acid levels and the change in absolute lymphocyte counts with DMF treatment.
Protein‐metabolite interaction analysis using metabolite modules altered by DMF treatment
We performed protein‐metabolite interaction analyses to identify protein networks associated with metabolites in the fatty acid module which were altered with DMF treatment and associated with immunological changes. As expected, proteins which interact with metabolites in this module are involved in lipid transport, monooxygenase activity, and phospholipase A2 activity (Fig. 4). Of relevance, phospholipase A2 is downstream of the HCA2 receptor.
Figure 4.
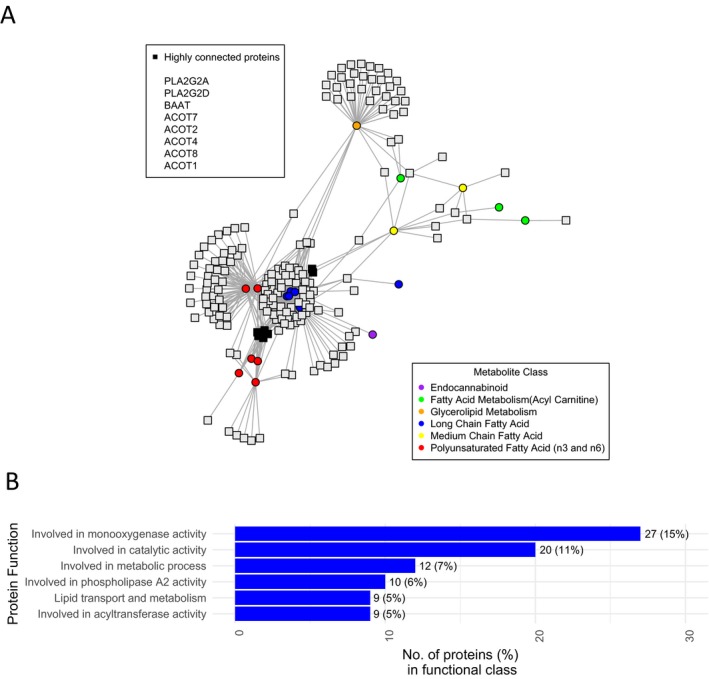
Protein‐metabolite interactions of metabolites altered by DMF treatment. (A) depicts the protein‐metabolite interactions of metabolites in the blue (fatty acid) module and (B) lists the functional classes of the identified proteins.
Discussion
In this study, we utilized a combination of global untargeted and targeted metabolomics approaches in the setting of DMF therapy initiation to demonstrate significant effects of DMF on lipid metabolism in MS patients. We also demonstrate that changes in fatty acid levels primarily occur in patients developing lymphopenia and correlate with immunological changes produced by DMF (reductions in absolute lymphocyte count and specific CD8+ T cell subsets).
At baseline, two metabolite modules differed between RRMS patients and controls. The first contained sphingolipid metabolites and markers related to oxidative stress. These results are consistent with multiple previous studies that demonstrated altered redox homeostasis and elevated markers of oxidative stress in the blood and CNS tissue of MS patients.13, 22, 23, 24 Further, sphingolipid metabolism alterations have been previously demonstrated in MS brain tissue, with studies showing an increase in phospholipid content and a reduction in sphingolipids.25 Sphingosine‐1‐phosphate is an important signaling molecule, and increased expression of sphingosine kinase, the enzyme that produces S1P, is associated with an anti‐inflammatory phenotype in macrophages.26 Additionally, sphingosine‐1‐phosphate receptor modulators are effective treatments for MS.27 The second module contained nucleotide and amino acid metabolites. Several of these metabolites overlap with a study that identified a panel of nine metabolites (that may relate to mitochondrial dysfunction in MS) that were elevated in MS patients.28 These data further demonstrate the ability of metabolomics to identify alterations in metabolic pathways that may be integral to MS disease pathogenesis.
In our primary analysis, DMF treatment increased levels of multiple phospholipids and reduced the levels of several fatty acids using results from the untargeted global metabolomics analysis, changes that were then confirmed using a targeted metabolomics approach. The most likely explanation for the reduction in plasma fatty acid levels by DMF treatment is the activation of the HCA‐2 receptor. Monomethyl fumarate (MMF), a metabolite of DMF, is an HCA‐2 receptor agonist. This receptor is commonly found on adipocytes but is also found on immune cells.29 It is a receptor for the ketone body beta‐hydroxy butyrate, and in adipocytes its activation leads to a reduction in lipolysis through inhibition of activity of the adipose triglyceride lipase (ATGL) and hormone sensitive lipase, resulting in lower free fatty acids levels.30 Previously, a small molecule HCA‐2 agonist led to reductions in the levels of non‐esterified fatty acids, albeit for a limited duration of treatment.31 A study utilizing HCA‐2‐deficient mice also demonstrated that this receptor is important for the immunological effects of DMF in EAE.4
Recent studies on the immunological effects of DMF have demonstrated alterations in several immune cell subpopulations; the most substantive changes have been reductions in CD8+ T cells and especially the T cell memory population.32, 33, 34 Thus, the development of lymphopenia is most closely related to reduction in this subset of lymphocytes. We restricted our initial immuno‐phenotyping to CD8+ T cells and found that in addition to being related to absolute lymphocyte counts, the reduction in the metabolic module containing fatty acids also correlated individually with an increase in naïve CD8+ T cells and a reduction in effector memory CD8+ T cells. Since the development of CD8+ memory T cells is dependent on fatty acid oxidation, the reduction in fatty acid levels could be linked to the selective targeting of this subset of lymphocytes.35 Alternatively, since the reduction in fatty acid levels and lymphocyte counts are highly correlated, they could be mediated by a shared mechanism, such as activation of the HCA2 receptor. Thus, the reduction in fatty acid levels may simply be a marker of HCA2 receptor activation. Studies have described the effects of polymorphisms in the HCA2 receptor on response to ligands such as niacin and this could potentially underlie the variability in the change in fatty acids levels noted in patients in this study.36 Activation of this receptor by other ligands has been linked to T cell apoptosis and to the enhanced generation of regulatory and IL‐10 producing T cells.37, 38 Activation of the HCA2 receptor on adipocytes also leads to decreased production of proinflammatory cytokines and an enhanced production of adiponectin, which can have anti‐inflammatory effects on multiple immune cell subsets.39, 40 Free fatty acids also activate receptors on immune cells and thus, alterations in the fatty acid levels could potentially mediate some immunological effects of DMF.41, 42 Free fatty acid levels in the circulation could also potentially reflect the overall state of lymphocyte activation – based on metabolomics analysis comparing PD1 knockout (KO) to wild‐type mice, greater lymphocyte activation in PD1 KO mice was associated with elevated levels of multiple fatty acids.43 Thus, the reduction in fatty acid levels could reflect reduced numbers and activation of lymphocytes in the circulation.
DMF can lead to the covalent modification of reactive cysteine residues in several molecules, altering their function.6 A recent study demonstrated that several molecules that play pivotal roles in immune cell function, such as protein kinase C‐θ, could be affected by this mechanism and alter immune cell function.6 We demonstrated that modification of the active site cysteine of GAPDH leads to altered aerobic glycolysis and prevents effector function of both myeloid cells and lymphocytes.5 Whether covalent modification of proteins involved in lipid metabolism could lead to the metabolic changes described in our study remains to be clarified. Another plausible explanation for both the reduction in fatty acid levels and the increase in phospholipids includes inhibition of enzymes involved in breakdown of phospholipids leading to the production of free fatty acids and lysolipids. This could result in the alteration of cell membrane lipid content leading to alteration of immune cell function.44
Studies have suggested that reductions in lymphocyte counts, especially in the CD8+ T cell compartment, may be linked to increased effectiveness of DMF treatment.11 Thus, if identification of an early change in fatty acid levels could predict future development of lymphopenia, this may help in identifying patients who are likely to remain stable on this therapy and also those who may require greater vigilance for the development of significant lymphopenia. Longer prospective studies will be required to determine whether an early measurement of the change in levels of plasma fatty acids can predict the long‐term effectiveness of DMF therapy.
Limitations of this study include a small sample size and short duration of follow‐up. We also lacked an early time‐point for metabolomics analysis, which could have helped better define the potential of the change in metabolic markers in predicting future development of lymphopenia and treatment efficacy. A larger, prospective study with a shorter time to assessment of change in fatty acid levels would help to confirm our findings and potentially identify a cut‐off for change in fatty acid levels that would predict development of severe lymphopenia or efficacy of treatment.
In conclusion, this study identifies alteration of lipid metabolism with DMF treatment in MS patients and links these metabolic alterations to changes in immunological parameters such as absolute lymphocyte count. This provides new insights into the mechanism of action of this commonly used medication and identifies potential biomarkers to predict response to DMF therapy.
Author Contributions
PB, EMM, NJH, and PAC contributed to the conception and design of the study. PB, KCF, MDS, SLV, and MK contributed to the acquisition and analysis of the data. PB, KCF, MDS, SLV, MK, EMM, NJH, and PAC contributed to drafting and revising the manuscript.
Conflict of Interest
Dr. Bhargava has nothing to disclose. Dr. Fitzgerald has nothing to disclose. Dr. Venkata has nothing to disclose. Mr. Smith has nothing to disclose. Dr. Kornberg has nothing to disclose. Dr. Mowry reports grants from Biogen, other from Teva Neurosciences, grants from Genzyme, grants from Sun Pharma, personal fees from UpToDate, outside of the submitted work. Dr. Haughey has nothing to disclose. Dr. Calabresi reports grants from Biogen during the conduct of the study, personal fees from Biogen, grants from Novartis, grants from Annexon, grants from MedImmune, grants from Sanofi, personal fees from Disarm, outside the submitted work.
Supporting information
Data S1 – Targeted metabolomics analysis
Figure S1. Change in purple module in healthy controls over the course of the study
Table S1. Metabolite modules and contents that differ between RRMS and HC at baseline
Table S2. Metabolite modules and contents that were altered by DMF treatment
Acknowledgments
This study was funded by an Investigator Initiated Trial (IIT) grant from Biogen to PAC. PB was supported by a John F. Kurtzke Clinician Scientist development award from the AAN, a career transition award from the NMSS, and a junior faculty award from the Race to Erase MS. KCF was supported by a postdoctoral fellowship from the NMSS and from NARCOMS. This study was also supported by a Marilyn Hilton Award for Innovation in MS Research from the Conrad N. Hilton Foundation to PAC.
Funding Information
This study was funded by an Investigator Initiated Trial (IIT) grant from Biogen to PAC. PB was supported by a John F. Kurtzke Clinician Scientist development award from the American Academy of Neurology (AAN), a Career Transition award from the National Multiple Sclerosis Society (NMSS), and a Junior Faculty award from the Race to Erase MS. KCF was supported by a Post‐doctoral fellowship from the NMSS and from NARCOMS. This study was also supported by a Marilyn Hilton Award for Innovation in MS Research from the Conrad N. Hilton Foundation to PAC.
Funding Statement
This work was funded by Race to Erase MS grant ; Biogen grant ; NARCOMS grant ; National Multiple Sclerosis Society grant ; American Academy of Neurology grant .
References
- 1. Oh J, O'Connor PW. Safety, tolerability, and efficacy of oral therapies for relapsing‐remitting multiple sclerosis. CNS Drugs 2013;27:591–609. [DOI] [PubMed] [Google Scholar]
- 2. Linker RA, Lee D‐H, Ryan S, et al. Fumaric acid esters exert neuroprotective effects in neuroinflammation via activation of the Nrf2 antioxidant pathway. Brain 2011;134:678–692. [DOI] [PubMed] [Google Scholar]
- 3. Schulze‐Topphoff U, Varrin‐Doyer M, Pekarek K, et al. Dimethyl fumarate treatment induces adaptive and innate immune modulation independent of Nrf2. Proc Natl Acad Sci U S A 2016;113:4777–4782. [DOI] [PMC free article] [PubMed] [Google Scholar]
- 4. Chen H, Assmann JC, Krenz A, et al. Hydroxycarboxylic acid receptor 2 mediates dimethyl fumarate's protective effect in EAE. J Clin Invest. 2014;124:2188–2192. [DOI] [PMC free article] [PubMed] [Google Scholar]
- 5. Kornberg MD, Bhargava P, Kim PM, et al. Dimethyl fumarate targets GAPDH and aerobic glycolysis to modulate immunity. Science (80‐). American Association for the Advancement of Science 2018;360:449–453:eaan4665. [DOI] [PMC free article] [PubMed] [Google Scholar]
- 6. Blewett MM, Xie J, Zaro BW, et al. Chemical proteomic map of dimethyl fumarate‐sensitive cysteines in primary human T cells. Sci Signal 2016;9:rs10. [DOI] [PMC free article] [PubMed] [Google Scholar]
- 7. Ermis U, Weis J, Schulz JB. PML in a patient treated with fumaric acid. N Engl J Med 2013;368:1657–1658. [DOI] [PubMed] [Google Scholar]
- 8. Nieuwkamp DJ, Murk J‐L, van Oosten BW, et al. PML in a patient without severe lymphocytopenia receiving dimethyl fumarate. N Engl J Med 2015;372:1474–1476. [DOI] [PubMed] [Google Scholar]
- 9. van Oosten BW, Killestein J, Barkhof F, et al. PML in a patient treated with dimethyl fumarate from a compounding pharmacy. N Engl J Med 2013;368:1658–1659. [DOI] [PubMed] [Google Scholar]
- 10. Medina S, Villarrubia N, Sainz de la Maza S, et al. Optimal response to dimethyl fumarate associates in MS with a shift from an inflammatory to a tolerogenic blood cell profile. Mult Scler J 2018;24:1317–13274:135245851771708. [DOI] [PubMed] [Google Scholar]
- 11. Fleischer V, Friedrich M, Rezk A, et al. Treatment response to dimethyl fumarate is characterized by disproportionate CD8+ T cell reduction in MS. Mult Scler J 2018;24:632–641:135245851770379. [DOI] [PubMed] [Google Scholar]
- 12. Bhargava P, Calabresi PA. Metabolomics in multiple sclerosis. Mult Scler 2016;22:451–460. [DOI] [PubMed] [Google Scholar]
- 13. Bhargava P, Fitzgerald KC, Calabresi PA, Mowry EM. Metabolic alterations in multiple sclerosis and the impact of vitamin D supplementation. JCI Insight 2017;2:e95302. [DOI] [PMC free article] [PubMed] [Google Scholar]
- 14. Smith MD, Calabresi PA, Bhargava P. Dimethyl fumarate treatment alters NK cell function in multiple sclerosis. Eur J Immunol 2018;48:380–383. [DOI] [PMC free article] [PubMed] [Google Scholar]
- 15. Wishart DS, Tzur D, Knox C, et al. HMDB: the human metabolome database. Nucleic Acids Res 2007;35:D521–D526. [DOI] [PMC free article] [PubMed] [Google Scholar]
- 16. Wishart DS, Jewison T, Guo AC, et al. HMDB 3.0—The human metabolome database in 2013. Nucleic Acids Res 2012;41:D801–D807. [DOI] [PMC free article] [PubMed] [Google Scholar]
- 17. Wishart DS, Knox C, Guo AC, et al. HMDB: a knowledgebase for the human metabolome. Nucleic Acids Res 2009;37:D603–D610. [DOI] [PMC free article] [PubMed] [Google Scholar]
- 18. Langfelder P, Horvath S. WGCNA: an R package for weighted correlation network analysis. BMC Bioinformatics 2008;9:559. [DOI] [PMC free article] [PubMed] [Google Scholar]
- 19. Nishimukai M, Maeba R, Yamazaki Y, et al. Serum choline plasmalogens, particularly those with oleic acid in sn ‐2, are associated with proatherogenic state. J Lipid Res 2014;55:956–965. [DOI] [PMC free article] [PubMed] [Google Scholar]
- 20. Maeba R, Nishimukai M, Sakasegawa S, et al. Plasma/serum plasmalogens. Adv Clin Chem 2015;70:31–94. [DOI] [PubMed] [Google Scholar]
- 21. Smith MD, Martin KA, Calabresi PA, Bhargava P. Dimethyl fumarate alters B‐cell memory and cytokine production in MS patients. Ann Clin Transl Neurol 2017;4:351–355. [DOI] [PMC free article] [PubMed] [Google Scholar]
- 22. Tasset I, Agüera E, Sánchez‐López F, et al. Peripheral oxidative stress in relapsing–remitting multiple sclerosis. Clin Biochem 2012;45:440–444. [DOI] [PubMed] [Google Scholar]
- 23. Haider L, Simeonidou C, Steinberger G, et al. Multiple sclerosis deep grey matter: the relation between demyelination, neurodegeneration, inflammation and iron. J Neurol Neurosurg Psychiatry 2014;85:1386–1395. [DOI] [PMC free article] [PubMed] [Google Scholar]
- 24. Mahad DH, Trapp BD, Lassmann H. Pathological mechanisms in progressive multiple sclerosis. Lancet Neurol 2015;14:183–193. [DOI] [PubMed] [Google Scholar]
- 25. Wheeler D, Bandaru VVR, Calabresi PA, et al. A defect of sphingolipid metabolism modifies the properties of normal appearing white matter in multiple sclerosis. Brain 2008;131:3092–3102. [DOI] [PMC free article] [PubMed] [Google Scholar]
- 26. Mrad M, Imbert C, Garcia V, et al. Downregulation of sphingosine kinase‐1 induces protective tumor immunity by promoting M1 macrophage response in melanoma. Oncotarget 2016;7:71873–71886. [DOI] [PMC free article] [PubMed] [Google Scholar]
- 27. Kappos L, Radue EW, O'Connor P, et al. A placebo‐controlled trial of oral fingolimod in relapsing multiple sclerosis. N Engl J Med 2010;362:387–401. [DOI] [PubMed] [Google Scholar]
- 28. Lazzarino G, Amorini AM, Petzold A, et al. Serum compounds of energy metabolism impairment are related to disability, disease course and neuroimaging in multiple sclerosis. Mol Neurobiol 2017;54:7520–7533. [DOI] [PubMed] [Google Scholar]
- 29. Feingold KR, Moser A, Shigenaga JK, Grunfeld C. Inflammation stimulates niacin receptor (GPR109A/HCA2) expression in adipose tissue and macrophages. J Lipid Res 2014;55:2501–2508. [DOI] [PMC free article] [PubMed] [Google Scholar]
- 30. Ahmed K. Biological roles and therapeutic potential of hydroxy‐carboxylic Acid receptors. Front Endocrinol (Lausanne) 2011;2:51. [DOI] [PMC free article] [PubMed] [Google Scholar]
- 31. Dobbins R, Byerly R, Gaddy R, et al. GSK256073 acutely regulates NEFA levels via HCA2 agonism but does not achieve durable glycaemic control in type 2 diabetes. A randomised trial. Eur J Pharmacol 2015;755:95–101. [DOI] [PubMed] [Google Scholar]
- 32. Spencer CM, Crabtree‐Hartman EC, Lehmann‐Horn K, et al. Reduction of CD8(+) T lymphocytes in multiple sclerosis patients treated with dimethyl fumarate. Neurol Neuroimmunol Neuroinflamm 2015;2:e76. [DOI] [PMC free article] [PubMed] [Google Scholar]
- 33. Longbrake EE, Ramsbottom MJ, Cantoni C, et al. Dimethyl fumarate selectively reduces memory T cells in multiple sclerosis patients. Mult Scler 2016;22:1061–1070. [DOI] [PMC free article] [PubMed] [Google Scholar]
- 34. Longbrake EE, Naismith RT, Parks BJ, et al. Dimethyl fumarate‐associated lymphopenia: risk factors and clinical significance. Mult Scler J ‐ Exp Transl Clin 2015;1:2055217315596994. [DOI] [PMC free article] [PubMed] [Google Scholar]
- 35. Lochner M, Berod L, Sparwasser T. Fatty acid metabolism in the regulation of T cell function. Trends Immunol 2015;36:81–91. [DOI] [PubMed] [Google Scholar]
- 36. Tuteja S, Wang L, Dunbar RL, et al. Genetic coding variants in the niacin receptor, hydroxyl‐carboxylic acid receptor 2, and response to niacin therapy. Pharmacogenet Genomics 2017;27:285–293. [DOI] [PMC free article] [PubMed] [Google Scholar]
- 37. Singh N, Gurav A, Sivaprakasam S, et al. Activation of Gpr109a, receptor for niacin and the commensal metabolite butyrate, suppresses colonic inflammation and carcinogenesis. Immunity 2014;40:128–139. [DOI] [PMC free article] [PubMed] [Google Scholar]
- 38. Zimmerman MA, Singh N, Martin PM, et al. Butyrate suppresses colonic inflammation through HDAC1‐dependent Fas upregulation and Fas‐mediated apoptosis of T cells. AJP Gastrointest Liver Physiol 2012;302:G1405–G1415. [DOI] [PMC free article] [PubMed] [Google Scholar]
- 39. Shibata S, Tada Y, Hau CS, et al. Adiponectin regulates psoriasiform skin inflammation by suppressing IL‐17 production from γδ‐T cells. Nat Commun 2015;6:7687. [DOI] [PubMed] [Google Scholar]
- 40. Digby JE, McNeill E, Dyar OJ, et al. Anti‐inflammatory effects of nicotinic acid in adipocytes demonstrated by suppression of fractalkine, RANTES, and MCP‐1 and upregulation of adiponectin. Atherosclerosis 2010;209:89–95. [DOI] [PMC free article] [PubMed] [Google Scholar]
- 41. Vieira WA, Sadie‐Van Gijsen H, Ferris WF. Free fatty acid G‐protein coupled receptor signaling in M1 skewed white adipose tissue macrophages. Cell Mol Life Sci 2016;73:3665–3676. [DOI] [PMC free article] [PubMed] [Google Scholar]
- 42. Ringseis R, Eder K, Mooren FC, Krüger K. Metabolic signals and innate immune activation in obesity and exercise. Exerc Immunol Rev 2015;21:58–68. [PubMed] [Google Scholar]
- 43. Miyajima M, Zhang B, Sugiura Y, et al. Metabolic shift induced by systemic activation of T cells in PD‐1‐deficient mice perturbs brain monoamines and emotional behavior. Nat Immunol 2017;18:1342–1352. [DOI] [PubMed] [Google Scholar]
- 44. Chichili GR, Rodgers W. Cytoskeleton–membrane interactions in membrane raft structure. Cell Mol Life Sci 2009;66:2319–2328. [DOI] [PMC free article] [PubMed] [Google Scholar]
Associated Data
This section collects any data citations, data availability statements, or supplementary materials included in this article.
Supplementary Materials
Data S1 – Targeted metabolomics analysis
Figure S1. Change in purple module in healthy controls over the course of the study
Table S1. Metabolite modules and contents that differ between RRMS and HC at baseline
Table S2. Metabolite modules and contents that were altered by DMF treatment