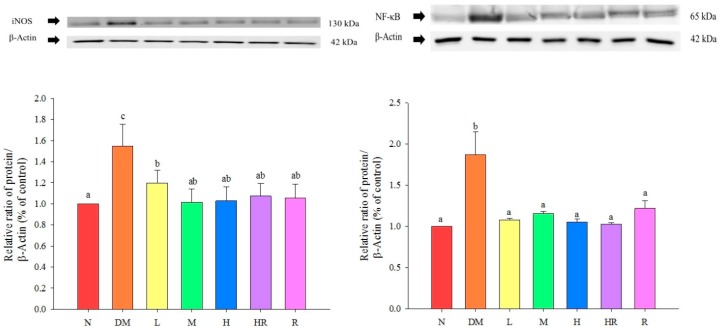
Figure 2.
Influence of red guava on iNOS and NF-κB inflammatory protein expression in mouse livers. The treatments were as follows: normal (N), diabetes mellitus (DM), diabetes + red guava 1% (L), 2% (M), and 5% (H), diabetes + 5% red guava + anti-diabetic rosiglitazone (HR), and diabetes + anti-diabetic rosiglitazone (R). Values are expressed as mean ± SD of each group. The lowercase letters above the bars indicate significant differences (p < 0.05).

