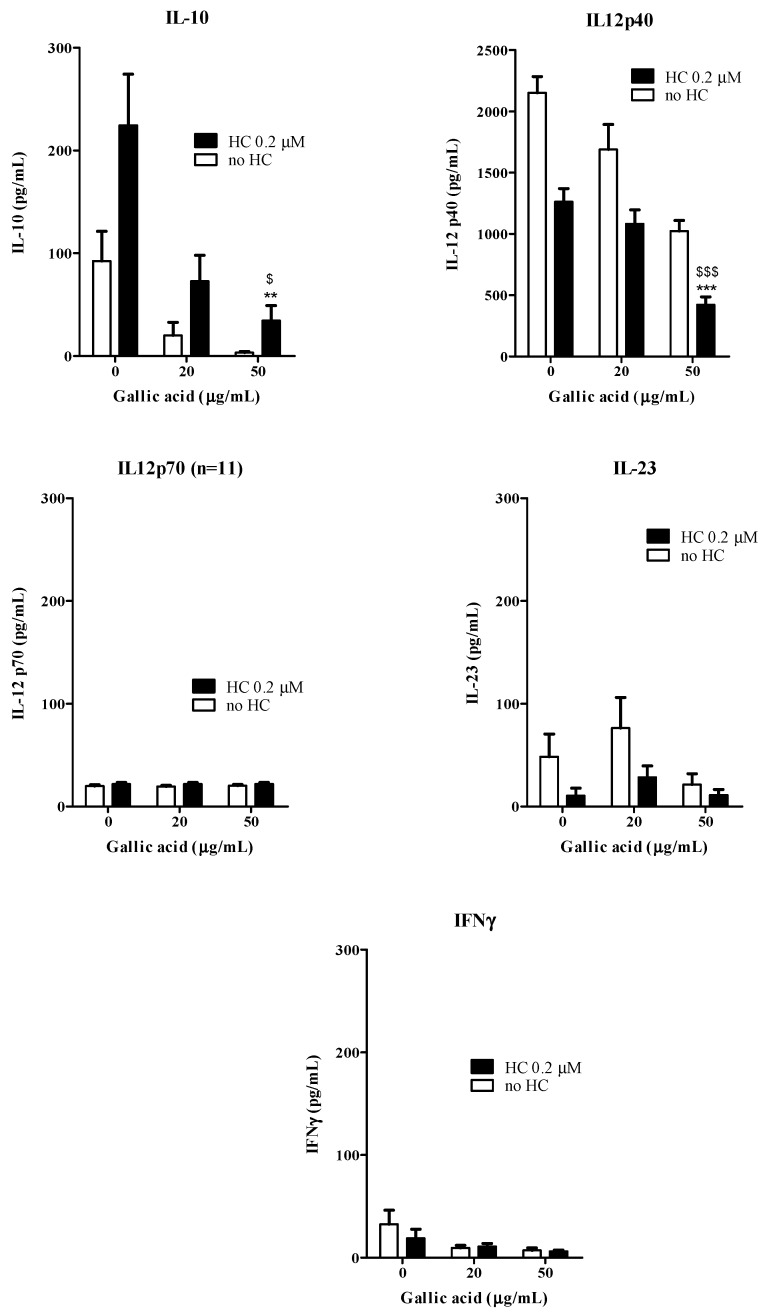
Figure 5.
Combined effects of gallic acid and hydrocortisone on the cytokine production from moDC (n = 10). The open bars represent the cells were added with gallic acid alone (0, 20 and 50 μg/mL) and the solid bars represent the cells added with gallic acid (0, 20 and 50 μg/mL) and hydrocortisone HC (0.2 μM). ** and *** indicate p < 0.01 and p < 0.001, respectively, when compared the control level of the cytokine production or surface marker expression from cells without incubating with DC-inducing cytokine cocktail. $ and $$$ indicate p < 0.05 and p < 0.001, respectively, when compared the control level of the cytokine production or surface marker expression cells with HC and without incubating with DC-inducing cytokine cocktail.

