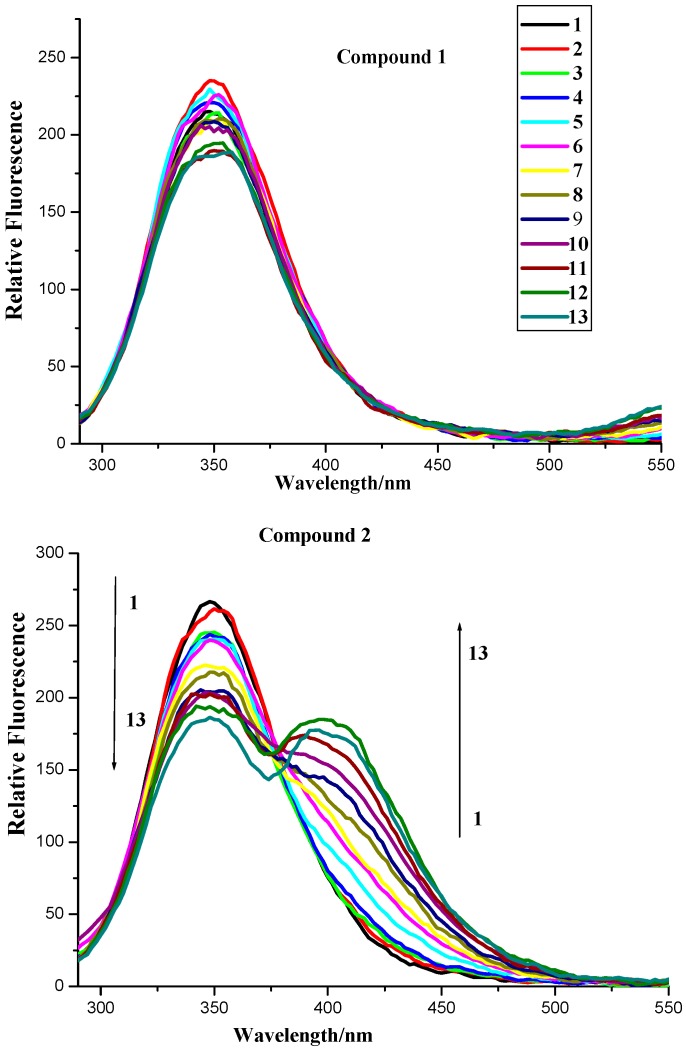
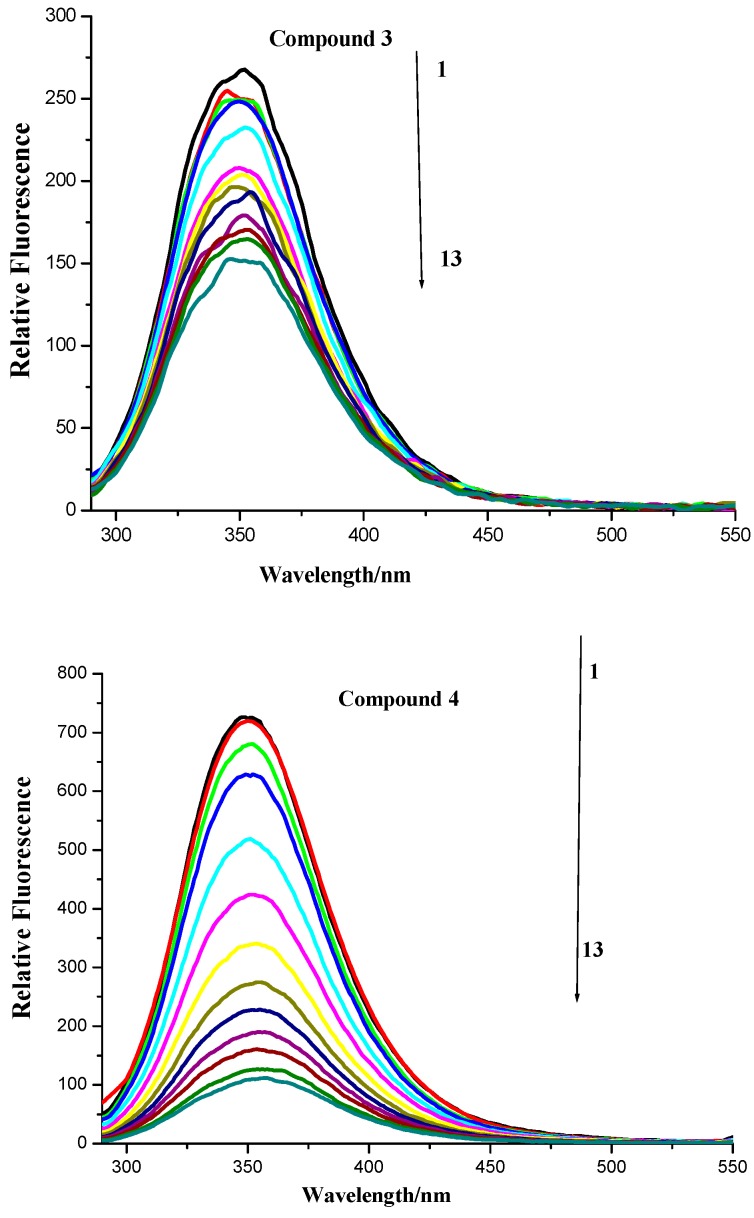
Figure 4.
Fluorescence spectroscopy of compounds 1–4 and BSA. Numbers 1–13 indicated concentrations of compounds 1–4: 0.0, 0.4 ×10⁻⁶, 0.8 × 10⁻⁶, 1.2 × 10⁻⁶, 2.4 × 10⁻⁶, 3.6 × 10⁻⁶, 4.8 × 10⁻⁶, 6.0 × 10⁻⁶, 7.2 × 10⁻⁶, 8.4 × 10⁻⁶, 9.6 × 10⁻⁶, 10.8 × 10⁻⁶ and 12 × 10−6 mol∙L−1, respectively. BSA concentration applied was 1.04 × 10⁻⁶ mol∙L−1. Scan condition: Ex = 280 nm, Em = 290–550 nm; slits of both Ex and Em of compounds 1–3 were 5 nm while those of compound 4 were 5 nm and 10 nm, respectively.


