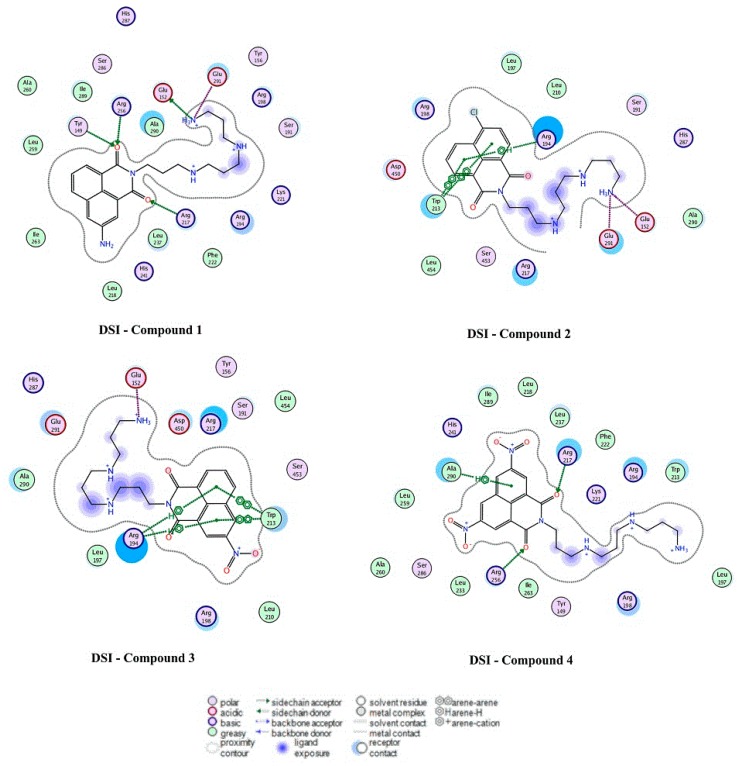
Figure 13.
Docking experiment results showing the 2D diagrams of the binding modes of the complex DSI-compounds 1–4. Polar and non-polar residues were represented in red and green circles, respectively. H-bond acceptors or donors were shown in green-dotted arrows. Electrostatic interactions from ion pairs were presented in red-dotted lines. π-π and π-H interactions were represented in green-dotted lines.

