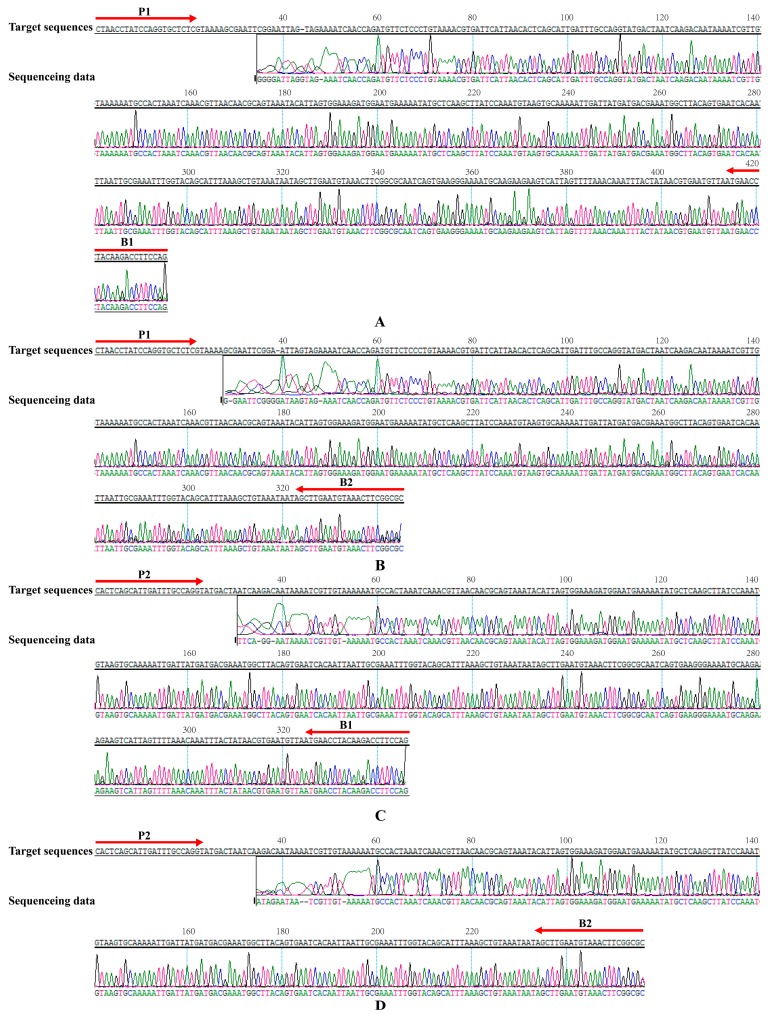
Figure 6.
Sequencing analysis of MIP-LAMP amplified L. monocytogenes hlyA gene. The target sequences were presented at the top and the sequences of the primers sites (P1, P2, B1 and B2) were underlined. (A–D): the sequencing data were obtained from primers P1 and B1, P1 and B2, P2 and B1, P2 and B2, respectively. Left and right arrows indicated complementary and sense sequences that were used. The sequencing data were shown in the bottom.

