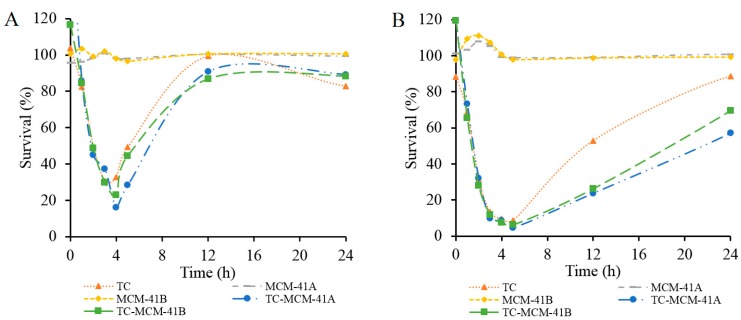
Figure 5.
Survival (%) of E. coli treated by TC, MCM-41A, MCM-41B, TC-MCM-41A and TC-MCM-41B, determined using UV-vis spectroscopy. (A) TC concentration: 0.5 µg/mL and (B) TC concentration: 1.0 µg/mL. In each group, the concentration of free TC was the same as the concentration of TC in TC-MCM-41A and TC-MCM-41B, and concentrations of MCM-41A and MCM-41B corresponded to concentrations of TC-MCM-41A and TC-MCM41B, respectively.

