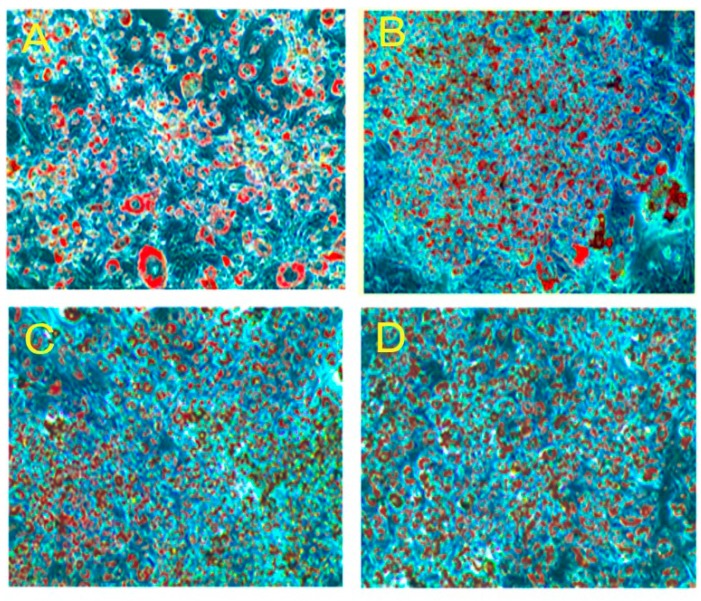
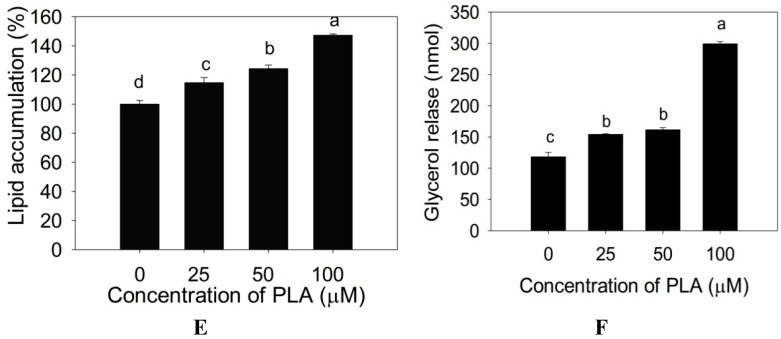
Figure 3.
Oil Red O staining of lipid accumulation and glycerol release in adipocyte on the 10th day. (A) Control; (B) 25 µM; (C) 50 µM; (D) 100 µM; (E) % of lipid extracted from experimental adipocyte with 100% isopropyl alcohol; (F) Glycerol release from differentiated adipocytes in presence of different concentration of PLA. The results represent the mean ± SEM of six replicates. Different letters a, b, c, d within treatment indicate significant differences (p < 0.05).


