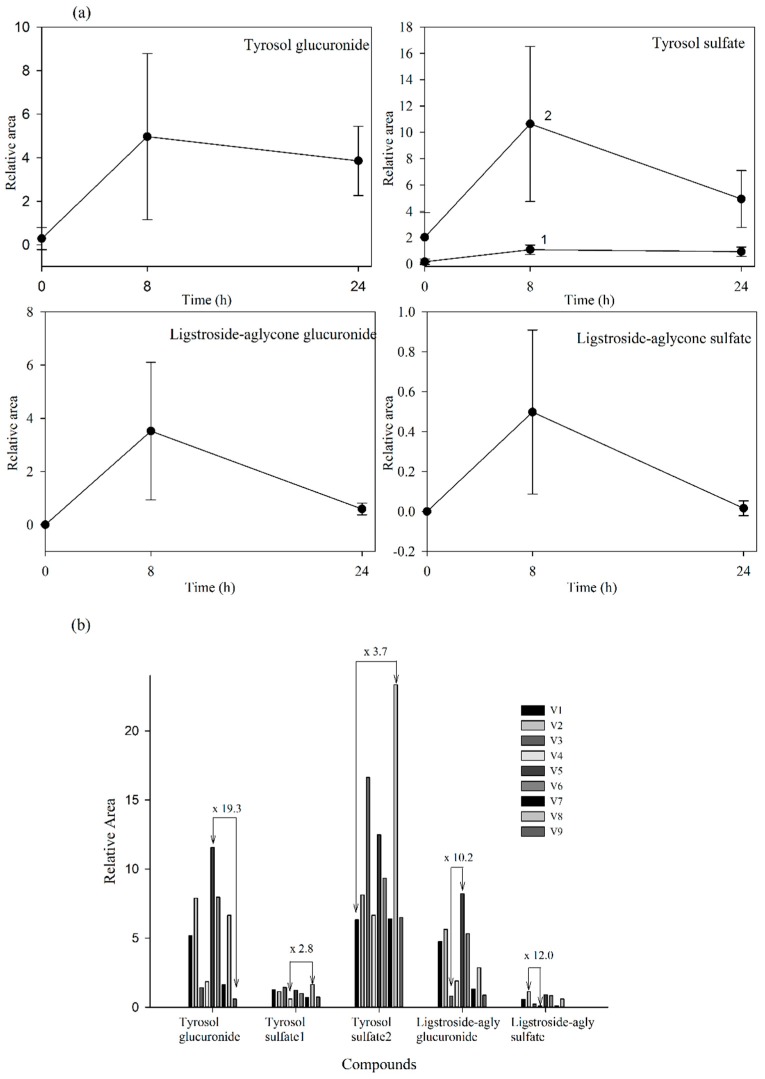
Figure 5.
(a) Urine concentration-time courses of the targeted metabolites detected. Values are means of nine volunteers with SD shown by vertical bars (1 and 2 correspond to two isomers of tyrosol sulfate); (b) Inter-individual variability in the content of the targeted metabolites observed in urine collected during the first 8 h after the consumption of the Fraxinus angustofolia Vahl extract. Differences between maximum and minimum values are shown. All results are shown as peak areas (relative area = (peak area metabolite × 100/peak area internal standard)).

