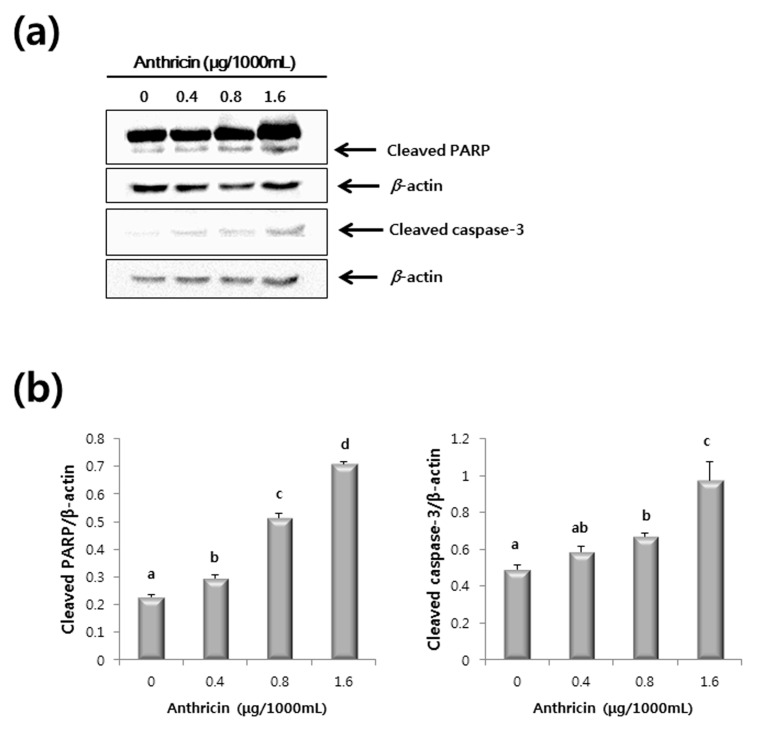
Figure 7.
Western blot of HCT116 cells treated with anthricin (0–1.6 μg/1000mL). (a) Representative western blot of caspase-3 and poly ADP ribose polymerase (PARP) protein expression; (b) Expression levels of caspase-3 and PARP protein. The level of each protein was normalized to beta-actin protein levels. The letter labels on the graph indicate statistically significant differences between samples (p < 0.05) based on one-way ANOVA with Tukey’s post hoc test.

