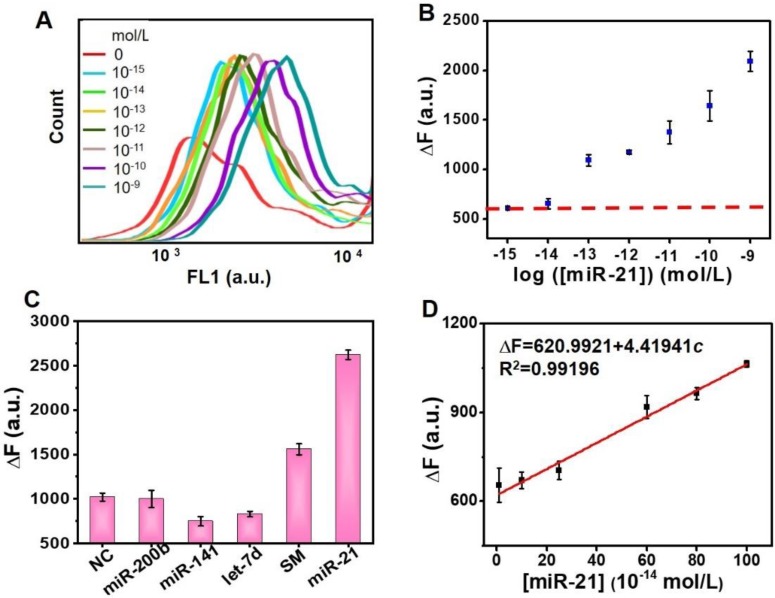
Figure 5.
Sensitivity and specificity of miRNA detection. (A) Spectra of the fluorescence response of the probe 2 with different miR-21 concentrations (0 mol/L, 10-15 mol/L, 10-14 mol/L, 10-13 mol/L, 10-12 mol/L, 10-11 mol/L, 10-10 mol/L, and 10-9 mol/L). (B) Quantitative determination of target miR-21 under optimized conditions. (C) Specificity evaluation: ΔF in response to evaluating NC, miR-200, miR-141, let-7d, SM and miR-21 samples. Error bars show the standard deviation of three independent assays. (D) Linear region for target miRNA detection. Each assay repeats at least three times.

