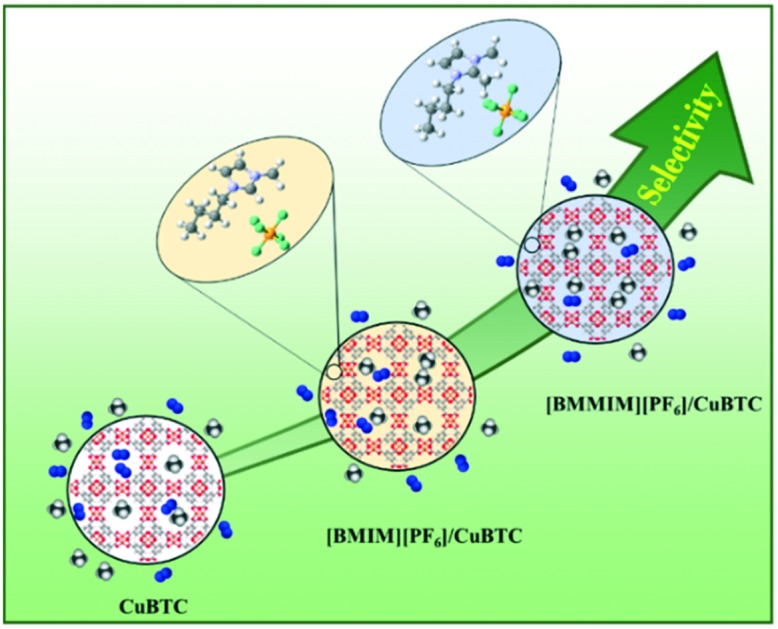
 [BMIM][PF6] and its methylated form, [BMMIM][PF6] were incorporated into CuBTC to examine the effect of methylation of ionic liquids (ILs) on the gas separation performance of the corresponding IL/metal–organic framework (MOF) composites.
Abstract
1-N-Butyl-3-methylimidazolium hexafluorophosphate, [BMIM][PF6], and its methylated form, 1-N-butyl-2,3-dimethylimidazolium hexafluorophosphate, [BMMIM][PF6], were incorporated into CuBTC to examine the effect of methylation of ionic liquids (ILs) on the gas separation performance of the corresponding IL/metal–organic framework (MOF) composites. Spectroscopic analysis revealed that the interactions of the methylated ILs with CuBTC were weaker compared to those of its non-methylated counterpart. Gas uptake measurements illustrated that this difference in the interactions influences the gas separation performance of the composites. Accordingly, the CO2/N2: 15/85 and CH4/N2: 50/50 selectivities increased by 37% and 60% for [BMMIM][PF6]/CuBTC and 34% and 50% for [BMIM][PF6]/CuBTC, respectively, compared to the corresponding selectivities of pristine CuBTC at 1000 mbar. The results revealed another structural parameter controlling the performance of the IL/MOF composites, a novel type of material with rapidly expanding application areas.
1. Introduction
A recent approach to improve the performance of a metal–organic framework (MOF) for a target application is to incorporate ionic liquids (ILs) into its pores. By this approach, ILs are used to increase the affinity of MOFs as well as to adjust the available pore space towards a specific gas.1 Alternatively, ILs can be deposited on the external surface of the MOF to form a core–shell type composite.2 Recently, the IL/MOF composites have been shown to exhibit significantly better performances in gas storage and gas separation applications.3–9 A small number of IL/MOF composites has been reported so far and, extending these investigations to all possible IL/MOF combinations is not possible. Hence, it is crucial to understand the structural factors governing the behavior of ILs in the MOF cages, their interactions and the consequences of these interactions on the performance of the composites. Once these factors are elucidated, it would be possible to design the IL/MOF composites exhibiting the highest possible gas separation performance.
We recently incorporated a family of 1,3-dialkylimidazolium type ILs having different anions into a widely studied, commercial MOF, CuBTC (where BTC is benzene-1,3,5-tricarboxylate).10 The aim was to systematically modify the interionic interaction energy in the ILs by using different combinations of ion pairs. The results showed that an increase in the interionic interaction strength of the IL leads to a stronger interaction between the IL molecules and the open metal sites of CuBTC. These results offered opportunities for tuning the electronic environment of the adsorption sites of CuBTC by controllably adjusting the IL structures. Our results further illustrated that the adjustment of the electronic environment of the open metal sites strongly affects the thermal stability limits and gas storage performance of the IL/MOF composite.
The hydrogen attached to the second carbon (C2) position between two nitrogen atoms in an imidazolium ring is the most acidic proton on the cation.11,12 The corresponding hydrogen bond between the cation and anion in this case disturbs the charge symmetry which can be suppressed by substitution of the C2–H bond with a methyl group.13 Methylation results in the introduction of non-localized and long-range Coulombic interactions instead of strong, localized, and directional hydrogen bonds.11 Since configurational variation decreases with methylation, the IL molecules tend to be packed tighter. These changes in the interactions alter the macroscopic behaviour as well. For instance, the viscosity and thermal stability limit of methylated ILs are higher than those of non-methylated moieties.12,14 In a previous report, we showed that methylation of ILs in metal-oxide supported IL samples resulted in either an increase or a decrease in the decomposition temperature depending on the surface acidity of the metal oxide support.15
In this work, we investigated the effect of methylation of a commercially available and widely studied IL (1-n-butyl-3-methylimidazolium hexafluorophosphate, [BMIM][PF6]), on the interactions between the IL molecules and a MOF with open metal sites, CuBTC. The molecular structure of the MOF and ILs can be seen in Fig. S1 and S2 of the ESI.† The consequences of these changes in the interactions on the thermal stability limit and the gas adsorption and separation performance of the IL/MOF composite were also demonstrated. The results showed that the thermal stability limits of the IL/MOF composites change with the methylation of the IL. Moreover, the methylation of IL resulted in a decrease in N2 adsorption compared to that of CH4 and CO2 uptakes, affording an increase in CO2/N2 and CH4/N2 selectivities.
2. Experimental
2.1. Materials
CuBTC (Basolite C300) and the ILs ([BMIM][PF6] and [BMMIM][PF6]) were purchased from Sigma-Aldrich and stored in an argon-filled Labconco glovebox. CH4 (99.95 vol%), CO2 (99.9 vol%), and N2 (99.9 vol%) used for the gas adsorption measurements were purchased from Linde Gas Company.
2.2. Sample preparation
IL/MOF samples were prepared after drying CuBTC overnight at 105 °C under vacuum. 0.3 g of the IL was dissolved in 20 mL of acetone (Sigma-Aldrich, ACS reagent) and stirred for 1 h at room temperature. 0.7 g of CuBTC was added to the solution and the mixture was mixed for 6 h at 35 °C until all acetone had evaporated. The resulting sample was dried in an oven at 105 °C overnight.10,16
2.3. X-ray diffraction (XRD)
A Bruker D8 Phaser instrument with an X-ray generator performance of 30 kV of voltage and 10 mA of current was utilized to obtain the diffraction pattern of CuBTC and the IL/CuBTC composites. Cu Kα1 was used as the radiation source with a wavelength of 1.5418 Å and a Lynxeye detector was used with a slit size of 1 mm. Data were collected for each sample for 2θ values between 5 and 49°, with a step size of 0.0204°.7,8,10
2.4. X-ray fluorescence (XRF)
A Bruker S8 Tiger XRF spectrometer was used for the elemental analysis of the [BMIM][PF6]/CuBTC and [BMMIM][PF6]/CuBTC composites. Approximately 150 mg of the powder samples were placed in a container (Chemplex Industries Inc.) and a 4 μm Prolene film support (Chemplex Industries Inc.) was placed on top of the containers. To immobilize the film, a ring was used. X-rays were generated using a 4 kW Rh anode X-ray tube under a helium atmosphere. An 18 mm mask was used to determine the elemental compositions. The impurities in ppm level for the samples were Si, Sn, Rh, and Ca. For data interpretation, the SpectraPlus Eval2 V2.2.454 software was used. CHO was selected as the matrix for both samples. According to the weight percentage of P (for ILs) and Cu (for CuBTC), the corresponding IL loadings were calculated.
2.5. Fourier transform infrared (FTIR) spectroscopy
To collect the IR spectra of the bulk ILs, CuBTC, and IL/CuBTC composites, a Thermo Scientific Nicolet iS50 model FTIR spectrometer with an attenuated total reflection cell was used. 64 and 512 scans were collected at a resolution of 2 cm–1 for the background and samples, respectively and averaged at room temperature.10 Peak deconvolutions were performed using Fityk software.17
2.6. Brunauer–Emmett–Teller (BET)
BET analysis was performed for CuBTC and the composite samples using a Micromeritics ASAP 2020 physisorption analyzer. Approximately 150 mg of samples were used for the measurements. Prior to each measurement, the samples were activated at 125 °C under vacuum. Free space measurement was performed using He after the sample was cooled down to liquid nitrogen temperature. N2 gas adsorption was performed in the pressure range of 10–6 to 1 bar. Pressure steps between 0.08 and 0.25 bar were used to fit the BET equation to estimate the surface area of the samples. The pore volumes of the samples were obtained from the N2 adsorption isotherm at 77 K using the t-plot method.8,10 The N2 adsorption isotherms of the pristine CuBTC, [BMIM][PF6]/CuBTC, and [BMMIM][PF6]/CuBTC samples at 77 K are shown in Fig. S3† and the pore size distribution of the samples are shown in Fig. S4.†
2.7. Scanning electron microscopy (SEM)
The morphology and crystal shapes of the CuBTC and IL/CuBTC composites were analyzed by using a Zeiss Evo LS 15 scanning electron microscope. A voltage of 3 kV was applied under vacuum conditions. The working distance was approximately 6 mm for all the samples. About 5 mg of each sample was placed on the carbon tape pasted on a cell.7,10
2.8. Thermogravimetric analysis (TGA)
To measure the decomposition temperatures of the bulk ILs, CuBTC, and composites, a TA Instruments Q500 model analyzer was used. After taring the empty platinum pan, about 15 mg of the samples were placed in the pan. A temperature ramp rate of 5 °C min–1 was employed up to 120 °C. Afterwards, the temperature was kept at 120 °C for 8 h to evaporate the moisture from the samples. Then, a temperature ramp rate of 2 °C min–1 up to 700 °C was employed under N2 flow rates of 40 and 60 mL min–1 for the balance and purge gases, respectively. The onset (Tonset) and the derivative onset (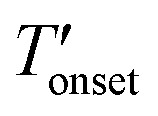 ) temperatures were determined by extrapolation from the thermogravimetry (TG) and derivative TG curves. Since, the Tonset generally overestimates the decomposition temperature compared to the
 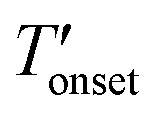 we considered the
 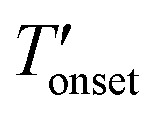 values in this work.7,8,10
2.9. Conductor-like screening model for real solvents (COSMO-RS) calculations
To estimate the gas solubilities, COSMOthermX (version 1601) software was used. The solubility values were calculated at 298 K and at a pressure range of 100–1000 mbar. These calculations were performed using TZVP parametrization. The solubility values were obtained from the activity coefficients.
2.10. Gas adsorption measurements
A Micromeritics (Particulate Systems) High Pressure Volumetric Analyzer HPVA II-200 was used to measure the gas adsorption performance of the pure CuBTC and composite samples. Prior to the adsorption measurements, approximately 0.4 g of the samples was degassed at 125 °C under vacuum till the pressure reached 10–6 bar. The details presented in the ESI† indicate that this activation procedure was sufficient to remove any moisture content from the samples (Fig. S5–S7†). After the samples were degassed, the sample holder was connected to the analysis port and the temperature was cooled down to 25 °C and kept constant during the analysis. Before the measurements, all the lines were purged with He three-times to remove the residuals from previous measurements. Adsorption measurements were performed in the pressure range of 0.1–1 bar. All the isotherms were fitted to a dual-site Langmuir model using the Ideal Adsorbed Solution Theory (IAST).17 CO2/N2 (CH4/N2) selectivities were obtained by dividing the CO2 (CH4) uptakes of the samples by the N2 uptakes at the same pressure.6,7,9
3. Results and discussion
After sample preparation, the composites were characterized in detail by XRD, XRF, SEM, FTIR, BET, and TGA. To determine the IL loadings, XRF analysis was performed. The results showed that the [BMIM][PF6] and [BMMIM][PF6] loadings in [BMIM][PF6]/CuBTC and [BMMIM][PF6]/CuBTC were approximately 20 ± 2 wt% as summarized in Table S1.† This amount is the highest IL loading that can be achieved without exceeding the incipient wetness point as discussed in our previous works,8,16,19 which demonstrated that the gas separation performance of the composites is maximized when the IL loading is as high as possible. Table 1 shows the BET results obtained for CuBTC and the IL/CuBTC composites.
Table 1. BET surface area and pore volumes of the CuBTC, [BMIM][PF6]/CuBTC and [BMMIM][PF6]/CuBTC samples.
| Sample | S BET (m2 g–1) | Pore volume (cm3 g–1) |
| CuBTC (ref. 10) | 1324 | 0.522 |
| [BMIM][PF6]/CuBTC | 364 | 0.186 |
| [BMMIM][PF6]/CuBTC | 306 | 0.143 |
Accordingly, both pore volume and BET surface area of the parent CuBTC decreased upon the incorporation of [BMIM][PF6] and [BMMIM][PF6]. The decrease in the BET surface area and pore volume was higher in [BMMIM][PF6]/CuBTC compared to the one in the composite with the non-methylated IL. This difference is attributed to the slightly higher specific volume of [BMMIM][PF6] than that of [BMIM][PF6].
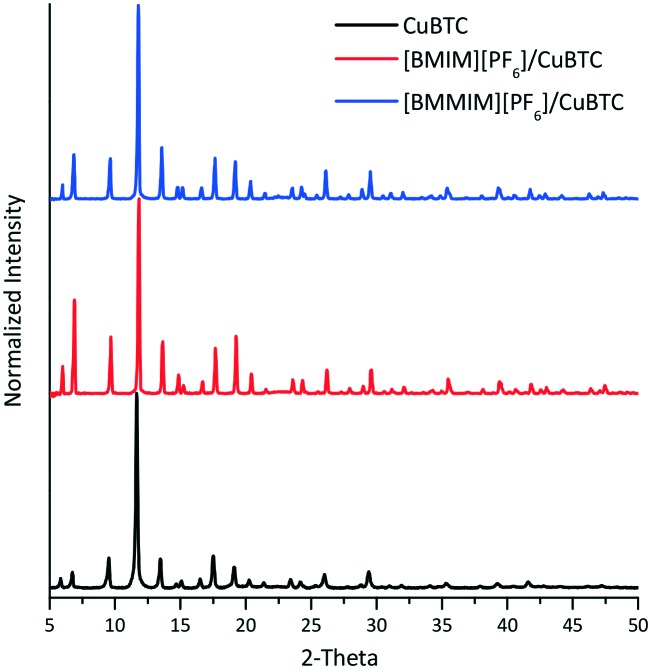
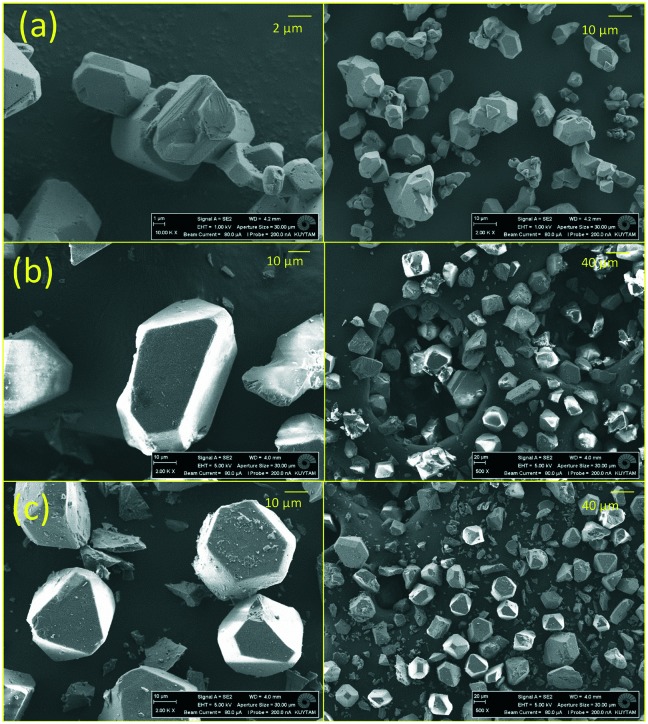
To examine the crystal structure of the composites, XRD analysis was performed. Fig. 1 shows that the XRD features of CuBTC are preserved in the composites. However, there were slight changes in the intensity of some of the features of the [BMIM][PF6]/CuBTC and [BMMIM][PF6]/CuBTC samples compared to those of the pristine CuBTC. These changes can be due to a change in the electronic environment over some planes after the IL incorporation or the changes in the crystal sizes because of the mixing during the sample preparation. We note that the degree of this change depends on how the IL molecules are interacting with the framework. Based on these XRD results, we inferred that incorporation of the ILs, either methylated or non-methylated, does not damage the crystal structure of the MOF. To confirm this conclusion, the morphology of the composites was investigated using SEM. Fig. 2 shows the SEM images of the CuBTC, [BMIM][PF6]/CuBTC, and [BMMIM][PF6]/CuBTC samples. It can be clearly seen that the morphology and crystal shape of CuBTC are almost the same as those of the composite samples, consistent with the XRD results. Thus, we inferred that the crystal structure of CuBTC remained intact upon deposition of both ILs and methylation did not change the crystallinity of CuBTC.7,8,10,16
Fig. 1. XRD patterns of the CuBTC, [BMIM][PF6]/CuBTC and [BMMIM][PF6]/CuBTC samples.
Fig. 2. SEM images of (a) CuBTC; (b) [BMIM][PF6]/CuBTC, and (c) [BMMIM][PF6]/CuBTC.
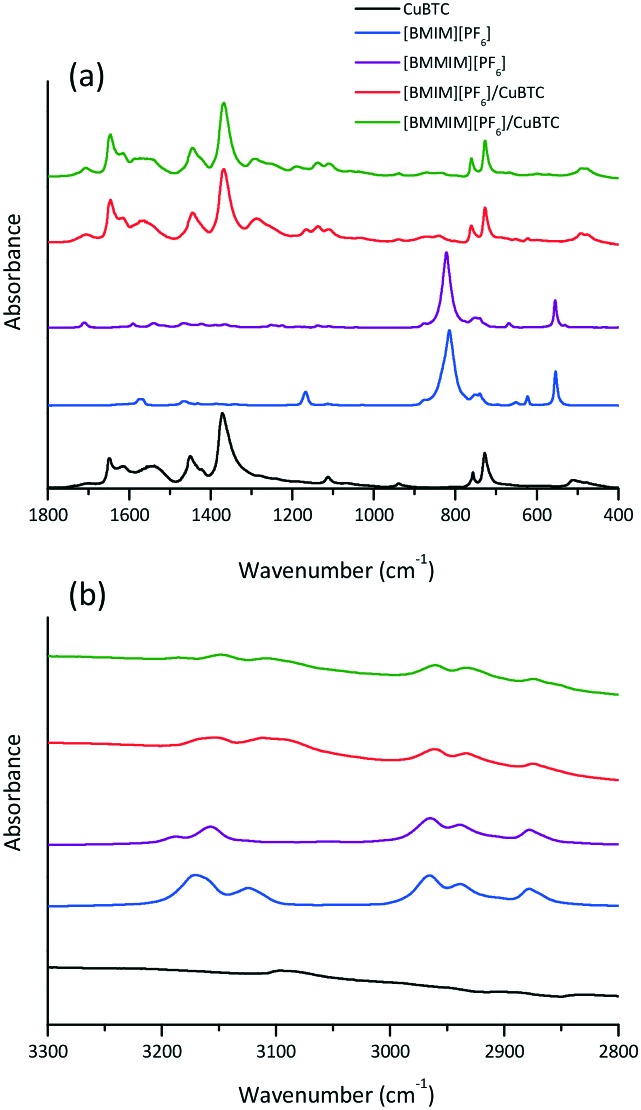
To confirm the incorporation of [BMIM][PF6] and [BMMIM][PF6] into CuBTC, the composites were washed with two different hydrophobic solvents,20,21 toluene and benzyl alcohol, which can dissolve [BMIM][PF6] and [BMMIM][PF6].22 Both solvents are large enough (7.5 Å and 8 Å, respectively)23 so that they cannot enter the pore openings of CuBTC (3.4 Å).24 The results in Fig. S8–S11 in the ESI† show that this washing process could not remove [BMIM][PF6] and [BMMIM][PF6] from the composites, confirming that both ILs were internally incorporated inside the CuBTC, consistent with the previous reports.7,8,10,19 Our previous studies illustrated that there are some interactions between the IL molecules and the MOF when the IL is incorporated into the framework.7,8,10,16 To elucidate these interactions, we performed FTIR analysis and the results are shown in Fig. 3.
Fig. 3. FTIR spectra of the CuBTC, bulk [BMIM][PF6], bulk [BMMIM][PF6], [BMIM][PF6]/CuBTC and [BMMIM][PF6], CuBTC samples; at (a) 1800 and 400 cm–1 and (b) 3300 and 2800 cm–1.
According to Fig. 3, the spectra of the composites show that both IL and MOF features are still present, showing that the IL and MOF structures are intact in the composites, consistent with the XRD results. It can be seen from Fig. 3 that some of the IL bands were shifted in the spectra of the composites. These shifts are attributed to the interactions between the IL molecules and CuBTC.7,8,10,16 Previous studies showed that the IL molecules interact directly with the open metal sites in CuBTC.10,25,26 To understand the extent of the interactions between CuBTC and [BMIM][PF6] and its methylated counterpart ([BMMIM][PF6]), we probed the Cu–O (carboxylic bond) stretching frequency of the composites. The data showed that the band at 480 cm–1 (ν(Cu–O)) in the CuBTC spectrum shifted to 475 cm–1 in [BMIM][PF6]/CuBTC. However, in the methylated sample, [BMMIM][PF6]/CuBTC, the corresponding peak shifts to 477 cm–1. These red shifts are slightly above the spectral resolution of our measurements, and thus, they might indicate that the Cu–O bonding becomes weaker in the presence of ILs.10,27 Accordingly, the degree of this weakening in the Cu–O bonding is different when the ILs are different. [BMIM][PF6] might exhibit stronger interaction with the open metal sites, resulting in a higher degree of red shift in the Cu–O stretching frequency. On the other hand, the methylated IL ([BMMIM][PF6]) has a weaker interaction with the Cu–O site compared to the non-methylated IL. This difference might be because of the hydrogen bonding between the C2–H in the cation and the framework oxygen atoms bonded to the metal sites (Cu atoms). Moreover, it might be attributed to the more dynamic behaviour of the cations and anions in the non-methylated IL ([BMIM][PF6]) compared to the methylated counterpart ([BMMIM][PF6]).14 These differences in the interactions between the IL molecules and MOF are expected to lead to changes in the gas storage and separation performances.
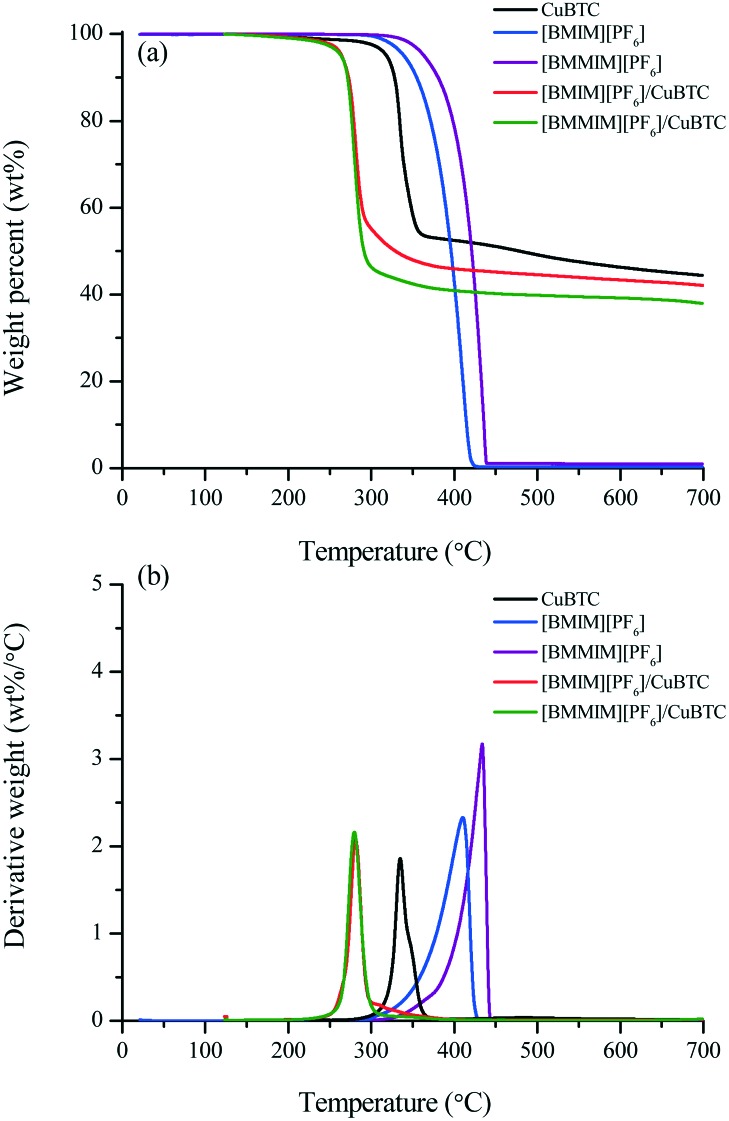
The TGA results given in Fig. 4 and Table 2 show that the bulk [BMMIM][PF6] is more stable than its non-methylated counterpart. This result is consistent with those in previous studies.11,15,28 The 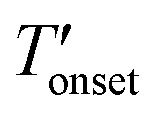 values were 255 and 262 °C for [BMIM][PF6]/CuBTC and [BMMIM][PF6]/CuBTC, respectively. Recently, we showed that the interaction of ILs with open metal sites is a major parameter determining the decomposition temperature.10 Accordingly, the
 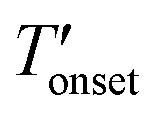 exhibits an inverse relation with a Cu–O band shift. The higher degree of red shifts in the Cu–O band resulted in a lower decomposition temperature.10 Here, we observed a very similar trend, the [BMIM][PF6]/CuBTC sample has a Cu–O red shift of 5 cm–1 and its
 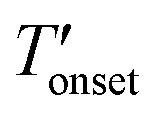 is 255 °C, while [BMMIM][PF6]/CuBTC has a red shift of 3 cm–1 and it decomposes at 262 °C. However, we also note that the decrease in the thermal stability limit of the IL upon the incorporation of the IL into the MOF is more significant for the methylated IL.
Fig. 4. TGA results of the CuBTC, [BMIM][PF6], [BMMIM][PF6], [BMIM][PF6]/CuBTC and [BMMIM][PF6]/CuBTC samples: (a) TG curves and (b) derivative TG curves.
Table 2.
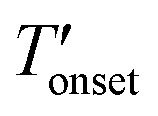 values of the CuBTC, bulk IL, and IL-incorporated CuBTC samples.
| Sample |
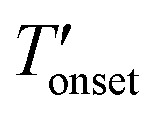 (°C) (°C) |
| CuBTC | 324 |
| [BMIM][PF6] | 298 |
| [BMMIM][PF6] | 342 |
| [BMIM][PF6]/CuBTC | 255 |
| [BMMIM][PF6]/CuBTC | 262 |
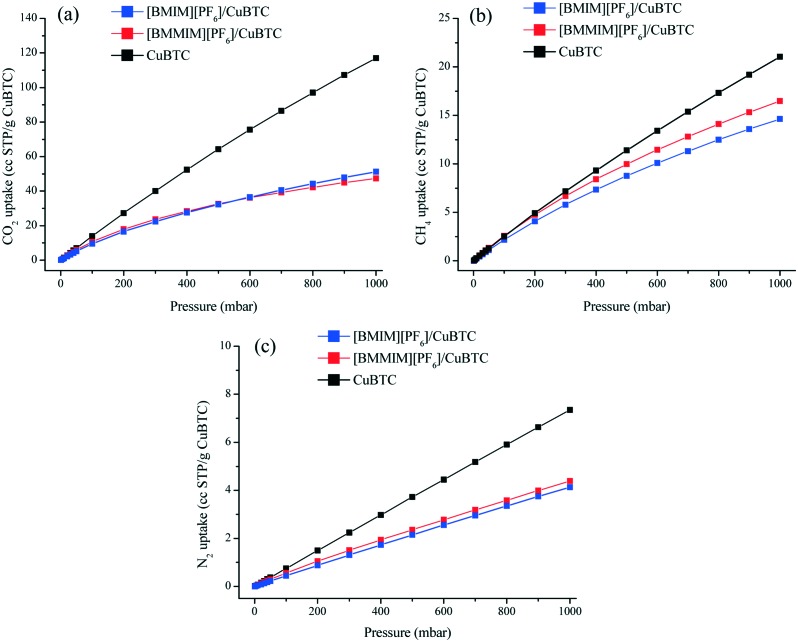
We investigated the consequences of these differences in the interactions between the ILs and MOF on the gas adsorption and separation performance of the IL/MOF composites as well. Accordingly, CO2, CH4, and N2 adsorption experiments were performed on the pristine CuBTC and on the [BMIM][PF6]/CuBTC and [BMMIM][PF6]/CuBTC composites. Fig. 5 shows the experimentally measured adsorption isotherms fitted to the dual-site Langmuir model. The fitting parameters are given in Tables S2–S4.† The CO2, CH4, and N2 uptakes in the composite samples decreased compared to their corresponding values in the parent CuBTC. However, the degree of this decrease in the uptakes was not the same for CO2, CH4, and N2. For instance, the difference between the CH4 uptake of pristine CuBTC and the composites was very low up to 400 mbar; however, the difference in the N2 uptakes of CuBTC and the IL/MOF composites was higher. In the composite uptakes, [BMMIM][PF6]/CuBTC has higher CO2 (up to 500 mbar), CH4, and N2 uptakes compared to [BMIM][PF6]/CuBTC. This difference is due to the difference in the interactions of [BMIM][PF6] and [BMMIM][PF6] with the open metal sites of CuBTC. Since [BMMIM][PF6] has weaker interactions with the open metal sites of CuBTC (probed by a lower degree of red shift in ν(Cu–O)), the electron density over the open metal sites is more available for gas molecules. This result is consistent with our previous study in which we showed that the strong interactions of ILs with open metal sites in CuBTC resulted in lower uptakes.10 Furthermore, our COSMO-RS29,30 calculations (Fig. S12 and S13†) showed that CO2, CH4, and N2 have higher solubilities in [BMMIM][PF6] compared to non-methylated [BMIM][PF6]. This difference in solubilities can be another reason for the differences in the degree of decrease in the uptakes.
Fig. 5. Adsorption isotherms of the CuBTC, [BMIM][PF6]/CuBTC, and [BMMIM][PF6]/CuBTC samples at 298 K; (a) CO2, (b) CH4, and (c) N2.
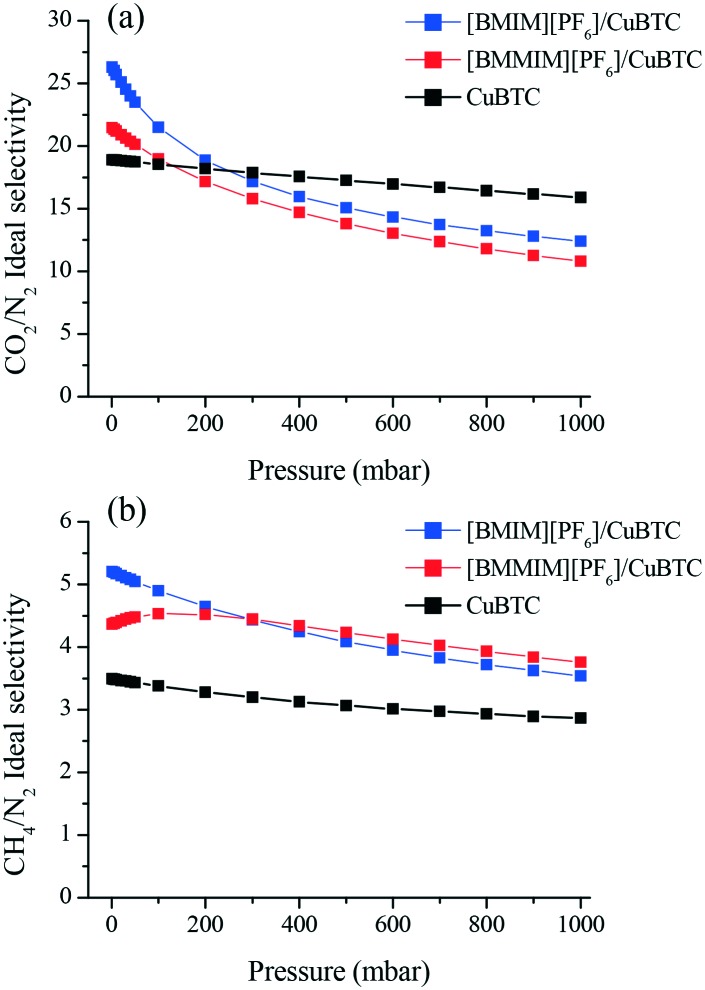
We then investigated the separation performance of the composites. Fig. 6(a) shows that at 1 mbar, [BMIM][PF6]/CuBTC ([BMMIM][PF6]/CuBTC) composite showed approximately 39% (13%) and 49% (25%) improvements for the CO2/N2 and CH4/N2 ideal selectivities, respectively, compared to pristine CuBTC. As the pressure increases, the free space becomes the dominant factor in the separation behavior of an adsorbent. As a result, we observed decreasing selectivities at higher pressures. The higher CO2/N2 selectivity of the [BMIM][PF6]/CuBTC composite is mainly attributed to the higher CO2/N2 solubility ratio in [BMIM][PF6] (Fig. S13†). For CH4/N2, we observed improved selectivity performances for both composites in the whole pressure region. [BMIM][PF6]/CuBTC showed a 49% increment and the [BMMIM][PF6]/CuBTC sample showed a 25% improvement compared to the parent CuBTC at 1 mbar.
Fig. 6. Ideal (a) CO2/N2 (b) CH4/N2 adsorption selectivities of CuBTC, [BMIM][PF6]/CuBTC and [BMMIM][PF6]/CuBTC at room temperature.
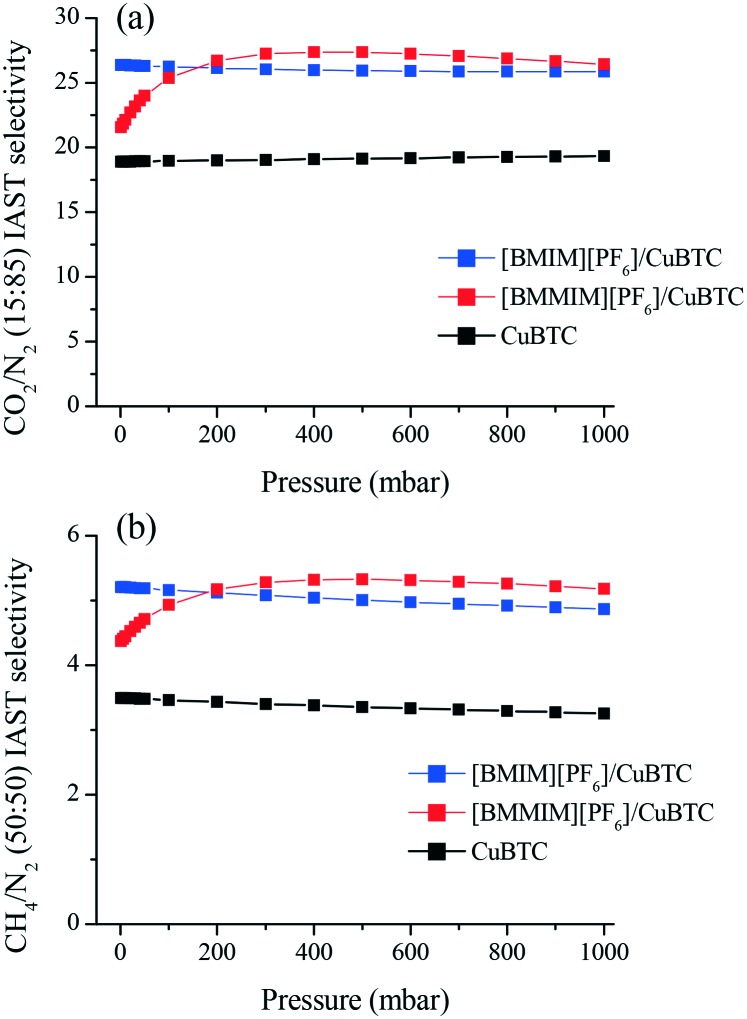
In order to assess the separation performance of these composites for gas mixtures, we used IAST18 to estimate the mixture selectivity of the CuBTC, [BMIM][PF6]/CuBTC and [BMMIM][PF6]/CuBTC samples for the CO2/N2: 15/85 and CH4/N2: 50/50 compositions. Fig. 7 shows that both composites exhibit superior gas separation performance compared to pristine CuBTC in the whole pressure range. At very low pressures, the [BMIM][PF6]/CuBTC sample showed higher selectivity values compared to the corresponding values in [BMMIM][PF6]/CuBTC for both CO2/N2 and CH4/N2. However, after 100 mbar, [BMMIM][PF6]/CuBTC exhibits a better performance. This result might be because of the weak interactions of the gas molecules with the methylated IL molecules at low pressures as a result of more packed cations and anions. The improvements in the selectivities presented in this study demonstrate the broad potential of incorporating ILs in MOFs.
Fig. 7. IAST mixture selectivities of the CuBTC, [BMIM][PF6]/CuBTC and [BMMIM][PF6]/CuBTC samples for the (a) CO2/N2: 15/85 and (b) CH4/N2: 50/50 mixtures.
4. Conclusions
We illustrated that methylation at the C2 position on the imidazolium ring of an imidazolium-type IL directly affects the interactions between the IL and open metal sites of CuBTC. The results illustrated that upon methylation, the IL molecules interact weakly with the open metal sites of the MOF. The consequences of these interactions on the gas separation performance of the IL/MOF composites were also investigated. The results showed that IL/MOF sample with non-methylated IL has higher CO2/N2 and CH4/N2 selectivities compared to its methylated counterpart up to 200 mbar. The results presented in this work will contribute in guiding the rational design of IL/MOF composites for gas separation applications with a broad potential to be extended to other fields.
Conflicts of interest
There are no conflicts to declare.
Supplementary Material
Acknowledgments
This work is supported by the Scientific and Technological Research Council of Turkey (TUBITAK) (project number: 114R093) and by the Koç University Seed Fund Program. Support provided by the KUTEM (Koç University TÜPRAŞ Energy Center) is gratefully acknowledged. The authors acknowledge the Koç University Surface Science and Technology Center (KUYTAM) for providing help with the sample characterization. A. U. acknowledges the TUBA-GEBIP Award. A. U. thanks TARLA for collaborative research support. S. K. acknowledges the ERC-2017-Starting Grant. This study has received funding from the European Research Council (ERC) under the European Union's Horizon 2020 Research and Innovation Programme (ERC-2017-Starting Grant, Grant Agreement No 756489-COSMOS).
Footnotes
†Electronic supplementary information (ESI) available: Dual-site-Langmuir fit parameters, gas solubility, and washing results. See DOI: 10.1039/c8ce01364k
References
- Kinik F. P., Uzun A., Keskin S. ChemSusChem. 2017;10:2842–2863. doi: 10.1002/cssc.201700716. [DOI] [PubMed] [Google Scholar]
- Zeeshan M., Nozari V., Yagci M. B., Isık T., Unal U., Ortalan V., Keskin S., Uzun A. J. Am. Chem. Soc. 2018;140:10113–10116. doi: 10.1021/jacs.8b05802. [DOI] [PubMed] [Google Scholar]
- Ma J., Ying Y., Guo X., Huang H., Liu D., Zhong C. J. Mater. Chem. A. 2016;4:7281–7288. [Google Scholar]
- Ban Y., Li Z., Li Y., Peng Y., Jin H., Jiao W., Guo A., Wang P., Yang Q., Zhong C., Yang W. Angew. Chem., Int. Ed. 2015;54:15483–15487. doi: 10.1002/anie.201505508. [DOI] [PubMed] [Google Scholar]
- Gupta K. M., Chen Y., Jiang J. J. Phys. Chem. C. 2013;117:5792–5799. [Google Scholar]
- Khan N. A., Hasan Z., Jhung S. H. Chem. - Eur. J. 2014;20:376–380. doi: 10.1002/chem.201304291. [DOI] [PubMed] [Google Scholar]
- Kinik F. P., Altintas C., Balci V., Koyuturk B., Uzun A., Keskin S. ACS Appl. Mater. Interfaces. 2016;8:30992–31005. doi: 10.1021/acsami.6b11087. [DOI] [PubMed] [Google Scholar]
- Koyuturk B., Altintas C., Kinik F. P., Keskin S., Uzun A. J. Phys. Chem. C. 2017;121(19):10370–10381. [Google Scholar]
- Mohamedali M., Ibrahim H., Henni A. Chem. Eng. J. 2018;334:817–828. [Google Scholar]
- Nozari V., Keskin S., Uzun A. ACS Omega. 2017;2:6613–6618. doi: 10.1021/acsomega.7b01074. [DOI] [PMC free article] [PubMed] [Google Scholar]
- Noack K., Schulz P. S., Paape N., Kiefer J. Phys. Chem. Chem. Phys. 2010:14153–14161. doi: 10.1039/c0cp00486c. [DOI] [PubMed] [Google Scholar]
- Wulf A., Fumino K., Ludwig R. Angew. Chem., Int. Ed. 2010;49:449–453. doi: 10.1002/anie.200905437. [DOI] [PubMed] [Google Scholar]
- Fumino K., Wulf A., Ludwig R. Angew. Chem., Int. Ed. 2008;47:3830–3834. doi: 10.1002/anie.200705736. [DOI] [PubMed] [Google Scholar]
- Fumino K., Wulf A., Ludwig R. Angew. Chem., Int. Ed. 2008;47(45):8731–8734. doi: 10.1002/anie.200803446. [DOI] [PubMed] [Google Scholar]
- Babucci M., Akçay A., Balci V., Uzun A. Langmuir. 2015;31:9163–9176. doi: 10.1021/acs.langmuir.5b02519. [DOI] [PubMed] [Google Scholar]
- Sezginel K. B., Keskin S., Uzun A. Langmuir. 2016;32:1139–1147. doi: 10.1021/acs.langmuir.5b04123. [DOI] [PubMed] [Google Scholar]
- Wojdyr M. J. Appl. Crystallogr. 2010;43:1126–1128. [Google Scholar]
- Lee S., Lee J. H., Kim J. Korean J. Chem. Eng. 2018;35:214–221. [Google Scholar]
- Zeeshan M., Keskin S., Uzun A. Polyhedron. 2018;155:485–492. [Google Scholar]
- Hulteen J. C., Jirage K. B., Martin C. R. J. Am. Chem. Soc. 1998;120:6603–6604. [Google Scholar]
- Pich A. and Richtering W., Chemical Design of Responsive Microgels, 2011, vol. 234. [Google Scholar]
- Huddleston J. G., Visser A. E., Reichert W. M., Willauer H. D., Broker G. a., Rogers R. D. Green Chem. 2001;3:156–164. [Google Scholar]
- Van Der Bruggen B., Schaep J., Wilms D., Vandecasteele C. J. Membr. Sci. 1999;156:29–41. [Google Scholar]
- Vishnyakov A., Ravikovitch P. I., Neimark A. V., Bülow M., Wang Q. M. Nano Lett. 2003;3(6):713–718. [Google Scholar]
- Karra J. R., Walton K. S. Langmuir. 2008;24:8620–8626. doi: 10.1021/la800803w. [DOI] [PubMed] [Google Scholar]
- Dietzel P. D. C., Besikiotis V., Blom R. J. Mater. Chem. 2009;19:7362. [Google Scholar]
- Dhumal N. R., Singh M. P., Anderson J. A., Johannes K., Kim H. J. J. Phys. Chem. C. 2016;120:3295–3304. [Google Scholar]
- Babucci M., Balci V., Akçay A., Uzun A. J. Phys. Chem. C. 2016;120:20089–20102. [Google Scholar]
- Palomar J., Ferro V. R., Torrecilla J. S., Rodriguez F. Ind. Eng. Chem. Res. 2007;46:6041–6048. [Google Scholar]
- Anantharaj R., Banerjee T. Ind. Eng. Chem. Res. 2010;49:8705–8725. [Google Scholar]
Associated Data
This section collects any data citations, data availability statements, or supplementary materials included in this article.


