

Abstract
Near-infrared photoimmunotherapy (NIR-PIT) is a newly developed cancer treatment that induces highly selective immunogenic cell death. It is based on an antibody–photoabsorber conjugate (APC) that is activated by NIR light. The purpose of this study was to investigate the effects of NIR-PIT as measured by luciferase–luciferin photon-counting and fluorescence imaging. Six days after subcutaneous injection of A431-luc-GFP cells tumors formed in a xenograft mouse model. The EGFR-targeting antibody, panitumumab, was conjugated to the photoabsorber, IRDye-700DX (pan–IR700), and was intravenously administered to tumor-bearing mice. Serial luciferase–luciferin photon-counting images and both green fluorescent protein (GFP) and IR700 fluorescence images were obtained from the same mice before and after NIR-PIT treatment (0, 10, 20, 30 min (early phase), and 24, 48 h (late phase) after NIR light exposure). Optical signal intensities were compared for each modality. IR700 fluorescence and luciferase–luciferin photon-counting images showed decreased intensities in both the early and late phases after NIR-PIT (p < 0.01). On the other hand, GFP fluorescence images showed decreased intensities only in the late phase (p < 0.01). In the early phase, GFP fluorescence images showed smaller intensity reductions compared to IR700 fluorescence and luciferase–luciferin photon-counting (p < 0.01), while in the late phase, IR700 fluorescence showed smaller intensity reductions than luciferase–luciferin photon-counting and GFP fluorescence (p < 0.05), due to redistribution of pan–IR700 within the tumor bed. In conclusion, luciferase–luciferin photon-counting imaging is suitable to evaluate early phase NIR-PIT effects, while both luciferase–luciferin photon-counting and GFP reflected later phase effects.
Keywords: near-infrared photoimmunotherapy, luciferase–luciferin photon-counting, fluorescence imaging, therapeutic effect, acute phase
Graphical Abstract
INTRODUCTION
Near-infrared photoimmunotherapy (NIR-PIT) is a newly developed cancer treatment that induces highly specific cell death in targeted tumor cells using a monoclonal antibody conjugated to a silica–phthalocyanine photoabsorbing dye, (IRDye700DX: IR700) dye.1 This antibody–photoabsorber conjugate (APC) is administered intravenously, and after a suitable incubation period, the subject is exposed to 690 nm NIR light, which activates IR700. The clinical phase I/II trial of NIR-PIT using the EGFR-targeting APC, cetuximab-IR700, for patients with inoperable head and neck cancer was approved by the US Food and Drug Administration (FDA) and has been underway since April 2015 (https://clinicaltrials.gov/ct2/show/NCT02422979). NIR-PIT has an important advantage over other cancer therapies in that it induces highly selective necrotic and immunogenic cell death of tumors without damaging adjacent normal cells unlike most other therapies that induce apoptotic cell death.1–6 Tumor cells treated with NIR-PIT show rapid volume expansion, cell membrane rupture, and extrusion of the cell contents into the extracellular space almost immediately after exposure to NIR light.7–12 The effect of NIR-PIT is mostly acute with a more sustained immunologic response that follows.
Luciferase–luciferin photon-counting and fluorescence imaging have been developed with the help of gene reporter technologies and are widely used in molecular and cellular biology both in vitro and in vivo. The most common reporter gene for luciferase–luciferin photon-counting imaging is the gene encoding firefly luciferase, which catalyzes the oxidation of D-luciferin by consuming adenosine triphosphate (ATP), Mg2+, and oxygen to produce light.13–15 Luciferase–luciferin photon-counting imaging has high sensitivity because of its high target to background ratios (TBR), and previous studies have shown its usefulness in assessing the therapeutic effects of NIR-PIT.16–19 Fluorescence imaging is generated with photo-physical reactions triggered by an excitation light source. For instance, green fluorescent protein (GFP), which has a major excitation peak at 395 nm and an emitted peak at 509 nm, is one of the most commonly used fluorescent proteins because of its stable gene expression and high yield of light emission.20 GFP fluorescence imaging allows visualization of cancer cell dynamics21,22 and, in the case of NIR-PIT, has been reported to help demonstrate cell membrane rupture by revealing gradual loss of GFP signal following cell rupture.5 Luciferase–luciferin photon-counting and fluorescent imaging both enable real time assessments of NIR-PIT and are therefore helpful in in vivo imaging in preclinical studies.12,16–19,23
Imaging during the acute phase of NIR-PIT can be used to optimize treatment regimens and clarify cellular and molecular dynamics. Both luciferase–luciferin photon-counting and fluorescence imaging have potential to objectively depict therapeutic response after NIR-PIT. However, their value as imaging biomarkers remains unclarified. The purpose of this study was to investigate whether luciferase–luciferin photon-counting or fluorescence imaging is preferable in the acute phase after NIR-PIT in predicting the therapeutic response in the tumor.
MATERIALS AND METHODS
Cell Culture.
A431-luc-GFP cells expressing human epidermal growth factor receptor 1 (HER1) with the gene encoding firefly luciferase and GFP were cultured in RPMI1640 supplemented with 10% FBS and 1% penicillin–streptomycin in tissue culture flasks in a humidified incubator at 37 °C in an atmosphere of 95% air and 5% carbon dioxide.
Reagents.
Water-soluble, silica–phthalocyanine derivative, IRDye700DX NHS ester, was obtained from LI-COR Bioscience (Lincoln, NE, USA). Panitumumab, a fully humanized IgG2 monoclonal antibody against HER1, was purchased from Amgen (Thousand Oaks, CA, USA). All other chemicals were of reagent grade.
Synthesis of IR700-Conjugated Panitumumab.
Panitumumab (1 mg, 6.8 nmol) was incubated with IR700 (66.9 μg, 34.2 nmol, 10 mmol/L in DMSO) and 0.1 mol/L Na2HPO4 (pH 8.5) at room temperature for 1 h. The mixture was purified with a gel filtration column (Sephadex G 25 column, PD-10, GE Healthcare, Piscataway, NJ, USA). The protein concentration was determined with Coomassie Plus protein assay kit (Thermo Fisher Scientific Inc., Rockford, IL, USA) by measurement of the absorption at 595 nm with spectroscopy (8453 Value System; Agilent Technologies, Santa Clara, CA, USA). We abbreviate IR700-conjugated panitumumab as pan–IR700.
Animal Model.
All procedures were performed in compliance with the Guide for the Care and Use of Laboratory Animals and approved by the local Animal Care and Use Committee. Twenty-one female homozygote athymic nude mice, 6 to 8 weeks old, were used after purchase from Charles River (National Cancer Institute Frederick). A431-luc-GFP cells (2 × 10⁶ in phosphate-buffered saline) were subcutaneously injected in the dorsi of the mice under anesthesia with isoflurane.
NIR-PIT.
This study was performed after the tumors reached volumes of approximately 50 mm3. Tumor volumes were calculated from the greatest longitudinal diameter (length) and the greatest transverse diameter (width) using the following formula: tumor volume = length × width2 × 0.5, based on caliper measurements. In all 21 mice, 100 μg of pan–IR700 was intravenously injected 6 days after the tumor cell injection. To examine the therapeutic effect of in vivo NIR-PIT, A431-luc-GFP bearing mice were separated into non-PIT group (10 mice) without NIR light exposure and NIR-PIT treated group (11 mice). For the NIR-PIT treated group, NIR light was irradiated with 50 J/cm2 of light dose 1 day after pan–IR700 injection. Tumor volumes were measured until the mice were euthanized with carbon dioxide after the tumor volume reached 2,000 mm3.
In vivo Luciferase–Luciferin Photon-Counting and Fluorescence Imaging and Image Analysis.
To obtain luciferase–luciferin photon-counting images, D-luciferin (15 mg/mL, 200 μL) was intraperitoneally injected to mice 6 days after tumor cell implantation. Luciferase activity was analyzed with a luciferase–luciferin photon-counting imaging system (Photon Imager; Biospace Lab, Paris, France) with results reported in relative light units (RLU). Regions of interest (ROI) were placed over the entire tumor. The counts per minute of RLU were calculated using M3 Vision Software (Biospace Lab) and converted to the percentage based on pretreatment RLU as %RLU.
IR700 and GFP fluorescence images were obtained with a 700 nm fluorescence channel of a Pearl Imager (LI-COR Bioscience) and the Maestro in vivo imaging system (CRi, Waltham, MA, USA), respectively. For GFP, a band-pass filter from 445 to 490 nm (excitation) and a long-pass blue filter over 515 nm (emission) were used. The tunable emission filter was automatically stepped in 10 nm increments from 500 to 600 nm for the green filter sets at constant exposure (500 ms). In IR700 and GFP fluorescence images, regions of interest (ROI) were placed on the tumor and the mean value of fluorescence intensity was calculated for each ROI. TBR was calculated from fluorescence intensities of tumors and fluorescence intensity of background by the following formula: (fluorescence intensity of tumor) − (fluorescence intensity of background)/(fluorescence intensity of background). Then, TBR was converted to the percentage based on pretreatment TBR as %TBR.
For all mice, scans of luciferase–luciferin photon-counting images, IR700 fluorescence images, and GFP fluorescence images were performed in the early phase (0 min (immediately after NIR-PIT), 10, 20, and 30 min after NIR-PIT) and in the late phase (24 and 48 h after NIR-PIT) after NIR-PIT in this order.
Statistical Analysis.
Quantitative data were expressed as means ± SD. Mann–Whitney U-tests were used to compare all parameters between non-PIT and NIR-PIT treated groups. The cumulative probability of survival was analyzed by the Kaplan–Meier survival curve analysis, and the results were compared with the Log-rank test. The paired t-tests were used to compare the parameters before and after NIR-PIT and to compare the parameters among different modalities of luciferase–luciferin photon-counting and fluorescence imaging. Statistical analysis was performed with JMP 13 software (SAS Institute, Cary, NC). A p value of less than 0.05 was considered significant.
RESULTS
Treatment Outcome after NIR-PIT.
The tumor volumes in the NIR-PIT treated group showed significantly greater reduction compared with those in the non-PIT group (p < 0.01 at 9, 12, and 14 days after NIR-PIT) (Figure 1B). Survival in the NIR-PIT treated group was also prolonged significantly, compared with the non-PIT group (p < 0.01, Log-rank test) (Figure 1C). These data suggest that NIR-PIT led to significant tumor reduction and prolonged survival for A431-luc-GFP tumor bearing mice.
Figure 1.

Treatment outcome after NIR-PIT. (A) NIR-PIT outline. (B) NIR-PIT leads to tumor volume reduction in A431-luc-GFP tumor bearing mice (n = 10 mice in non-PIT group, n = 11 mice in NIR-PIT treated group; *p = 0.01, Mann–Whitney U-test). (C) NIR-PIT leads to prolonged survival in A431-luc-GFP tumor bearing mice (n = 10 mice in non-PIT group, n = 11 mice in NIR-PIT treated group; p < 0.01, Log-rank test).
Changes of IR700 Fluorescence Intensity after NIR-PIT.
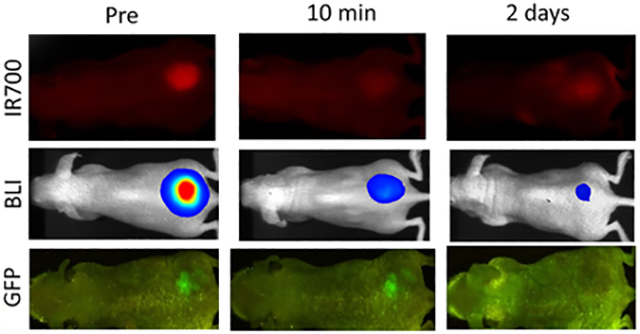
To investigate IR700 fluorescence intensity changes after NIR-PIT, the TBR on IR700 fluorescence imaging was compared before and after NIR-PIT (TBR Post PIT/TBR Pre PIT × 100 = %TBRIR700). %TBRIR700 values for 0 min, 10 min, 20 min, 30 min, 24 h, and 48 h after NIR-PIT showed 25 ± 9%, 29 ± 9%, 31 ± 12%, 30 ± 9%, 39 ± 14%, and 38 ± 19%, respectively. %TBRIR700 after NIR-PIT was significantly lower for the NIR-PIT treated group than for the non-PIT group in the early and late phase (%TBRIR700: p < 0.01 for 0 min, 10 min, 20 min, 30 min, 24 h, and 48 h after NIR-PIT) (Figure 2C). %TBRIR700 immediately after NIR-PIT showed approximately 75% decrease, and %TBRIR700 in the later phases increased gradually likely due to wash in of fresh APC into the treated region (p < 0.01 and 0.021 for 24 and 48 h after NIR-PIT, respectively) (Figure 2D).
Figure 2.

IR700 fluorescence imaging in response to NIR-PIT. (A) NIR-PIT outline. IR700 fluorescence images were scanned at each time point as shown. (B) IR700 fluorescence real-time images of A431-luc-GFP tumor bearing mice for NIR-PIT. Yellow arrows indicate the tumor. IR700 fluorescence intensity greatly decreased in the early phase (0, 10, 20, 30 min later) after NIR-PIT. IR700 fluorescence intensities in the late phase (24 and 48 h later) after NIR-PIT were higher than those immediately after NIR-PIT. (C) Comparison of IR700 fluorescence intensity in A431-luc-GFP tumor bearing mice between non-PIT and NIR-PIT treated groups. %TBRIR700 in NIR-PIT treated group showed significant decreases at each time point after NIR-PIT compared with that in non-PIT group (*p < 0.05, vs non-PIT group, Mann–Whitney U-test). (D) Time course analysis of IR700 fluorescence intensity in the NIR-PIT treated group. %TBRIR700 at each time point after NIR-PIT showed significant decreases in comparison with pretreatment %TBRIR700 (*p < 0.05, vs pretreatment %TBRIR700, paired t-test). %TBRIR700 24 and 48 h after PIT showed significant increases in comparison with %TBRIR700 immediately after NIR-PIT (**p < 0.05, vs %TBRIR700 immediately after NIR-PIT, paired t-test).
Changes of Luciferase Activity in Luciferase–Luciferin Photon-Counting Images after NIR-PIT.
To investigate changes of luciferase activity after NIR-PIT, the percentage of RLU based on pretreatment RLU (RLU Post/RLU Pre × 100 = %RLU) was evaluated. %RLU values showed 55 ± 24%, 44 ± 18%, 37 ± 15%, 30 ± 13%, 20 ± 14%, and 20 ± 16% for 0 min, 10 min, 20 min, 30 min, 24 h, and 48 h after NIR-PIT, respectively. %RLU after NIR-PIT was significantly lower at all times for the NIR-PIT treated group than for the non-PIT group in the early and late phases (p < 0.01 for 0 min, 10 min, 20 min, 30 min, 24 h, and 48 h after NIR-PIT) (Figure 3C). % RLU immediately after NIR-PIT showed an approximately 50% decrease compared with pretreatment %RLU and gradually continued to decrease thereafter indicating continuing cell death. %RLU after 30 min was significantly lower than that immediately after NIR-PIT (p < 0.01). %RLU in the late phase significantly decreased compared with that 30 min after NIR-PIT, respectively (p < 0.01 and 0.021 for 24 and 48 h after NIR-PIT, respectively) (Figure 3D).
Figure 3.

Luciferase–luciferin photon-counting imaging in response to NIR-PIT. (A) NIR-PIT outline. Luciferase–luciferin photon-counting images were scanned at each time point as shown. (B) Luciferase–luciferin photon-counting real-time images of A431-luc-GFP tumor bearing mice for NIR-PIT. Yellow arrows indicate the tumor. Luciferase activity continued to decrease in the early phase (0, 10, 20, 30 min later) after NIR-PIT. Luciferase activity in the late phase (24 and 48 h later) was lower than that 30 min after NIR-PIT. (C) Comparison of luciferase activity in A431-luc-GFP tumor bearing mice between non-PIT and NIR-PIT treated groups. %RLU in the NIR-PIT group showed significant decreases at each time point after NIR-PIT compared with that in the non-PIT group (*p < 0.05, vs non-PIT group, Mann–Whitney U-test). (D) Time course analysis of luciferase activity in the NIR-PIT treated group. %RLU at each time point after NIR-PIT showed significant decreases in comparison with pretreatment %RLU (*p < 0.05, vs pretreatment %RLU, paired t-test). Additionally, %RLU 24 and 48 h after NIR-PIT showed significant decreases in comparison with %RLU 30 min after NIR-PIT, respectively (**p < 0.05, vs %RLU 30 min after NIR-PIT, paired t-test).
Changes of GFP Fluorescence Intensity after NIR-PIT.
To investigate changes of GFP fluorescence intensity after NIR-PIT, the percentage of TBR change in GFP fluorescence imaging based on pretreatment TBR (TBR Post/TBR Pre × 100 = %TBRGFP) was evaluated. %TBRGFP values showed 99 ± 8%, 101 ± 11%, 99 ± 12%, 96 ± 9%, 27 ± 8%, and 14 ± 10% for 0 min, 10 min, 20 min, 30 min, 24 h, and 48 h after NIR-PIT, respectively. Only after 24 and 48 h NIR-PIT was the % TBRGFP significantly lower than that for the non-PIT group, respectively (p < 0.01 for 24 and 48 h after NIR-PIT), although there were no significant differences between the non-PIT and NIR-PIT treated groups in the early phases (Figure 4C). % TBRGFP in the early phase resulted in almost no change compared with pretreatment %TBRGFP (Figure 4D). %TBRGFP 24 and 48 h after NIR-PIT showed approximately 70 and 80% decrease on average, respectively.
Figure 4.

GFP fluorescence imaging in response to NIR-PIT. (A) NIR-PIT outline. GFP fluorescence images were scanned at each time point as shown. (B) GFP fluorescence real-time images of A431-luc-GFP tumor bearing mice for NIR-PIT. Yellow arrows indicate the tumor. GFP fluorescence intensity showed almost no change in the early phase (0, 10, 20, 30 min later) after NIR-PIT. GFP fluorescence intensity in the late phase (24 and 48 h later) was greatly lower than that before NIR-PIT. (C) Comparison of GFP fluorescence intensity in A431-luc-GFP tumor bearing mice between non-PIT and NIR-PIT treated groups. %TBRGFP 24 and 48 h after NIR-PIT showed significantly lower intensity in non-PIT group than in NIR-PIT treated group (*p < 0.05, vs non-PIT group, Mann–Whitney U-test). (D) Time course analysis of GFP fluorescence intensity in the NIR-PIT treated group. %TBRGFP only 24 and 48 h after NIR-PIT showed significant decreases in comparison with pretreatment % TBRGFP (*p < 0.05, vs pretreatment %TBRGFP, paired t-test).
Comparison of Signal Intensity among Imaging Modalities in Luciferase–Luciferin Photon-Counting and Fluorescence Images.
To investigate which imaging modalities best reflected cell death after NIR-PIT, %TBR and % RLU were compared for luciferase–luciferin photon-counting and fluorescence imaging. Immediately after NIR-PIT, % TBRIR700 was significantly lower than %RLU (p < 0.01), and %RLU was significantly lower than %TBRGFP (p < 0.01) (Figure 5A). After 10, 20, and 30 min, %TBRGFP was significantly higher than %TBRIR700 and %RLU, respectively (vs %TBRIR700, p < 0.01 for 10 min, 20 min, and 30 min after NIR-PIT; vs %RLU, p < 0.01 for 10 min, 20 min, and 30 min after NIR-PIT), although there was no significant difference between %TBRIR700 and %RLU (Figures 5B–5D). After 24 and 48 h, %RLU and %TBRGFP were significantly lower than % TBRIR700, respectively (%RLU, p < 0.01 for 24 and 48 h; % TBRGFP, p < 0.01 and p = 0.015 for 24 and 48 h, respectively), although there was no significant difference between %RLU and %TBRGFP (Figures 5E, 5F).
Figure 5.

Comparison of signal intensity after NIR-PIT among IR700 fluorescence imaging, luciferase–luciferin photon-counting imaging, and GFP fluorescence imaging. (A) Difference in signal intensity immediately after NIR-PIT. %TBRIR700 was significantly lower than %RLU (*p < 0.05, vs RLU ratio, paired t-test), and %RLU was significantly lower than %TBRGFP (**p < 0.05, vs %TBRGFP, paired t-test). (B) Difference in signal intensity 10 min after NIR-PIT. %TBRIR700 and %RLU were significantly lower than %TBRGFP, respectively (*p < 0.05, vs %TBRGFP, paired t-test). (C) Difference in signal intensity 20 min after NIR-PIT. %TBRIR700 and %RLU were significantly lower than %TBRGFP, respectively (*p < 0.05, vs % TBRGFP, paired t-test). (D) Difference in signal intensity 30 min after NIR-PIT. %TBRIR700 and %RLU were significantly lower than %TBRGFP, respectively (*p < 0.05, vs %TBRGFP, paired t-test). (E) Difference in signal intensity 24 h after NIR-PIT. %RLU and %TBRGFP were significantly lower than %TBRIR700, respectively (*p < 0.05, vs %TBRIR700, paired t-test). (F) Difference in signal intensity 48 h after NIR-PIT. %RLU and % TBRGFP were significantly lower than %TBRIR700, respectively (*p < 0.05, vs %TBRIR700, paired t-test).
DISCUSSION
Previous articles have shown that NIR-PIT induces necrotic and immunogenic cell death in treated tumor cells immediately after NIR light exposure as shown by morphological changes observed in the treated tumor cells such as the rapid volume expansion, cell membrane rupture, and release of cell contents into the extracellular space.5,7–9 Both acute and longer term imaging methods are needed to assess such changes in vivo.
IR700 fluorescence images showed greatly decreased intensity in the early phase after NIR-PIT, but IR700 fluorescence intensity increased in the late phase due to wash in of fresh IR-700-bearing APCs. This resulted in higher intensity at later time points than the other imaging modalities. This is likely due to wash in of fresh APCs which is enhanced by dramatic changes of up to 24-fold in vascular permeability, particularly to nanosized molecules, a phenomenon that has been termed “super-enhanced permeability and retention” (SUPR).24,25 SUPR also helps redistribute the APC within the tumor after NIR-PIT. This phenomenon can explain increased IR700 fluorescence intensity in the later phase. Considering that IR700 fluorescence intensity regresses after exposure of NIR light due to photobleaching or photochemical reaction, it is possible that IR700 fluorescence in the early phase expresses the delivery of NIR light to targeted tumors but will not reflect residual tumor viability after NIR-PIT. IR700 fluorescence imaging, therefore, is most useful in guiding the application of NIR light as successful activation will result in immediate bleaching. This is fortunate because it is potentially readily incorporated into human treatment as the IR700 is already present in the APC. However, it is important to remember that IR700 fluorescence does not necessarily reflect residual tumor viability after NIR-PIT.
In contradistinction, luciferase activity measured by luciferase–luciferin photon-counting imaging better reflects treatment effects. Luciferase–luciferin photon-counting images showed greater intensity reductions than GFP fluorescence images in the early phase and showed greater intensity reduction than IR700 fluorescence images in the late phase. Our results suggest that luciferase activity can express the decline of tumor viability both in the early phase after NIR-PIT and in the later phases of treatment response to NIR-PIT.16–19 NIR-PIT induces a rapid release of ATP from treated tumor cells5 leading to rapid reductions in luciferase–luciferin photon-counting. Luciferase–luciferin photon-counting images showed significantly lower intensity than GFP fluorescence images in the early phase and showed significantly lower intensity than IR700 fluorescence images in the late phase. Luciferase–luciferin photon-counting imaging is the most sensitive of the optical modality tested NIR-PIT effects.15 As a result, it is thought that luciferase–luciferin photon-counting imaging is the most suitable modality to monitor tumor viability in the acute phase after NIR-PIT. However, what should be noted is that luciferase–luciferin photon-counting is a very low-resolution procedure26 and has an obvious limitation that such imaging cannot be translated into humans at this time.
On the other hand, GFP fluorescence intensity had no significant decrease in the early phase after NIR-PIT, although remarkable decreases were seen in the late phase. Value as a biomarker of GFP fluorescence intensity in the late phase after NIR-PIT has been reported in previous articles,27,28 which support the results in the late phase in this study. The in vivo results differ somewhat from what is observed in vitro where lower GFP fluorescence is immediately observed after NIR-PIT.5 It is thought that, unlike in the in vitro condition, in vivo, the GFP protein has poor clearance from the tumor bed and will remain functionally intact within the extracellular space following extrusion from the cell. The relatively large molecular weight of GFP protein (27 kDa) might also influence this phenomenon. Thus, GFP fluorescence images do not reflect early changes after NIR-PIT but better reflect later changes. As with luciferase–luciferin photon-counting, this modality is most useful in the research setting.
NIR-PIT induces a rapid necrotic and immunogenic cell death.5,6 Among the three optical methods, luciferase–luciferin photon-counting imaging best demonstrates that early cell killing. This is consistent with the proposed mechanism of action of NIR-PIT and differs from what is found in conventional photodynamic therapy which induces a slower apoptotic cell death.29
The clinical usefulness of luciferase–luciferin photon-counting or endogenous protein fluorescence imaging is currently limited because neither method is approved for human use owing to concerns regarding immunogenicity and inherent limitations that the signal obtained from these imaging modalities is limited by depth of tumors in the body because of tissue absorption. Other imaging methods that do not suffer from similar limitations include magnetic resonance imaging (MRI) or 2-[18F]-fluoro-2-deoxy-D-glucose positron emission tomography (18F-FDG PET).30,31 However, these methods are much more difficult to perform in the acute post treatment setting. For now, except for IR700 fluorescence, they will remain the province of research. However, other, exogenously delivered optical imaging agents to monitor NIR-PIT may be useful as they could be performed during the treatment.
This study had several limitations. First, we used subcutaneous models to evaluate therapeutic effects of NIR-PIT in this study because luciferase–luciferin photon-counting and fluorescence imaging cannot evaluate deeper locations due to autofluorescence or tissue absorption. Actually, an orthotopic tumor model is much more clinically relevant compared with subcutaneously xenografted tumor model.32–35 However, in the present study, we focused on comparison among imaging modalities of luciferase–luciferin photon-counting and IR700/GFP fluorescence imaging in evaluating therapeutic effects after NIR-PIT. The orthotopic model also requires high surgical skills for proper implanting of the tumor. That is why we chose a simple subcutaneous xenograft tumor model in this study, but the adequacy in tumor location other than subcutaneous region has not been tested or validated. Second, strictly simultaneous scans of luciferase–luciferin photon-counting and fluorescence imaging were not performed in the acute phase after NIR-PIT because three different kinds of images were obtained from the same mouse. However, comparison of luciferase–luciferin photon-counting and IR700/GFP fluorescence images in the identical mouse was necessary for fairly comparing signal intensity among these different image modalities. Finally, we used the Maestro imaging system to evaluate GFP fluorescence in the present study, but it does not take advantage of the capabilities of GFP imaging at the cellular and subcellular levels. Since NIR-PIT affects cellular dynamics, cells labeled with GFP in the nucleus and red fluorescence protein (RFP) in the cytoplasm36–38 can be used with a proper magnifying imaging apparatus to detect nuclear–cytoplasmic interactions even in vivo due to NIR-PIT.39 Thus, further investigation is required for evaluation of therapeutic effects in early phase after NIR-PIT using fluorescence imaging.
In conclusion, this study revealed a significant acute phase response to NIR-PIT using in vivo luciferase–luciferin photon-counting and fluorescence imaging. IR700 fluorescence imaging can address the delivery of NIR light to tumor tissues during NIR-PIT. Luciferase–luciferin photon-counting imaging can indicate therapeutic effects in the early phase as well as in the late phase after NIR-PIT, while GFP fluorescence is slower to show therapeutic effects.
ACKNOWLEDGMENTS
This research was supported by the Intramural Research Program of the National Institutes of Health, National Cancer Institute, Center for Cancer Research.
Footnotes
The authors declare no competing financial interest.
REFERENCES
- (1).Mitsunaga M; Ogawa M; Kosaka N; Rosenblum LT; Choyke PL; Kobayashi H Cancer cell–selective in vivo near infrared photoimmunotherapy targeting specific membrane molecules. Nat. Med 2011, 17 (12), 1685–1691. [DOI] [PMC free article] [PubMed] [Google Scholar]
- (2).Green DR; Reed JC Mitochondria and apoptosis. Science 1998, 281 (5381), 1309–1312. [DOI] [PubMed] [Google Scholar]
- (3).Willingham MC Cytochemical methods for the detection of apoptosis. J. Histochem. Cytochem 1999, 47 (9), 1101–1109. [DOI] [PubMed] [Google Scholar]
- (4).Ziegler U; Groscurth P Morphological features of cell death. News Physiol. Sci 2004, 19, 124–128. [DOI] [PubMed] [Google Scholar]
- (5).Ogawa M; Tomita Y; Nakamura Y; Lee MJ; Lee S; Tomita S; Nagaya T; Sato K; Yamauchi T; Iwai H; Kumar A; Haystead T; Shroff H; Choyke PL; Trepel JB; Kobayashi H Immunogenic cancer cell death selectively induced by near infrared photoimmunotherapy initiates host tumor immunity. Oncotarget 2017, 8 (6), 10425–10436. [DOI] [PMC free article] [PubMed] [Google Scholar]
- (6).Sato K; Nagaya T; Nakamura Y; Harada T; Choyke PL; Kobayashi H Near infrared photoimmunotherapy prevents lung cancer metastases in a murine model. Oncotarget 2015, 6 (23), 19747–19758. [DOI] [PMC free article] [PubMed] [Google Scholar]
- (7).Mitsunaga M; Nakajima T; Sano K; Choyke PL; Kobayashi H Near-infrared theranostic photoimmunotherapy (PIT): repeated exposure of light enhances the effect of immunoconjugate. Bioconjugate Chem. 2012, 23 (3), 604–609. [DOI] [PMC free article] [PubMed] [Google Scholar]
- (8).Sato K; Watanabe R; Hanaoka H; Harada T; Nakajima T; Kim I; Paik CH; Choyke PL; Kobayashi H Photo-immunotherapy: comparative effectiveness of two monoclonal antibodies targeting the epidermal growth factor receptor. Mol. Oncol 2014, 8 (3), 620–632. [DOI] [PMC free article] [PubMed] [Google Scholar]
- (9).Nakajima T; Sano K; Mitsunaga M; Choyke PL; Kobayashi H Real-time monitoring of in vivo acute necrotic cancer cell death induced by near infrared photoimmunotherapy using fluorescence lifetime imaging. Cancer Res. 2012, 72 (18), 4622–4628. [DOI] [PMC free article] [PubMed] [Google Scholar]
- (10).Shirasu N; Yamada H; Shibaguchi H; Kuroki M; Kuroki M Potent and specific antitumor effect of CEA-targeted photo-immunotherapy. Int. J. Cancer 2014, 135 (11), 2697–2710. [DOI] [PubMed] [Google Scholar]
- (11).Mitsunaga M; Nakajima T; Sano K; Kramer-Marek G; Choyke PL; Kobayashi H Immediate in vivo target-specific cancer cell death after near infrared photoimmunotherapy. BMC Cancer 2012, 12, 345. [DOI] [PMC free article] [PubMed] [Google Scholar]
- (12).Sato K; Nakajima T; Choyke PL; Kobayashi H Selective cell elimination in vitro and in vivo from tissues and tumors using antibodies conjugated with a near infrared phthalocyanine. RSC Adv. 2015, 5 (32), 25105–25114. [DOI] [PMC free article] [PubMed] [Google Scholar]
- (13).Contag PR; Olomu IN; Stevenson DK; Contag CH Bioluminescent indicators in living mammals. Nat. Med 1998, 4 (2), 245–247. [DOI] [PubMed] [Google Scholar]
- (14).Weissleder R; Pittet MJ Imaging in the era of molecular oncology. Nature 2008, 452 (7187), 580–589. [DOI] [PMC free article] [PubMed] [Google Scholar]
- (15).Lembert N; Idahl LA Regulatory effects of ATP and luciferin on firefly luciferase activity. Biochem. J 1995, 305 (3), 929–933. [DOI] [PMC free article] [PubMed] [Google Scholar]
- (16).Sato K; Hanaoka H; Watanabe R; Nakajima T; Choyke PL; Kobayashi H Near infrared photoimmunotherapy in the treatment of disseminated peritoneal ovarian cancer. Mol. Cancer Ther 2015, 14 (1), 141–150. [DOI] [PMC free article] [PubMed] [Google Scholar]
- (17).Sato K; Nagaya T; Nakamura Y; Harada T; Choyke PL; Kobayashi H Near infrared photoimmunotherapy prevents lung cancer metastases in a murine model. Oncotarget. 2015, 6 (23), 19747–19758. [DOI] [PMC free article] [PubMed] [Google Scholar]
- (18).Nagaya T; Nakamura Y; Sato K; Harada T; Choyke PL; Kobayashi H Near infrared photoimmunotherapy of B-cell lymphoma. Mol. Oncol 2016, 10 (9), 1404–1414. [DOI] [PMC free article] [PubMed] [Google Scholar]
- (19).Harada T; Nakamura Y; Sato K; Nagaya T; Okuyama S; Ogata F; Choyke PL; Kobayashi H Near-infrared photo-immunotherapy with galactosyl serum albumin in a model of diffuse peritoneal disseminated ovarian cancer. Oncotarget. 2016, 7 (48), 79408–79416. [DOI] [PMC free article] [PubMed] [Google Scholar]
- (20).Hoffman RM The multiple uses of fluorescent proteins to visualize cancer in vivo. Nat. Rev. Cancer 2005, 5 (10), 796–806. [DOI] [PubMed] [Google Scholar]
- (21).Kimura H; Lee C; Hayashi K; Yamauchi K; Yamamoto N; Tsuchiya H; Tomita K; Bouvet M; Hoffman RM UV light killing efficacy of fluorescent protein-expressing cancer cells in vitro and in vivo. J. Cell. Biochem 2010, 110 (6), 1439–1446. [DOI] [PubMed] [Google Scholar]
- (22).Caysa H; Hoffmann S; Luetzkendorf J; Mueller LP; Unverzagt S; Mäder K; Mueller T Monitoring of xenograft tumor growth and response to chemotherapy by noninvasive in vivo multispectral fluorescence imaging. PLoS One 2012, 7 (10), No. e47927. [DOI] [PMC free article] [PubMed] [Google Scholar]
- (23).Tang Q; Nagaya T; Liu Y; Lin J; Sato K; Kobayashi H; Chen Y Real-time monitoring of microdistribution of antibody-photon absorber conjugates during photoimmunotherapy in vivo. J. Controlled Release 2017, 260, 154–163. [DOI] [PMC free article] [PubMed] [Google Scholar]
- (24).Sano K; Nakajima T; Choyke PL; Kobayashi H Markedly Enhanced Permeability and Retention Effects Induced by Photo-immunotherapy of Tumors. ACS Nano 2013, 7 (1), 717–724. [DOI] [PMC free article] [PubMed] [Google Scholar]
- (25).Kobayashi H; Choyke PL Super enhanced permeability and retention (SUPR) effects in tumors following nearinfrared photo-immunotherapy. Nanoscale 2016, 8 (25), 12504–12509. [DOI] [PMC free article] [PubMed] [Google Scholar]
- (26).Hoffman RM; Yang M Whole-body imaging with fluorescent proteins. Nat. Protoc 2006, 1 (3), 1429–1438. [DOI] [PubMed] [Google Scholar]
- (27).Sato K; Nagaya T; Choyke PL; Kobayashi H Near infrared photoimmunotherapy in the treatment of pleural disseminated SCLC: preclinical experience. Theranostics 2015, 5 (17), 698–709. [DOI] [PMC free article] [PubMed] [Google Scholar]
- (28).Sato K; Choyke PL; Kobayashi H Photoimmunotherapy of gastric cancer peritoneal carcinomatosis in a mouse model. PLoS One 2014, 9 (11), No. e113276. [DOI] [PMC free article] [PubMed] [Google Scholar]
- (29).Elmore S Apoptosis: a review of programmed cell death. Toxicol. Pathol 2007, 35 (4), 495–516. [DOI] [PMC free article] [PubMed] [Google Scholar]
- (30).Nakamura Y; Bernardo M; Nagaya T; Sato K; Harada T; Choyke PL; Kobayashi H MR imaging biomarkers for evaluating therapeutic effects shortly after near infrared photoimmunotherapy. Oncotarget. 2016, 7 (13), 17254–17264. [DOI] [PMC free article] [PubMed] [Google Scholar]
- (31).Sano K; Mitsunaga M; Nakajima T; Choyke PL; Kobayashi H Acute cytotoxic effects of photoimmunotherapy assessed by 18F-FDG PET. J. Nucl. Med 2013, 54 (5), 770–775. [DOI] [PMC free article] [PubMed] [Google Scholar]
- (32).De Lisle RC Characterization of the major sulfated protein of mouse pancreatic acinar cells: a high molecular weight peripheral membrane glycoprotein of zymogen granules. J. Cell. Biochem 1994, 56 (3), 385–396. [DOI] [PubMed] [Google Scholar]
- (33).Hoffman RM Orthotopic metastatic mouse models for anticancer drug discovery and evaluation: a bridge to the clinic. Invest. New Drugs 1999, 17 (4), 343–359. [DOI] [PubMed] [Google Scholar]
- (34).Hoffman RM Patient-derived orthotopic xenografts: better mimic of metastasis than subcutaneous xenografts. Nat. Rev. Cancer 2015, 15 (8), 451–452. [DOI] [PubMed] [Google Scholar]
- (35).Hoffman RM Patient-Derived Mouse Models of Cancer. In Molecular and Translational Medicine.; Coleman WB, Tsongalis GJ, Eds.; Humana Press: New York, 2017; pp 2197–7852. [Google Scholar]
- (36).Yamamoto N; Jiang P; Yang M; Xu M; Yamauchi K; Tsuchiya H; Tomita K; Wahl GM; Moossa AR; Hoffman RM Cellular dynamics visualized in live cells in vitro and in vivo by differential dual-color nuclear-cytoplasmic fluorescent-protein expression. Cancer Res. 2004, 64 (12), 4251–4256. [DOI] [PubMed] [Google Scholar]
- (37).Hoffman RM; Yang M Subcellular imaging in the live mouse. Nat. Protoc 2006, 1 (2), 775–782. [DOI] [PubMed] [Google Scholar]
- (38).Suetsugu A; Snyder CS; Moriwaki H; Saji S; Bouvet M; Hoffman RM Imaging the Interaction of Pancreatic Cancer and Stellate Cells in the Tumor Microenvironment during Metastasis. Anticancer Res. 2015, 35 (5), 2545–2551. [PubMed] [Google Scholar]
- (39).Yang M; Jiang P; Hoffman RM Whole-body subcellular multicolor imaging of tumor-host interaction and drug response in real time. Cancer Res. 2007, 67 (11), 5195–5200. [DOI] [PubMed] [Google Scholar]