

Abstract
Due to excellent separation capacity for complex mixtures of chemicals, comprehensive two-dimensional gas chromatography (GC × GC) is being utilized with increasing frequency for metabolomics analyses. This review describes recent advances in GC × GC method development for metabolomics, organismal sampling techniques compatible with GC × GC, metabolomic discoveries made using GC × GC, and recommendations and best practices for collecting and reporting GC × GC metabolomics data.
Keywords: Animal models, Biospecimens, Biotransformation, Comprehensive two-dimensional gas chromatography (GC × GC), Data reporting, In vitro analyses, Metabolomics, Multitrophic interactions, Sampling
1. Introduction
Metabolism, which is the sum of chemical reactions of an organism, can be investigated at multiple scales, from a singular biochemical reaction, to metabolic pathways, to cellular, multicellular, tissue, organism, and population-scale analyses. As a part of the functional genome [1], metabolic analyses shed light on the translation of genes, transcriptomes, and proteomes to phenotypes, and the influence of the environment on this process. Characterizations of changes in the metabolome as a function of an external or internal perturbation are important for understanding how development, disease, diet, toxins, medications, stress, the microbiome, etc. govern living systems, and metabolome studies are therefore relevant to a broad range of the basic biological sciences (Fig. 1). Metabolome data are also useful in the applied sciences and industry, and consequently are of high economic importance; for instance, metabolome data play a central role in the discovery of new pharmaceutical targets and diagnostic biomarkers, in the production of fermented foods and beverages, and in the development of novel biosynthetic pathways and bioremediation strategies (Fig. 1).
Fig. 1.
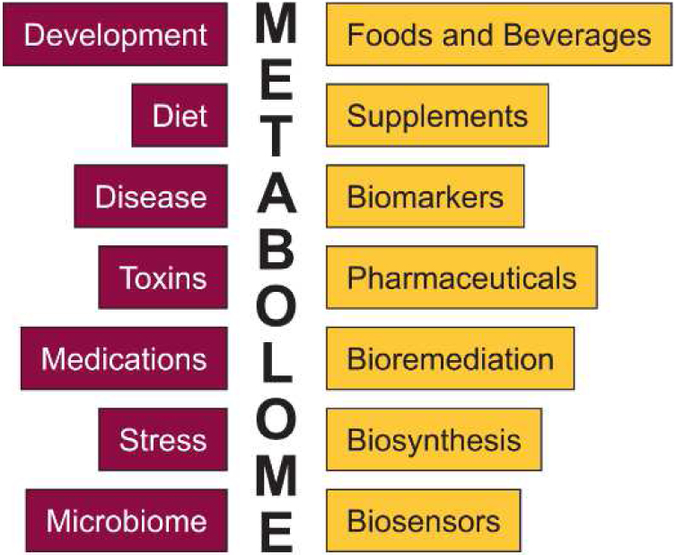
Metabolome data inform the influences of internal and external perturbations on biological systems (dark boxes, left), and have industrial, technological, and medical applications (light boxes, right).
As defined by Fiehn in a seminal review of metabolic analyses published in 2002 [2], studies typically fall into four broad categories based on the amount of the metabolome that is characterized, and the degree to which metabolites are identified:
Target analysis to measure the substrate or product of an enzyme or group of enzymes,
Metabolite profiling to identify and/or quantify a class of metabolites (e.g., fatty acid methyl esters (FAMEs)),
Metabolic fingerprinting to rapidly classify samples, where individual metabolites are not identified (e.g., via direct-injection mass spectral methods [3]), and
Metabolomics to comprehensively analyze the metabolome (or large fractions thereof), including identifying and quantitating individual metabolites.
Metabolomics aims to universally detect, characterize, and quantify all metabolites in a biological system [4], but of all of the ‘omics approaches (i.e., genomics, transcriptomics, proteomics), metabolomics is the most analytically challenging. Like mRNA transcripts and proteins, metabolites can be present in hugely disparate concentrations, from single molecules to mole fractions, and the absolute and relative concentrations are context specific. However, unlike nucleic acids and proteins, made up of combinations of 4 and 22 chemical moieties, respectively, the metabolome contains thousands to hundreds of thousands of unique chemical species [5]. No single analytical platform can separate and detect all metabolites in a specimen, and to-date, even in the extensively studied human metabolome that is predicted to contain over 114,000 total metabolites, more than 80% are yet to be detected [5]. The key to advancing the field of metabolomics is developing the analytical tools to detect, identify, and quantify unknown metabolites, the software tools to manage and process large quantities of raw metabolomics data, and the chemometric tools to extract information from the data [2, 5].
Due to excellent separation capacity for complex mixtures of chemicals, comprehensive two-dimensional gas chromatography (GC × GC) is being utilized with increasing frequency for metabolite profiling and metabolomics analyses [4]. Typically, when compared to one dimensional gas chromatography (GC), three to ten-fold more peaks are detectable using GC × GC [4], and therefore, GC × GC metabolomics is rapidly increasing the metabolic catalogs for microbes [6, 7], plants [8], animals [9], and humans [10]. Here, we review recent advances in GC × GC method development for metabolomics, organismal sampling techniques compatible with GC × GC, and a selection of GC × GC metabolomic applications and discoveries that, in our opinion, will push the boundaries of their fields. Additionally, we provide recommendations and best practices for collecting and reporting GC × GC metabolomics data and perspectives on the future directions of GC × GC in metabolomics. An excellent review of GC × GC and metabolomics was published by Almstetter, et al. in 2012 [4], so we have focused our efforts on reviewing studies that have been published since.
2. Method development for GC × GC metabolomics
There have been significant efforts and advancements in creating robust methods for generalized GC × GC analyses. However, there is still great need for the development of methods specialized for metabolomics, particularly validated protocols for specimen preparation, sampling, data collection, and data processing. Other reviews in this Special Issue summarize advancements in modulators, stationary phases, mass spectrometry, and novel instrumentation, but a few studies that are specifically focused on methods for metabolomics are reviewed here.
2.1. Sampling and sample preparation
Analytical robustness in metabolomics is significantly impacted by uneven extraction efficiencies across chemical families as well as sample inhomogeneity in solid and semi-solid specimens. Therefore optimized methods for sampling and sample preparation are critically important. Several recent studies explored the impact of sample preparation on the GC × GC metabolomes of tissues and viscous biofluids, and provide recommendations for obtaining more comprehensive and reproducible metabolomes.
The metabolic profiling of organs and tissues has been explored as a strategy to obtain a variety of information about human health, however, the amount of blood in the samples can distort the information gained from these approaches. To explore this, Ly-Verdú, et al. used GC × GC with time-of-flight mass spectrometry (TOFMS) to study the effects that phosphate buffered saline (PBS) perfusion may have on the metabolite composition of the liver, and whether or not perfusion may constitute an essential experimental step in liver profiling [11]. Livers were collected from healthy male mice, and were either perfused with PBS or unperfused prior to harvesting, homogenization, extraction, derivatization, and GC × GC analysis. Results following multivariate analysis revealed more than 35 metabolites significantly differed between the profiles of unperfused and perfused livers. The authors observed that the GC × GC metabolomes of perfused livers were slightly less variable and concluded that the presence of blood metabolites can interfere with interpreting liver-specific metabolism in some cases. As a result, the authors suggest that the choice to perfuse organ and tissue samples must be carefully considered in the context of each study hypothesis since the metabolome will be influenced by the presence or absence of blood.
Sputum is an oft-used specimen for lung metabolomics analyses, but its high viscosity and inhomogeneity can impact the recovery and reproducibility of metabolites. To determine the best pretreatment method for sputum prior to chloroform/methanol/water extraction, derivatization, and GC × GC analyses, Schoeman, du Preez, and Loots compared four protocols using sputum spiked with Mycobacterium tuberculosis, the causative agent of tuberculosis (TB) [12]. The four methods evaluated included incubations with 1) a 1:1 v/v ratio of sputum and Sputolysin (a concentrate of dithiothreitol in phosphate buffer), 2) a 1:1 v/v ratio of sputum and 0.5 N NaOH with 20% w/v N-acetyl-L-cysteine, 3) a 1:2 v/v ratio of sputum and 1 N NaOH, and 4) a simple homogenization of sputum with 45% ethanol in a 1:2 v/v ratio. In the first three methods the pretreated mixtures were centrifuged and the cell pellets harvested for further extraction, and in the fourth method the entire homogenate was retained and dried prior to CHCl3/CH3OH/H2O (1:3:1) extraction and silylation. By analyzing the extraction efficiency (i.e., number and intensity of compounds extracted), repeatability, limits of detection (LOD), and the predictive accuracy of biomarkers selected from the GC × GC metabolomes, they determined ethanol homogenization is the superior pretreatment method, which allowed them to identify 19 metabolic biomarkers of TB using only 250 μL sputum. While it is not surprising that the ethanol extraction method, which retains the entire sputum sample, produces the greatest number and concentration of metabolites (roughly 80% more than Sputolysin, in second place), it is interesting to note that it also generated metabolite profiles that were highly discriminatory between the M. tuberculosis spiked sputum vs. unspiked controls and these metabolites correctly classified TB-positive vs. TB-negative patient samples. These data suggest that the secreted M. tuberculosis metabolites serve as useful biomarkers, not just the intracellular metabolites, which may be the key to diagnosing the presence of TB disease using sputum specimens with typically low bacterial cell densities (< 105 cells/mL).
The success of untargeted metabolomics studies that utilize relative quantitative data (e.g., multi-marker studies, biomarker panel discoveries) relies upon the ability to reproducibly and quantitatively extract a wide variety of metabolites while mitigating matrix effects. Pérez Vasquez, Crosnier de bellaistre-Bonose, et al. developed a novel double extraction method to capture additional urine metabolites, and analyzed the derivatized compounds by GC × GC-qMS [13]. The first urine extraction was modified from a commonly-used procedure wherein urea is removed via urease incubation, then the organic acids are extracted via a liquid-liquid extraction with ethyl acetate. They performed the second extraction on the remaining aqueous phase, which was first incubated with triethylamine at pH 9, then extracted recursively with tetrahydrofuran. The organic phases from both steps were pooled and silylated for analysis. This time-intensive sample preparation protocol combined with greater peak resolution achieved by GC × GC-qMS facilitated the detection of 92 additional compounds in urine compared to a commonly-used sample preparation method and GC-MS analysis. The validated GC × GC method is used in their hospital to analyze urine samples of children with neurological disorders of unknown origin, and the authors posit that their approach may be adaptable for metabolic profiling of other body fluids, such as cerebrospinal fluid, saliva, or breath condensates.
Marney, Synovec, and colleagues explored how the ratio of sample mass to solvent volume impacts the extraction efficiency of soluble metabolites from mouse heart tissues by measuring the GC × GC-TOFMS signal intensity of eight representative metabolites: fumarate, malate, glutamate, citrate, succinyl-CoA, myo-inosotol, glycerol-3-phosphate, and glycerol [14]. By recursive extraction experiments on 40 mg tissue in 1 mL solvent (3:1:1 v/v/v CHCl3/CH3OH/H2O), they determined that five of the metabolites were quantitatively extracted on the first round, while fumarate, glycerol, and citrate required four to five extractions to achieve quantitative results. To determine a ratio of tissue mass to solvent volume that would yield more universally quantitative extraction in a single step, they measured the linearity and reproducibility of each metabolite when using 2 mL solvent to extract tissue at four masses ranging from 5 – 40 mg. They found that a 20 mg sample provided an average relative standard deviation (RSD) of 20-30% in their metabolomics analyses, which was sufficiently low to detect relevant metabolic changes in their experiments. These data show that efforts to optimize extraction efficiency and enhance reproducibility prior to specimen analysis will yield higher quality relative quantitation data when extraction is a significant source of variation in an experiment.
Uniform extraction efficiency is also a concern for volatile metabolomics analyses in which a sorbent is used for sampling. Solid phase microextraction (SPME) has become an essential gas phase sampling technique, and several sorbents are commercially available to optimize sampling for each investigation. Purcaro, et al. conducted an analysis of five different SPME fibers consisting of combinations of three sorbents – divinylbenzene (DVB), carboxen (CAR), and polydimethylsiloxane (PDMS) – to determine the best fiber and sampling conditions for analyzing the volatile metabolites of cell cultures infected with human rhinovirus [15]. Based on the normalized peak areas of 12 volatile and semi-volatile standards extracted from the cell culture media at 43°C for 30 min, they identified the DVB/CAR/PDMS triphase fiber as the best option for their analyses as it yielded the highest chromatographic peak areas. They further optimized their sampling method by using a central composite design and response surface modeling to identify the best time (15 – 45 min) and temperature (37 – 50°C) combination to yield the highest peak intensities for each individual standard. While six of their standards were modeled to produce the highest peak areas when sampled at 43°C for 30 min, the other six standards did not produce peak area maxima, and therefore quantitative sampling may not be achievable under the experimental parameters that were tested. Because SPME sampling is often performed in parallel to GC – GC analysis, there are practical limits to the length of the sampling period, which are usually limited by the duration of the GC – GC runtime. Therefore, unequal extraction rates are a significant concern for relative quantitation by SPME. Another factor that can impact quantitation is interanalyte displacement, which has been of persistent concern for DVB/CAR/PDMS triphase fibers, and could have played a role in the differences in optimal sampling conditions for the 12 standards used by Purcaro and colleagues. To determine the extent of this problem among SPME fibers, Risticevic and Pawliszyn analyzed the performance of seven commercial phases, measuring analyte extraction efficiency and sensitivity, desorption carryover, linear dynamic range, and interanalyte displacement by performing headspace (HS)-SPME on apple homogenates and analyzing the volatile profiles using GC – GC-TOFMS [16]. The DVB/CAR/PDMS triphase coating outperformed other phases on extraction efficiency, as reported by Purcaro and colleagues [15], but were also more prone to carryover and interanalyte displacement of a subset of metabolites in the apples. However, decreasing the extraction time significantly improved both issues, with the tradeoff of increasing the LOD for some analytes.
The physical properties of samples (e.g., ionic strength) also influence the number and concentration of volatile metabolites that are detected, and salt is routinely used to increase the partitioning of semi-volatile compounds from the liquid phase to the headspace. In a comprehensive analysis of urine volatile metabolomes by HS-SPME and GC × GC-TOFMS, Rocha, et al. considered the influence of pH on metabolite detection [17]. When comparing chromatograms of aliquots of the same urine sample at pH 5.8 (physiological), pH 2.0, and pH 12.0, more than 40% of the approximately 700 GC × GC peaks could be tentatively identified in the pH 2.0 and pH 12.0 samples, whereas only 163 compounds were identified in the physiological sample (pH 5.8). The highest chromatographic area and compound numbers were obtained under acidic conditions; therefore Rocha, et al. concluded untargeted urine volatile metabolomics should be performed at pH 2.0. However, they also noted that targeted analysis or metabolite profiling might be more appropriate at a higher pH, depending on the metabolites of interest.
2.2. Instrumentation
The majority of GC×GC analyses – metabolomics analyses included – are conducted using cryomodulation, which generates peak widths on the order of 100 ms. The narrowness of the peaks necessitates using MS detectors that can collect full scan spectra at a rate of 100 Hz to facilitate accurate peak quantitation and deconvolution. TOFMS is the most common method of ion separation used with GC × GC, capable of full spectrum collection rates up to 500 Hz, but these instruments are expensive, which limits accessibility. Compared to TOFMS, quadrupole mass spectrometers (qMS) are comparatively inexpensive, generally have a smaller footprint, and provide lower LODs via selected ion monitoring (SIM). However, typical “fast” qMS instruments have maximum acquisition rates of 20,000 amu/s, and therefore the mass spectral scan range will be restricted to 200 amu to meet the minimum scan rate for cryomodulation, which is often too narrow for metabolomics analyses, but can be sufficient for metabolic profiling.
GC × GC flow modulation is gaining in popularity and market share due to the significant advantage that it reduces consumable costs by forgoing the need for cryogens. Flow modulation produces broader peaks than cryomodulation, which reduces peak capacity and increases LODs, but the wider peaks are more compatible with qMS detectors. Tranchida, Mondello, and colleagues utilized qMS in a study to optimize a flow-modulated GC × GC method for the metabolic profiling of FAMEs [18]. After optimizing column diameters, gas flows, temperature programming, and modulation periods, they identified FAMEs in fish oil and human serum with limits of identification in the range of 100-200 pg on column, and limits of quantification (LOQ) as low as 3.4 pg in SIM mode. These results demonstrate that GC × GC-qMS is well suited for metabolite profiling, using only a few microliters of biofluid or micrograms of cells for analysis. Weinert, et al. set out to optimize GC × GC equipped with a fast-scanning qMS detector for large-scale untargeted metabolomics, and compared their results to TOFMS [19]. Their GC × GC-qMS method provided good separation in under an hour for 90% of the urine analytes detected by TOFMS. Scanning the range of m/z 60 – 500 at the maximum rate on the qMS (20,000 amu/s), they typically obtained 7 - 9 data points per peak above 10% peak height, providing good peak area and height precision (2.7 % and 2.4 % mean RSD, respectively). A potential concern with qMS is mass spectral skewing, which negatively impacts mass spectral library matching and peak alignment across chromatograms. Weinert, et al. quantitated skewing by a variety of metrics, observing 15 % mean RSD for apex spectra relative intensities (range 6.0 – 29.8 %) when they included trace-level peaks, and 10 % RSD (range 5.9 – 21.6 %) when trace peaks were excluded. While skewing was not insignificant, the quality and reproducibility of the apex spectra was sufficient for aligning the majority of peaks across their samples.
The application of high resolution (HR) mass spectrometry to GC × GC metabolomics is in its infancy, representing only three percent of the metabolomics studies published since 2012 (Appendix Table) [20-22]. The impact of using HRMS is greatest for untargeted metabolomics, where the accurate mass data provides molecular formulae for unknown compounds. However, their use remains niche because GC × GC-HRMS instruments are expensive, which precludes them from being purchased by most independent investigators. Further, the high resolution analyses generate very large data files, which makes them less amenable than nominal mass detectors for large scale comparative metabolomics studies for biomarker identification. As GC × GC metabolomics studies mature to the point of confirming the chemical identities of metabolites that were putatively identified in nominal mass analyses, the logical next step will be to obtain accurate mass data, and with that the proportion of publications that include GC × GC-HRMS data will increase.
Compared to MS detectors, vacuum ultraviolet absorption spectroscopy (VUVAS) has two significant hardware advantages: a small footprint and a lack of intensive vacuum requirements. Gruber, Groeger, et al. used a cryomodulated GC × GC-VUVAS to analyze four breath samples from an individual before and during a glucose challenge [23]. Results showed that detection with VUVAS, with selective monitoring for aromatics, provided similar performance to GC × GC-TOFMS, and gave good detection for small-oxygenated volatile metabolites (e.g. alcohols and ketones).
2.3. Data processing, analysis, and visualization
The ultimate goal of any GC × GC metabolomics analysis is to turn the data collected into chemical and biological information, which is strongly dependent upon reliable methods for processing, analyzing, and visualizing the data. The development of methods for GC × GC data processing and analysis is a rapidly-growing area, including novel approaches designed for metabolomics, or validated using metabolomics data [24-31]. Because this important topic is outside the authors’ area of expertise, we refer readers to the GC × GC chemometrics review in this Special Issue and other reviews [32] for details on recent advancements and recommendations in data processing.
3. Applications of GC × GC in metabolomics
Due to the complexity of the metabolome and the heterogeneity that exists within and between organisms, many metabolomics studies are begun using reductionist models (e.g., cell culture), and then may graduate to more complex model systems (e.g., animal models), biospecimens (e.g., urine, blood, tissue), and ultimately, living organisms in natural and artificial environments. While the in vitro experiments may lack direct translation to organismal-level metabolism in native environments, they do provide important information on fundamentals of metabolism, with broad accessibility and low costs (Fig. 2). In this section we highlight applications of GC × GC to in vitro cultures, analysis of biospecimens, and organisms, and we review studies that used interesting biological and analytical designs to investigate the underlying mechanisms of metabolism and the roles metabolites play in multitrophic interactions. The handful of studies we review in this section were selected to demonstrate how GC × GC metabolomics studies can facilitate discoveries and push the boundaries of their fields. A more comprehensive list of GC × GC metabolomics studies published between the end of 2011 and June 2018 is available in Appendix Table.
Fig. 2.

There are trade-offs between feasibility (i.e., costs, sample access) and translatability to living organisms for metabolomics experiments conducted with in vitro cultures, animal models, biospecimens collected non-invasively (e.g., urine, breath) or invasively (e.g., tissue biopsy), and in vivo or human studies.
3.1. In vitro analyses
The recent implementation of GC × GC for untargeted metabolomics of bacterial cultures has vastly expanded the volatile metabolome (or “volatilome”) catalog for human pathogens, which have been studied for decades using GC-MS. Bean, Dimandja, and Hill pioneered the use of GC × GC for untargeted bacterial volatile metabolomics with a characterization of the volatilome of Pseudomonas aeruginosa strain PA14, detecting 56 chromatographic peaks associated with the bacterium, which nearly doubled the published volatilome of this well-studied organism [33]. The ability to detect more chemical diversity in in vitro samples via GC × GC has facilitated the exploration of the biological diversity within species, and underscores the degree to which study design impacts the volatilome. In order to investigate strain-to-strain diversity, Bean, Rees, and Hill used GC × GC to compare the volatilomes of 24 clinical isolates of P. aeruginosa [7]. They were able to detect 391 chromatographic peaks associated with P. aeruginosa, of which only 70 volatiles were detected in all 24 isolates, termed the core volatilome. Using accumulation and rarefaction curves of the pan-volatilome and core volatilome, respectively, they showed that they analyzed a sufficient number of samples to capture the volatilome diversity of P. aeruginosa clinical isolates under the studied conditions. Their curves also show that to approximate the core metabolome (with a 50% inflation in its size), a median of 12 and minimum of three isolates were required, and the pan-volatilome – or the collection of all volatile metabolites produced – required a median of 14 and minimum of six isolates to cover 95% of the metabolome. These data demonstrate that defining the metabolome of a species based on a single specimen (or a small collection of specimens) is likely to be misleading.
Growth conditions can also significantly influence the microbial metabolome in in vitro analyses. In a study of nine clinical Klebsiella pneumonia isolates grown in four rich media (lysogeny broth, brain heart infusion, Mueller-Hinton broth, and tryptic soy broth), a total of 365 K.pneumoniae-associated volatiles were detected by GC × GC-TOFMS, of which only 10% were conserved across all media [34]. Using principle components analysis (PCA) of the volatilomes, Rees, Hill, and colleagues showed that the bacterial samples clustered based on their growth medium and not bacterial strain. This finding was true even when only the 36 volatiles that were conserved across all four media were used as variables in the PCA. Therefore, the volatilome of K. pneumoniae is strongly dependent on the growth medium used, and the authors conclude that the choice of medium should be carefully considered in microbial metabolomics studies. Together Rees’s [34] and Bean’s [7] findings underscore the challenge in capturing the essence of an organism’s metabolome with a single set of experiments, much less identifying in vitro growth conditions that can robustly mimic the in vivo infection environment. However, these experiments are still useful; the more variations in in vitro growth conditions we explore, the more we can understand the broad metabolic capabilities of individual organisms.
3.2. Animal models of human disease
Primates, pigs, mice, and rats are used extensively in biomedical research to model human diseases and treatments, and the use of GC × GC to measure metabolic changes in these model systems is rapidly expanding. Juul and colleagues have used a primate model and GC × GC-TOFMS to investigate metabolic changes of the fetal-to-neonatal transition in healthy [35] and diseased animals [36]. To establish the healthy metabolome, six late-preterm Macaca nemestrina were delivered via hysterotomy, with plasma drawn from cord blood and eight additional post-birth time points through 72 h of age. A total of 100 metabolites were identified, of which 23 exhibited significant changes in concentration over the 72 h sampling period and were categorized by their association with signaling pathways, glucose metabolism, carbohydrates, and amino acids [35]. Beckstrom, et al. proposed that these metabolites could be used as baseline markers of normal birth transition in future perinatal metabolomics research. Chun, Juul, and colleagues built upon that hypothesis by utilizing the M. nemestrina primate model to investigate the plasma metabolome of hypoxic ischemic encephalopathy (HIE), a common complication of birth that can lead to early and/or long-term neurodevelopmental consequences, including cerebral palsy or death [36]. They used GC × GC-TOFMS to analyze blood samples from 33 macaques that were exposed to 0, 15, or 18 minutes of in utero umbilical cord occlusion to induce HIE. They treated a subset of the animals by two methods, hypothermia or hypothermia + erythropoietin, and obtained serial blood samples at baseline, 0.1,24, 48, and 72 h after hysterotomy. They identified twelve potential biomarkers of HIE that showed statistically-significant differences between the diseased and control animal groups. By collecting neurodevelopmental data of the macaques up to nine months of age, they identified eight metabolites that were correlated to early and/or long-term outcomes, and four metabolites (citric acid, fumaric acid, lactic acid, and propanoic acid) that predicted death or cerebral palsy.
Mellors, Hill, and colleagues posited that macaques would also be excellent models for identifying breath biomarkers of TB for novel diagnostics in humans [37]. In a feasibility study, they used GC × GC-TOFMS to analyze breath from three cynomolgus macaques (M. fascicularis) and two rhesus macaques (M. mulatta) before and one to two months after M. tuberculosis infection. Using random forest (RF) analysis, they identified 49 compounds – represented strongly (65%) by hydrocarbons – that significantly changed during the course of infection. They demonstrated that breath sampling and analysis is feasible in animal models, and that breath metabolites can serve as useful markers of infection. The fact that the same animal models are being used in diverse GC × GC metabolomics studies (e.g., the three macaque studies described here [35-37]), and that metabolomes are being compared across model systems (e.g., primate, murine [38], and cell culture [39] models of TB) and with human specimens [12, 40-42], a more comprehensive view of the animal models’ applicability to human diseases can be built.
3.3. Human biospecimens
Because blood, serum, and plasma carry metabolites from all parts of the body and are routinely collected in a clinical setting, they are excellent biofluids for metabolomic analyses and the identification of biomarkers of disease. Winnike, Zhang, et al. compared the utility of GC-TOFMS and GC × GC-TOFMS in metabolic biomarker quantitation using pooled serum samples from 109 individuals, 54 of whom have a chronic neurodegenerative disorder [43]. When comparing metabolomic profiles between the healthy and unwell subject groups, 23 compounds detected by GC had statistically significant differences, compared to 34 detected using GC × GC. Similar advantages for metabolite detection were observed by Menéndez-Carreño et al., who developed and validated a method using GC × GC-TOFMS for phytosterol oxidation products (POPs) in human plasma [44]. Eleven POPs were spiked into human plasma samples to validate the detection method. The LODs and LOQs of GC × GC-TOFMS were found to be approximately 10-fold lower compared with GC-MS. In addition to the 11 known POPs, GC × GC facilitated the identification and quantitation of unsaturated brassicasterol and stigmasterol, reported in human plasma for the first time.
Like blood, urine is a rich source of metabolites from the entire body, and bears some significant advantages for biomarker research since it is plentiful and able to be collected non-invasively. Zhang, Brenna, and co-workers published a pair of studies in which they used GC × GC-qMS with positive chemical ionization (PCI) to detect complex steroid mixtures in urine of subjects on therapeutic steroid treatment [45] and of human athletes [46]. The steroids were extracted from urine, derivatized, and analyzed using GC × GC-qMS using either electron impact ionization (EI), CH4 PCI, or NH3 PCI.
Ionization with NH3 preserved structure-specific ions and the combination with GC × GC facilitated the identification of endogenous target steroids at physiological concentrations. Additionally, their results indicate that chromatographic structure provided by GC × GC may facilitate the detection of novel designer steroids in urine by anti-doping agencies. Luies and Loots measured urine metabolites to investigate host-pathogen interactions during active TB disease [41]. They extracted and derivatized the organic acid fraction of urine metabolites from 76 subjects: 30 TB-negative, and 46 with active TB. Using a multi-statistical approach on the 507 compounds they detected by GC × GC, they identified 12 metabolite markers in urine that could be used to distinguish the presence or absence of TB. The majority of the metabolic markers they discovered could be explained by changes in the host metabolome due to infection from M. tuberculosis. In particular, host fatty acid and aromatic amino acid metabolism is perturbed by infection, providing insights into symptom management and treatment.
Breath can be considered the headspace of the blood, and like urine, is plentiful and relatively easy to collect. Therefore, breath metabolomics is attractive for the development of sensitive, non-invasive diagnostics for a plethora of human ailments. To expand the catalog of the human breath volatilome, Phillips, et al. used GC × GC-TOFMS to analyze breath samples from 34 healthy individuals [10]. They detected approximately 2000 volatile metabolites, including numerous compounds that had not previously been described. Acetone, isoprene, benzene derivatives and alkane derivatives comprised the most abundant chemical species in the breath samples. Importantly, only 95 of these metabolites (out of the 2000) were shared among at least 90% of subjects, highlighting the inherent variation between individuals. This degree of variability indicates that human biomarker studies are likely to require large training cohorts and supervised machine learning methods to identify putative biomarkers, and independent testing cohorts to determine the accuracy of the biomarkers for predicting disease.
3.4. Non-human animals
A few GC × GC metabolomics studies have been published on animals that are not considered human analogs, but these experiments have interesting study designs and observations that are relevant to human investigations. Rocha, et al. used GC × GC-TOFMS to examine differences in the volatile metabolomes from homogenized and salted tissues of wild Venerupis decussata and V. philippinarum, which are clams that can be found in the same geographical locations, but in different positions in the water column [47]. An average of 229 compounds were detected per species. Using multivariate analyses to reduce their data set and identify the most discriminatory compounds, they found 63 metabolites that significantly differed between the two species. The authors posited that the differences they observed between the two species could be due to the differences in clams’ environments rather than their biology: dissimilarities in alkanes, alkenes, and terpenes were attributed to heterogeneous distributions of organic matter in the water column and marine sediments, while distinctions in aldehydes and alcohols were attributed to peroxidation of lipids from different dietary sources for the two species.
Rainbow trout (Oncorhynchus mykiss) naturally experience periods of starvation in their life cycle, which Baumgarner and Cooper hypothesized would cause different metabolic changes in different tissues [48]. They used GC × GC-TOFMS to compare the global metabolomes of serum, liver, and muscle tissues of 12 fish reared in captivity for two weeks, then split into two groups: six that were fed and six that were starved for four wks. They observed evidence that starved fish catabolize cellular protein in the liver for energy, but not in peripheral tissues. Additionally, they detected elevated xenobiotics (specifically n-alkanes) in fed fish that they posited were accumulated from fish food. However, in contrast to other xenobiotics, heptacosane was increased in starved fish, which they hypothesized was being liberated as specific tissues' energy reserves were being mobilized during starvation.
These two studies highlight a vexing complication of metabolomics analyses: parsing out metabolites versus xenobiotics, which we narrowly define here as exogenous substances that are accumulated from the environment and stored without chemical modification. Identifying xenobiotics is particularly difficult in cross-sectional studies of wild organisms, where past environmental conditions and exposures are not recorded. However, even experiments in captive organisms, like Baumgarner and Cooper’s trout study [48], cannot definitively separate metabolites from xenobiotics without chemical characterization of the environment (i.e., food and water) and longitudinal sampling of tissues and biofluids to document bioaccumulation and/or release of xenobiotics. Alternatively, catabolism and anabolism of organic compounds can be traced using stable isotopes, examples of which are described in Section 3.6.
3.5. Plants
GC×GC is being used to characterize the complex metabolomes of plants to understand wide-ranging aspects of their physiology, ecology, and qualities as feedstocks and foods. For this review, we have chosen to exclude plant metabolomics studies that focus on food plant quality (spoilage, ripening, flavor, or aroma) or authenticity, and instead refer the reader to other reviews published in this Special Issue, as well as additional recent reviews on the topic of GC χ GC foodomics [49, 50].
To characterize the volatile and semi-volatile metabolomes of maturing ‘Honeycrisp’ apples (Malus × domestics Borkh.), Risticevic, Pawliszyn, and colleagues developed and optimized direct immersion (DI)-SPME for in vivo sampling [51]. In an earlier comparison of HS-SPME versus DI-SPME sampling of apple homogenates using a triphase fiber (DVB/CAR/PDMS), they obtained a 63% increase in metabolites using the latter method (555 vs. 906 compounds), and observed less bias against high molecular weight and polar metabolites [8]. For in vivo sampling Risticevic, et al. used DVB/CAR/PDMS fibers overcoated with PDMS, which were exposed to the apple tissue at a depth of 3 cm for 60 min at ambient temperatures. To remove interfering tissue material prior to analysis, they cleaned the fibers with lint-free wipes, washed the fibers in nanopure water for 10 s, then wiped the fibers again. By sampling in triplicate five apples of early maturity and five apples of late-harvest maturity, they found that inter-specimen variance was high, but they were able to clearly define the two groups of apples based on PCA of 225 peaks that were manually curated based upon high chromatographic quality.
As part of their natural defense systems, plants produce metabolites that deter attacks by other organisms. Wojciechowska, Geisen, and co-workers investigated the metabolic differences between two strains of tomatoes (Schmucktomate (ST) and Resi), which show differential resistance to the common fungal pathogen, Alternaria altemata [52]. They performed untargeted GC × GC metabolomics on the polar metabolites of ST and Resi, reproducibly detecting 267 metabolites from the tomatoes. Using volcano plot analysis, they identified 21 metabolites that were significantly elevated in ST, with chlorogenic acid (CGA) being the most discriminatory. Wojciechowska, et al. experimentally confirmed that CGA protects tomatoes from A. alternata colonization in a dose-dependent manner. Hantao, Augusto, and colleagues also used HS-SPME/GC × GC-qMS coupled with multivariate data analyses to identify biomarkers of Eucalyptus fungal infections [53], as well as disease-resistant clones [54]. Comparing biogenic volatile organic compounds produced by Eucalyptus globulus with and without infection by Teratosphaeria nubilosa fungus, they identified more than 40 volatiles that are putative biomarkers of infection [53]. Hantao, et al. also aimed to speed the selection of disease-resistant Eucalyptus hybrids by identifying volatile biomarkers of resistance to Eucalyptus rust [54]. They compared the volatilomes of E. grandis × E. urophylla hybrids resistant and susceptible to Puccinia psidii fungal infection, identifying two resistance biomarkers: eucalyptol and α-terpinyl acetate.
3.6. Moving toward metabolic mechanisms
Most of the published GC χ GC metabolomics studies are descriptive, where the primary aim was to discover previously unidentified metabolites in a specimen, organism, or organismal interaction. While there is boundless need for these kinds of analyses, the data will obtain their greatest meaning when we are able to tie the metabolites to cellular mechanisms that produce or regulate their production, phenotypes they create, or interactions they facilitate. With these types of investigations, the data become information. Several groups are venturing in that direction by tying GC × GC metabolomics data to other chemical, biological, behavioral, and statistical analyses that contextualize the metabolome.
In vitro digestion models combined with GC × GC metabolomics have been used in two studies to characterize biotransformation of polyphenols in vivo. Aura, et al. measured the metabolic fate of polyphenols from Syrah red grapes, Syrah red wine, and extracted proanthocyanidins (PA) using a colonic model with fecal microbiota [55]. They observed a higher degree of C1-C3 phenolic acid formation from red wine than the fruit or PA in the colonic model. Vetrani and colleagues investigated the roles of the liver and of gut microbiota on transforming ingested polyphenols [56]. They analyzed the urine metabolomes of subjects consuming polyphenol-rich foods and beverages, and compared these data to the metabolomes generated by fecal microbiota fed the same diets in an in vitro colon model, and to hepatocytes cultured with green tea extracts. They found several associations between the urinary and colonic model metabolomes that partially explained polyphenol biotransformation in vivo, but complementing the colon model with hepatic metabolism significantly increased the correlation between in vivo and in vitro metabolism.
A technique that facilitates metabolic mapping is stable isotope labeling, which was employed by Žáček, Válterova, and coworkers to investigate the metabolic fate of dietary fatty acids (FAs) in the biosynthesis of bumblebee male marking pheromones [9]. The investigators fed or injected three species of bumble bees, Bombus lucorum, B. lapidaries, and B. terrestris, with 2H- or 13C-labeled C12, C14, C16, and C18 saturated FAs, then later harvested and analyzed the fat bodies and labial glands to characterized how the FAs had been stored and modified. They determined that FAs were stored as triacylglycerols in the fat body, and then modified and used for biosynthesis of pheromone precursors and pheromonal components. Importantly, Žáček et al. included an analysis on the effect of deuterium and carbon isotopes on the first and second dimension retention times (1tR and 2tR, respectively) in GC × GC. They observed larger shifts in 1tR with perdeuterated FAs (versus 13C-labeled FAs), and therefore used 2H labels for most analyses so they could more easily detect and quantify trace amounts of the labeled compounds in their untargeted analyses, even when a thousand times more unlabeled compound may be present. However, for confirmations of bioactivity, they relied upon the 13C-labeled FAs since the deuterated compounds can affect metabolism.
Cordero and colleagues used HS-SPME/GC × GC-qMS to investigate the metabolome of multitrophic interactions between mint plants (Mentha spp.) and their insect predator, the mint beetle (Chrysolina herbacea) [57. 58]. The first study explored how the mint beetle is able to tolerate the mono-terpenoids produced by the plant as a defense against insect herbivory [57]. They measured the volatile metabolomes of three different species of mint – two susceptible and one resistant to the pest – identifying four characteristic mint terpenoids in addition to 76 additional volatiles emanating from the leaves. By comparing the beetle frass (excrement) volatiles to the mint species on which they were reared, they were able to determine that the insects are biotransforming the toxic terpenoids during digestion, primarily by oxidation and acetylation. In a follow-up study, Pizzolante, et al. investigated the role of the gut microbiota in metabolizing Mentha aquatica terpenoids into sex-specific volatiles in beetle frass [58]. They identified 60 volatiles in the mint leaves and in beetle frass, including 9 terpenoid compounds that were nearly absent in the leaves but abundant in the frass, indicative of biotransformation of plant compounds during digestion. Additionally, they observed significant differences between the volatile metabolites in male and female frass that corresponded to differences in the cultivable species of bacteria that are found in their guts. To establish that the gut microbes were capable of metabolizing and biotransforming M. aquatica volatiles, they grew 16 C. herbacea gut bacterial isolates (10 from females, 6 from males) on mint extracts and measured the volatiles that were produced. They confirmed that the female and male gut microbiota biotransform the mint metabolites in unique ways, which they hypothesized may contribute to C. herbacea sex pheromone production.
As illustrated by these examples, deriving meaning from metabolic data requires a multidisciplinary approach. The most successful studies arise from deep collaborations between experts in disparate fields – chemistry, biology, medicine, mathematics – where all parties are involved in every stage of the project, from development to data analysis and publication.
4. Recommendations and best practices
The growth of the field of metabolomics is reflected by the recent investments by the National Institutes of Health (NIH) into the Common Fund Metabolomics program, which supports technology development, infrastructure, training, and an international repository for metabolomics data, the Metabolomics Workbench (metabolomicsworkbench.org) [59]. The goal is to generate publicly accessible metabolomics data, following the models of data sharing for genomics and transcriptomics via the GenBank and Gene Expression Omnibus (GEO) databases, respectively. Currently, depositing metabolomics data into public repositories is only encouraged under the NIH Data Sharing policies; however, it is possible that in the near future journal publishers may require data sharing as a condition of publication, as in genomics and transcriptomics. Under ideal circumstances, metabolomics databases will facilitate meta-analyses of multiple metabolomics experiments to generate new hypotheses and enhance translation of the data to practical applications in industry, medicine, and policy. In practice, achieving these ideals will require meticulous reporting of experimental metadata and very well designed experiments.
The Metabolomics Workbench and the Chemical Analysis Working Group (CAWG) Metabolomics Standards Initiative (MSI) [60] provide excellent guidelines on the biological and analytical metadata that should be included with metabolite data, and these parameters should be considered during experimental planning. When obtaining samples, thoughtful choices should be made regarding the source and selection of specimens, and data should be provided on the taxonomy of species, organs and tissues, cell types/lines, and strains. More detailed information such as animal husbandry, diet, growth media, and human data such as age, sex, body mass index, etc., are encouraged, as they can all impact metabolism. The CAWG provide detailed lists of analytical metadata to report for sample preparation, injection, separation, detection, method validation, and data preprocessing. Additionally, they provide recommendations on reporting the certainty to which chemical identity of metabolites have been determined using retention times/indices and mass spectral data [60]. Here, we review some important findings from GC × GC metabolomics studies that support the recommendations by the CAWG and inform clinical and analytical study design, and we make some recommendations for GC × GC metabolomics experiments to improve robustness and data sharing potential.
4.1. Clinical design and confounders
The Karlsruhe Metabolomics and Nutrition (KarMeN) Study is a large German cohort study (n = 301) of blood and urine metabolomes from healthy non-smoking adults [61]. Targeted and untargeted metabolomics analyses were performed using LC-MS/MS, 1H NMR, GC-MS, and GC × GC-MS, and metabolic differences due to body composition, age, sex, physical activity and diet are being characterized in the KarMeN Study. Due to the size of the cohort, the data being collected about each subject, and the variety of analytical techniques being applied, the metabolomics data from this study are providing a wealth of information on human health and metabolomics study design. A striking finding from their analysis is the degree to which the fasting plasma and urine metabolomes correlate with subject gender and age [62]. Using machine learning algorithms on the combined metabolomics data from all four analytical platforms, Rist and colleagues found that they could correctly predict the sex of the study participants with > 90 % accuracy from the urine metabolome, and > 95% accuracy from plasma. The correlation of the plasma and urine metabolomes to age were weaker, but still significant. A subset of the plasma metabolites in men correlated with age with R2 = 0.77, and a combination of plasma and urine metabolites in women predicted menopausal status with 90% accuracy. This study of healthy adults demonstrates that both sex and age are confounders of the human metabolome, and the authors recommend that sex, age, and sex-age interactions are included in statistical analyses of metabolomics data and reported with published results.
4.2. Chromatography
To obtain high-quality GC × GC metabolomics data, it is imperative to use the best chromatography available, as the data processing methods, chemometrics, and statistical analyses are only as good as the separations. There have been exciting developments in stationary phases and column configurations to optimize separations (reviewed in this Special Issue), however, phase thickness and phase ratio [63] are also important parameters to consider, which are often overlooked. While deconvolution procedures can enable identification and quantification of partially co-eluting peaks, they are impaired when peak shapes are compromised by column overloading. The problems created by poor peak shapes are compounded when multiple samples need to be aligned prior to downstream analyses [64]. Optimally, to obtain excellent data for mixtures of metabolites at concentrations that differ by many orders of magnitude, it is advisable to perform split and splitless injections and combine the data [64, 65]. However, this approach requires more supervised preprocessing and therefore is not amenable for large studies. An effective compromise can be reached by increasing stationary phase film volume by using thicker films and/or larger diameter columns, which increases loadability and therefore improves peak shapes for high concentration metabolites, but which requires longer separation times [66-68].
4.3. Sample handling and batch effects
Sample handling and batch effects can play a significant role in metabolomics analyses, as described by Nizio, Forbes, and colleagues, [69] and should be closely controlled and accurately reported. Nizio, et al. set out to compare the volatilomes of six bacterial species, preparing four biological replicates of each bacterium and growth condition. Two biological replicates for each sample type were stored at −18°C for 2-5 d prior to GC × GC analysis, and the other two replicates were stored at −18°C for 48-50 d. They observed that the samples stored long-term produced more complex volatile profiles, as 200 more volatile metabolites were detected per sample, on average, compared to short-term storage. As a result, they posited that sample contamination, degradation, and/or biological activity may have contributed volatiles during storage [69]. However, a study by Wandro, et al., designed to test the stability of metabolites in cold storage [70] suggests that other factors may have been at play in Nizio’s study. Wandro and colleagues measured the change in metabolites of sputum stored at 4°C, −20°C, and −80°C for up to eight weeks before extraction, derivatization, and GC-MS analysis was performed in a single batch. Samples stored at 4°C showed appreciable changes in their metabolome after one day of storage, whereas samples stored at −20°C for 1-56 days were statistically indistinguishable from samples stored at −80°C.
While Wandro’s study does not specifically address the stability of volatile metabolites, which Nizio and colleagues were reporting, an important confounder to consider in Nizio’s study is batch effects caused by instrumental drift, which can impact peak areas, and consequently metabolic profiles. In a five week long GC × GC-qMS run of 300 urine samples, Weinert et al., quantified the intra-day, inter-day, and inter-week RSD in peak height of 15 internal standards [19]. The intra-day and inter-day reproducibility was good (< 10 %), but despite weekly system maintenance to minimize matrix impacts (e.g., liner exchange, MS tuning), they observed a steady increase in peak heights of their internal standards (which was not explained by baseline drift), creating a mean inter-week RSD of 18 %. Weinert and colleagues did not use the internal standards to correct for the drift, as this method of normalization increased inter-week RSD of their sample analytes. However, the use of internal standards allowed them to track the performance of their system and quantify and report time-dependent variation in their data.
It is important to be aware of the natural structure of each study’s GC × GC metabolomics data, especially in biomarker studies or other comparative analyses, so that biases can be accounted for and potentially corrected. An easy method to identify data structures that are not attributed to biological differences (e.g., batch effects) is to use PCA [71]. Figure 3 is an illustration of how we used PCA to uncover batch effects in a bacterial volatile metabolomics study of 81 P. aeruginosa clinical isolates analyzed in biological triplicates along with 15 media blanks. To briefly describe this study, isolates from 16 subjects, who provided 3-35 bacterial isolates over a span of at least five years of their chronic lung infections, were obtained from a biorepository. The 81 isolates were divided into two groups for HS-SPME/GC × GC-TOFMS volatile metabolomics, with 32 isolates placed into a “priority” group for the generation of preliminary data for a grant proposal, and the other 49 isolates placed into a “non-priority” group. Isolates from 11 subjects were divided between the priority and non-priority groups, while the isolates from five subjects were all in one group or the other. To minimize batch effects within each group, the order in which the isolates and their individual biological replicates were cultured and analyzed were randomized. Between culturing and analysis, samples were stored at −20°C, with a maximum storage time of 13 d. Table 1 summarizes the time frames for the preparation and analysis of the study samples.
Fig. 3.

PCA score plot of GC × GC metabolomics data of 258 bacterial samples and 472 metabolites, with samples colored based on priority vs. non-priority preparation batches (a), sample storage time (b) or analysis day (c). Peaks were normalized across samples to account for dilution effects, log10-transformed, and mean-centered and scaled to unit variance.
Table 1:
Summary of GC × GC metabolomics study of 81 bacterial isolates
| Full Study | Priority | Non-Priority | |
|---|---|---|---|
| Subjects | 16 | 14 | 13 |
| Isolates | 81 | 32 | 49 |
| Sample Prep | Sep 10 - Oct 6 | Sep 10 - 16 | Sep 24 - Oct 6 |
| Sample Analysis | Sep 23 - Oct 12* | Sep 23 - 29** | Sep 29 - Oct 12 |
During this period the columns and the inlet liner were not changed. The SPME fiber was replaced Oct 5 (analysis day 13).
Due to an error in the sequence table, one sample in the priority group had to be re-prepared and analysed on Oct 3 (analysis day 11).
All 258 chromatograms from both groups were processed, aligned, normalized, and statistically analyzed together. Without any prior feature selection, we performed PCA on all metabolite variables and sample observations, which shows that while the most significant variance in the metabolomes is accounted for by the metabolic differences between isolates and the media blanks (Fig. 3; PC1, 19.7%), approximately 10% of the sample variance is explained by priority vs. non-priority grouping (i.e., preparation batch), with samples in the priority group clustering in PC2 > 0, and samples in the non-priority group in PC2 < 0. As indicated by the marker colors in Fig. 3b, there is bias in the storage times between the priority and non-priority groups, but short and long storage times do not sufficiently explain the PC2 variance. Instrumental drift (visualized by analysis day, Fig. 3c) and growth media batches (not shown) also do not fully explain the separations in PC2. While we do not know all of the factors contributing to our data’s structure, this unsupervised analysis of the entire data set revealed inherent correlations between a subset of the metabolites and the sample preparation batch. With this knowledge we can either exclude the batch-correlated metabolites from subsequent multivariate analyses, and/or conduct post-hoc testing for priority vs. non-priority group biases in the outcomes of supervised machine learning analyses of these data.
To minimize batch effects the unattainable ideal is to prepare or collect samples in a single small batch, store them for the same amount of time under the same (frozen) conditions, and analyze them in a single small batch. However, in practice it is not possible to meet these criteria when analyzing large numbers of samples or performing longitudinal studies. At a minimum, it is recommended that biological or technical replicates are obtained when possible, samples and replicates are prepared or collected in random order, and analyzed in a different random order. Most importantly, recognize that batch effects are impossible to avoid entirely and can arise due to unknown variables in sample collection, preparation, and analysis; therefore biases in the metabolomics data should be quantified, potentially corrected, and always reported.
4.4. Statistical analyses and overfitting
The large number of metabolites that are revealed by GC × GC analyses causes a statistical conundrum, wherein the number of variables is often one or two orders of magnitude larger than the number of observations made. Therefore, statistical models that are employed to identify differences in group comparisons (e.g., putative biomarkers of disease) are at risk of overfitting. To address this problem, it is becoming more common for investigators to use multiple statistical models to identify the most discriminatory metabolites, and report the consensus set as the putative biomarkers of disease. For example, Phillips, et al. identified breath biomarkers of therapeutic radiation exposure by analyzing the breath of 31 individuals who received varying doses of radiation (180-1200 cGy/d) over five days [72]. Multiple Monte Carlo simulations were used to identify approximately 50 metabolites that significantly changed pre and post radiation. The 15 breath volatiles that were observed in 7 of 8 simulations were 99% accurate in identifying subjects who received at least 1.8 Gy. The approach of using multiple statistical analyses to identify putative biomarkers has been used in several other GC × GC metabolomics studies of lung specimens. To identify biomarkers of M. tuberculosis infection, du Preez and Loots analyzed methanol-extracted metabolites from the sputum of 61 TB-negative and 34 TB-positive subjects, detecting a total of 498 metabolites [40]. They applied a combination of supervised and unsupervised univariate and multivariate statistical analyses to select 22 metabolite markers of infection, which were identified as putative biomarkers by all three statistical methods (PLS-DA, fold-change, and t-tests). Beccaria et al. used GC × GC-TOFMS to identify M. tuberculosis infection biomarkers in breath [42]. By using three cutoffs for the frequency of observation of 1513 volatiles in 34 breath samples (20 %, 50 %, and 80 %), they generated three pools of variables for RF analysis. Twenty two breath volatiles were in common across all three RF analyses, which the authors considered the most promising leads for discriminating TB-positive and TB-negative breath samples.
5. Concluding remarks
Comprehensive two-dimensional gas chromatography is gaining popularity for metabolomics analyses, and has significantly expanded the metabolic catalogs of microbes, plants, animals, and humans. The field is progressing into studies of causality by incorporating longitudinal analyses, isotopic tracers, flux analysis, model systems, and multitrophic interactions into GC × GC metabolomics analyses. However, despite the clear analytical advantages that GC × GC offers for characterizing complex mixtures, especially for untargeted metabolomics studies, its adoption by new users is relatively slow. A significant barrier to growth is the availability of user-friendly software that can handle the entire data processing and analysis pipeline. While there have been brisk advancements in investigator-developed packages for peak picking, peak alignment, deconvolution, etc. [32, 73], utilizing them requires fluency with Matlab, R, Python, and/or other programming languages. The ideal software platform will incorporate a user-friendly interface and several different approaches for each step in the data analysis pipeline, allowing users to optimize the workflow for their particular samples. Obtaining the GC × GC metabolomics peak list is just the first step of linking the chemical data to biology, and as future studies aim to integrate metabolomics with transcriptomics, proteomics, and genomics information, easily-manipulated graphical displays of chromatographic and statistical data will be required.
For GC × GC metabolomics to be adopted by new investigators, and for the field of metabolomics, writ large, to continue to receive new investments, we in the field must demonstrate that the data we are generating are of high quality and can be independently validated. This requires excellence in study design, sample collection and storage, chromatographic analysis, data processing, and statistical analyses, and in order to objectively judge quality in all of these domains we must record and report ample metadata for all steps. It is not only incumbent upon investigators to be diligent in these pursuits, but also upon manuscript peer reviewers and journal editors to insist that methods are fully described and statistical evaluations of the data are appropriate and complete. Only with this level of rigor will GC × GC metabolomics become an essential component of any multi-omics study design.
Supplementary Material
Highlights:
The excellent separation capacity of GC × GC is well suited for metabolomics
Methods are being developed to optimize metabolome sampling and analysis
GC × GC metabolome analyses are moving toward identifying mechanisms
Data reporting recommendations are provided to optimize data sharing via new metabolomics databases
Best practices for GC × GC metabolomics analyses are described
Acknowledgements
This research did not receive any specific grant from funding agencies in the public, commercial, or not-for-profit sectors. Bacterial isolates were provided by the Cystic Fibrosis Foundation, CF Isolate Core at Seattle Children’s Research Institute (NIH P30 DK089507).
Footnotes
Publisher's Disclaimer: This is a PDF file of an unedited manuscript that has been accepted for publication. As a service to our customers we are providing this early version of the manuscript. The manuscript will undergo copyediting, typesetting, and review of the resulting proof before it is published in its final citable form. Please note that during the production process errors may be discovered which could affect the content, and all legal disclaimers that apply to the journal pertain.
References
- [1].Patti GJ, Yanes O, Siuzdak G, Metabolomics: The apogee of the omics trilogy, Nat. Rev. Mol. Cell Biol, 13 (2012) 263. [DOI] [PMC free article] [PubMed] [Google Scholar]
- [2].Fiehn O, Metabolomics - the link between genotypes and phenotypes, Plant Mol. Biol, 48 (2002) 155–171. [PubMed] [Google Scholar]
- [3].Gonzalez-Dominguez R, Sayago A, Fernandez-Recamales A, Direct infusion mass spectrometry for metabolomic phenotyping of diseases, Bioanalysis, 9 (2017) 131–148. [DOI] [PubMed] [Google Scholar]
- [4].Almstetter M, Oefner P, Dettmer K, Comprehensive two-dimensional gas chromatography in metabolomics, Anal. Bioanal. Chem, 402 (2012) 1993–2013. [DOI] [PubMed] [Google Scholar]
- [5].Wishart DS, Feunang YD, Marcu A, Guo AC, Liang K, Vázquez-Fresno R, Sajed T, Johnson D, Li C, Karu N, Sayeeda Z, Lo E, Assempour N, Berjanskii M, Singhal S, Arndt D, Liang Y, Badran H, Grant J, Serra-Cayuela A, Liu Y, Mandal R, Neveu V, Pon A, Knox C, Wilson M, Manach C, Scalbert A, Hmdb 4.0: The human metabolome database for 2018, Nucleic Acids Res, 46 (2018) D608–D617. [DOI] [PMC free article] [PubMed] [Google Scholar]
- [6].Rees CA, Franchina FA, Nordick KV, Kim PJ, Hill JE, Expanding the Klebsiella pneumoniae volatile metabolome using advanced analytical instrumentation for the detection of novel metabolites, J. Appl. Microbiol, 122 (2017) 785–795. [DOI] [PubMed] [Google Scholar]
- [7].Bean HD, Rees CA, Hill JE, Comparative analysis of the volatile metabolomes of Pseudomonas aeruginosa clinical isolates, J. Breath Res, 10 (2016) 047102. [DOI] [PMC free article] [PubMed] [Google Scholar]
- [8].Risticevic S, DeEll JR, Pawliszyn J, Solid phase microextraction coupled with comprehensive two-dimensional gas chromatography–time-of-flight mass spectrometry for high-resolution metabolite profiling in apples: Implementation of structured separations for optimization of sample preparation procedure in complex samples, J. Chromatogr. A, 1251 (2012) 208–218. [DOI] [PubMed] [Google Scholar]
- [9].Žáček P, Kindl J, Frišonsová K, Průchová M, Votavová A, Hovork O, Kovalczuk T, Valterová I, Biosynthetic studies of the male marking pheromone in bumblebees by using labelled fatty acids and two-dimensional gas chromatography with mass detection, ChemPlusChem, 80 (2015) 839–850. [DOI] [PubMed] [Google Scholar]
- [10].Phillips M, Cataneo RN, Chaturvedi A, Kaplan PD, Libardoni M, Mundada M, Patel U, Zhang X, Detection of an extended human volatome with comprehensive two-dimensional gas chromatography time-of-flight mass spectrometry, PLoS ONE, 8 (2013) e75274. [DOI] [PMC free article] [PubMed] [Google Scholar]
- [11].Ly-Verdú S, Schaefer A, Kahle M, Groeger T, Neschen S, Arteaga-Salas JM, Ueffing M, de Angelis MH, Zimmermann R, The impact of blood on liver metabolite profiling - a combined metabolomic and proteomic approach, Biomed. Chromatogr, 28 (2014) 231–240. [DOI] [PubMed] [Google Scholar]
- [12].Schoeman JC, du Preez I, Loots DT, A comparison of four sputum pre-extraction preparation methods for identifying and characterising Mycobacterium tuberculosis using GCxGC-TOFMS metabolomics, J. Microbiol. Methods, 91 (2012) 301–311. [DOI] [PubMed] [Google Scholar]
- [13].Pérez Vasquez N, Crosnier de bellaistre-Bonose M, Lévêque N, Thioulouse E, Doummar D, Billette de Villemeur T, Rodriguez D, Couderc R, Robin S, Courderot-Masuyer C, Moussa F, Advances in the metabolic profiling of acidic compounds in children's urines achieved by comprehensive two-dimensional gas chromatography, J. Chromatogr. B, 1002 (2015) 130–138. [DOI] [PubMed] [Google Scholar]
- [14].Marney LC, Kolwicz SC, Tian R, Synovec RE, Sample preparation methodology for mouse heart metabolomics using comprehensive two-dimensional gas chromatography coupled with time-of-flight mass spectrometry, Talanta, 108 (2013) 123–130. [DOI] [PMC free article] [PubMed] [Google Scholar]
- [15].Purcaro G, Stefanuto PH, Franchina FA, Beccaria M, Wieland-Alter WF, Wright PF, Hill JE, SPME-GCxGC-TOF MS fingerprint of virally-infected cell culture: Sample preparation optimization and data processing evaluation, Anal. Chim. Acta, 1027 (2018) 158–167. [DOI] [PMC free article] [PubMed] [Google Scholar]
- [16].Risticevic S, Pawliszyn J, Solid-phase microextraction in targeted and nontargeted analysis: Displacement and desorption effects, Anal. Chem, 85 (2013) 8987–8995. [DOI] [PubMed] [Google Scholar]
- [17].Rocha SM, Caldeira M, Carrola J, Santos M, Cruz N, Duarte IF, Exploring the human urine metabolomic potentialities by comprehensive two-dimensional gas chromatography coupled to time of flight mass spectrometry, J. Chromatogr. A, 1252 (2012) 155–163. [DOI] [PubMed] [Google Scholar]
- [18].Tranchida PQ, Franchina FA, Dugo P, Mondello L, A flow-modulated comprehensive gas chromatography-mass spectrometry method for the analysis of fatty acid profiles in marine and biological samples, J. Chromatogr. A, 1255 (2012) 171–176. [DOI] [PubMed] [Google Scholar]
- [19].Weinert CH, Egert B, Kulling SE, On the applicability of comprehensive two-dimensional gas chromatography combined with a fast-scanning quadrupole mass spectrometer for untargeted large-scale metabolomics, J. Chromatogr. A, 1405 (2015) 156–167. [DOI] [PubMed] [Google Scholar]
- [20].Yan DD, Wong YF, Tedone L, Shellie RA, Marriott PJ, Whittock SP, Koutoulis A, Chemotyping of new hop (Humulus lupulus L.) genotypes using comprehensive two-dimensional gas chromatography with quadrupole accurate mass time-of-flight mass spectrometry, J. Chromatogr. A, 1536 (2018) 110–121. [DOI] [PubMed] [Google Scholar]
- [21].Wong YF, Perlmutter P, Marriott PJ, Untargeted metabolic profiling of Eucalyptus spp. Leaf oils using comprehensive two-dimensional gas chromatography with high resolution mass spectrometry: Expanding the metabolic coverage, Metabolomics, 13 (2017) 46. [Google Scholar]
- [22].Wong YF, Chin ST, Perlmutter P, Marriott PJ, Evaluation of comprehensive two-dimensional gas chromatography with accurate mass time-of-flight mass spectrometry for the metabolic profiling of plant-fungus interaction in Aquilaria malaccensis, J. Chromatogr. A, 1387 (2015) 104–115. [DOI] [PubMed] [Google Scholar]
- [23].Gruber B, Groeger T, Harrison D, Zimmermann R, Vacuum ultraviolet absorption spectroscopy in combination with comprehensive two-dimensional gas chromatography for the monitoring of volatile organic compounds in breath gas: A feasibility study, J. Chromatogr. A, 1464 (2016) 141–146. [DOI] [PubMed] [Google Scholar]
- [24].Weusten JJAM, Derks EPPA, Mommers JHM, van der Wal S, Alignment and clustering strategies for GC × GC-MS features using a cylindrical mapping, Anal. Chim. Acta, 726 (2012) 9–21. [DOI] [PubMed] [Google Scholar]
- [25].Jeong J, Zhang X, Shi X, Kim S, Shen C, An efficient post-hoc integration method improving peak alignment of metabolomics data from GC×GC/TOF-MS, BMC Bioinf, 14 (2013) 123. [DOI] [PMC free article] [PubMed] [Google Scholar]
- [26].Wei X, Shi X, Koo I, Kim S, Schmidt RH, Arteel GE, Watson WH, McClain C, Zhang X, Metpp: A computational platform for comprehensive two-dimensional gas chromatography time-of-flight mass spectrometry-based metabolomics, Bioinformatics, 29 (2013) 1786–1792. [DOI] [PMC free article] [PubMed] [Google Scholar]
- [27].de la Mata AP, McQueen RH, Nam SL, Harynuk JJ, Comprehensive two-dimensional gas chromatographic profiling and chemometric interpretation of the volatile profiles of sweat in knit fabrics, Anal. Bioanal. Chem, 409 (2017) 1905–1913. [DOI] [PubMed] [Google Scholar]
- [28].Domingo-Almenara X, Perera A, Ramirez N, Brezmes J, Automated resolution of chromatographic signals by independent component analysis-orthogonal signal deconvolution in comprehensive gas chromatography/mass spectrometry-based metabolomics, Comput. Meth. Prog. Bio, 130 (2016) 135–141. [DOI] [PubMed] [Google Scholar]
- [29].Izadmanesh Y, Garreta-Lara E, Ghasemi JB, Lacorte S, Matamoros V, Tauler R, Chemometric analysis of comprehensive two-dimensional gas chromatography-mass spectrometry metabolomics data, J. Chromatogr. A, 1488 (2017) 113–125. [DOI] [PubMed] [Google Scholar]
- [30].Livengood P, Maciejewski R, Chen W, Ebert DS, Omicsvis: An interactive tool for visually analyzing metabolomics data, BMC Bioinf, 13 (2012) Suppl 8: S6. [DOI] [PMC free article] [PubMed] [Google Scholar]
- [31].Tian TF, Wang SY, Kuo TC, Tan CE, Chen GY, Kuo CH, Chen CHS, Chan CC, Lin OA, Tseng YJ, Web server for peak detection, baseline correction, and alignment in two-dimensional gas chromatography mass spectrometry-based metabolomics data, Anal. Chem, 88 (2016) 10395–10403. [DOI] [PubMed] [Google Scholar]
- [32].Prebihalo SE, Berrier KL, Freye CE, Bahaghighat HD, Moore NR, Pinkerton DK, Synovec RE, Multidimensional gas chromatography: Advances in instrumentation, chemometrics, and applications, Anal Chem, 90 (2018) 505–532. [DOI] [PubMed] [Google Scholar]
- [33].Bean HD, Dimandja J-MD, Hill JE, Bacterial volatile discovery using solid phase microextraction and comprehensive two-dimensional gas chromatography-time-of-flight mass spectrometry, J. Chromatogr. B, 901 (2012) 41–46. [DOI] [PMC free article] [PubMed] [Google Scholar]
- [34].Rees CA, Nordick KV, Franchina FA, Lewis AE, Hirsch EB, Hill JE, Volatile metabolic diversity of Klebsiella pneumoniae in nutrient-replete conditions, Metabolomics, 13 (2017) 1–12. [DOI] [PMC free article] [PubMed] [Google Scholar]
- [35].Beckstrom AC, Tanya P, Humston EM, Snyder LR, Synovec RE, Juul SE, The perinatal transition of the circulating metabolome in a nonhuman primate, Pediatr. Res, 71 (2012) 338–344. [DOI] [PMC free article] [PubMed] [Google Scholar]
- [36].Chun PT, McPherson RJ, Marney LC, Zangeneh SZ, Parsons BA, Shojaie A, Synovec RE, Juul SE, Serial plasma metabolites following hypoxic-ischemic encephalopathy in a nonhuman primate model, Dev. Neurosci, 37 (2015) 161–171. [DOI] [PMC free article] [PubMed] [Google Scholar]
- [37].Mellors TR, Blanchet L, Flynn JL, Tomko J, O'Malley M, Scanga CA, Lin PL, Hill JE, A new method to evaluate macaque health using exhaled breath: A case study of M. tuberculosis in a BSL-3 setting, J. Appl. Physiol, 122 (2017) 695–701. [DOI] [PMC free article] [PubMed] [Google Scholar]
- [38].Franchina FA, Mellors TR, Aliyeva M, Wagner J, Daphtary N, Lundblad LKA, Fortune SM, Rubin EJ, Hill JE, Towards the use of breath for detecting mycobacterial infection: A case study in a murine model, J. Breath Res, 12 (2018) 026008. [DOI] [PubMed] [Google Scholar]
- [39].Mellors T, Rees C, Wieland-Alter W, von Reyn CF, Hill JE, The volatile molecule signature of four mycobacteria species, J. Breath Res, 11 (2017) 031002. [DOI] [PubMed] [Google Scholar]
- [40].du Preez I, Loots DT, New sputum metabolite markers implicating adaptations of the host to Mycobacterium tuberculosis, and vice versa, Tuberculosis, 93 (2013) 330–337. [DOI] [PubMed] [Google Scholar]
- [41].Luies L, Loots DT, Tuberculosis metabolomics reveals adaptations of man and microbe in order to outcompete and survive, Metabolomics, 12 (2016) 40. [Google Scholar]
- [42].Beccaria M, Mellors TR, Petion JS, Rees CA, Nasir M, Systrom HK, Sairistil JW, Jean-Juste MA, Rivera V, Lavoile K, Severe P, Pape JW, Wright PF, Hill JE, Preliminary investigation of human exhaled breath for tuberculosis diagnosis by multidimensional gas chromatography - time of flight mass spectrometry and machine learning, J. Chromatogr. B, 1074-1075 (2018) 46–50. [DOI] [PubMed] [Google Scholar]
- [43].Winnike JH, Wei XL, Knagge KJ, Colman SD, Gregory SG, Zhang X, Comparison of GC-MS and GC×GC-MS in the analysis of human serum samples for biomarker discovery, J. Proteome Res, 14 (2015) 1810–1817. [DOI] [PMC free article] [PubMed] [Google Scholar]
- [44].Menéndez-Carreño M, Steenbergen H, Janssen HG, Development and validation of a comprehensive two-dimensional gas chromatography-mass spectrometry method for the analysis of phytosterol oxidation products in human plasma, Anal. Bioanal. Chem, 402 (2012) 2023–2032. [DOI] [PubMed] [Google Scholar]
- [45].Zhang Y, Tobias HJ, Auchus RJ, Brenna JT, Comprehensive 2-dimensional gas chromatography fast quadrupole mass spectrometry (GC × GC-qMS) for urinary steroid profiling: Mass spectral characteristics with chemical ionization, Drug Test. Anal, 3 (2011) 857–867. [DOI] [PMC free article] [PubMed] [Google Scholar]
- [46].Zhang Y, Tobias HJ, Brenna JT, Highly sensitive and selective analysis of urinary steroids by comprehensive two-dimensional gas chromatography combined with positive chemical ionization quadrupole mass spectrometry, Analyst, 137 (2012) 3102–3110. [DOI] [PMC free article] [PubMed] [Google Scholar]
- [47].Rocha SM, Freitas R, Cardoso P, Santos M, Martins R, Figueira E, Exploring the potentialities of comprehensive two-dimensional gas chromatography coupled to time of flight mass spectrometry to distinguish bivalve species: Comparison of two clam species (Venerupis decussata and Venerupis philippinarum), J. Chromatogr. A, 1315 (2013) 152–161. [DOI] [PubMed] [Google Scholar]
- [48].Baumgarner BL, Cooper BR, Evaluation of a tandem gas chromatography/time-of-flight mass spectrometry metabolomics platform as a single method to investigate the effect of starvation on whole-animal metabolism in rainbow trout (Oncorhynchus mykiss), The Journal of Experimental Biology, 215 (2012) 1627–1632. [DOI] [PubMed] [Google Scholar]
- [49].Dymerski T, Two-dimensional gas chromatography coupled with mass spectrometry in food analysis, Crit. Rev. Anal. Chem, 48 (2018) 252–278. [DOI] [PubMed] [Google Scholar]
- [50].Cordero C, Kiefl J, Schieberle P, Reichenbach SE, Bicchi C, Comprehensive two-dimensional gas chromatography and food sensory properties: Potential and challenges, Anal. Bioanal. Chem, 407 (2015) 169–191. [DOI] [PubMed] [Google Scholar]
- [51].Risticevic S, Souza-Silva EA, DeEll JR, Cochran J, Pawliszyn J, Capturing plant metabolome with direct-immersion in vivo solid phase microextraction of plant tissues, Anal. Chem, 88 (2016) 1266–1274. [DOI] [PubMed] [Google Scholar]
- [52].Wojciechowska E, Weinert CH, Egert B, Trierweiler B, Schmidt-Heydt M, Horneburg B, Graeff-Hönninger S, Kulling SE, Geisen R, Chlorogenic acid, a metabolite identified by untargeted metabolome analysis in resistant tomatoes, inhibits the colonization by Alternaria altemata by inhibiting alternariol biosynthesis, Eur. J. Plant Pathol, 139 (2014) 735–747. [Google Scholar]
- [53].Hantao LW, Aleme HG, Passador MM, Furtado EL, Ribeiro FAD, Poppi RJ, Augusto F, Determination of disease biomarkers in Eucalyptus by comprehensive two-dimensional gas chromatography and multivariate data analysis, J. Chromatogr. A, 1279 (2013) 86–91. [DOI] [PubMed] [Google Scholar]
- [54].Hantao LW, Toledo BR, Ribeiro FAD, Pizetta M, Pierozzi CG, Furtado EL, Augusto F, Comprehensive two-dimensional gas chromatography combined to multivariate data analysis for detection of disease-resistant clones of Eucalyptus, Talanta, 116 (2013) 1079–1084. [DOI] [PubMed] [Google Scholar]
- [55].Aura A-M, Mattila I, Hyötyläinen T, Gopalacharyulu P, Cheynier V, Souquet J-M, Bes M, Le Bourvellec C, Guyot S, Orešič M, Characterization of microbial metabolism of Syrah grape products in an in vitro colon model using targeted and non-targeted analytical approaches, Eur. J. Nutr, 52 (2013) 833–846. [DOI] [PMC free article] [PubMed] [Google Scholar]
- [56].Vetrani C, Rivellese AA, Annuzzi G, Adiels M, Borén J, Mattila I, Orešič M, Aura AM, Metabolic transformations of dietary polyphenols: Comparison between in vitro colonic and hepatic models and in vivo urinary metabolites, J. Nutr. Biochem, 33 (2016) 111–118. [DOI] [PubMed] [Google Scholar]
- [57].Cordero C, Zebelo S, Gnavi G, Griglione A, Bicchi C, Maffei M, Rubiolo P, HS-SPME-GC×GC-qMS volatile metabolite profiling of Chrysolina herbacea frass and Mentha spp. Leaves, Anal. Bioanal. Chem, 402 (2012) 1941–1952. [DOI] [PubMed] [Google Scholar]
- [58].Pizzolante G, Cordero C, Tredici SM, Vergara D, Pontieri P, Del Giudice L, Capuzzo A, Rubiolo P, Kanchiswamy CN, Zebelo SA, Bicchi C, Maffei ME, Alifano P, Cultivable gut bacteria provide a pathway for adaptation of Chrysolina herbacea to Mentha aquatica volatiles, BMC Plant Biol, 17 (2017) 30. [DOI] [PMC free article] [PubMed] [Google Scholar]
- [59].Sud M, Fahy E, Cotter D, Azam K, Vadivelu I, Burant C, Edison A, Fiehn O, Higashi R, Nair KS, Sumner S, Subramaniam S, Metabolomics workbench: An international repository for metabolomics data and metadata, metabolite standards, protocols, tutorials and training, and analysis tools, Nucleic Acids Res, 44 (2016) D463–D470. [DOI] [PMC free article] [PubMed] [Google Scholar]
- [60].Sumner LW, Amberg A, Barrett D, Beale MH, Beger R, Daykin CA, Fan TWM, Fiehn O, Goodacre R, Griffin JL, Hankemeier T, Hardy N, Harnly J, Higashi R, Kopka J, Lane AN, Lindon JC, Marriott P, Nicholls AW, Reily MD, Thaden JJ, Viant MR, Proposed minimum reporting standards for chemical analysis chemical analysis working group (CAWG) metabolomics standards initiative (MSI), Metabolomics, 3 (2007) 211–221. [DOI] [PMC free article] [PubMed] [Google Scholar]
- [61].Bub A, Kriebel A, Dorr C, Bandt S, Rist M, Roth A, Hummel E, Kulling S, Hoffmann I, Watzl B, The karlsruhe metabolomics and nutrition (KarMeN) study: Protocol and methods of a cross-sectional study to characterize the metabolome of healthy men and women, JMIR Res. Protoc, 5 (2016) 225–236. [DOI] [PMC free article] [PubMed] [Google Scholar]
- [62].Rist MJ, Roth A, Frommherz L, Weinert CH, Kruger R, Merz B, Bunzel D, Mack C, Egert B, Bub A, Gorling B, Tzvetkova P, Luy B, Hoffmann I, Kulling SE, Watzl B, Metabolite patterns predicting sex and age in participants of the karlsruhe metabolomics and nutrition (KarMeN) study, Plos One, 12 (2017). [DOI] [PMC free article] [PubMed] [Google Scholar]
- [63].Parsons BA, Pinkerton DK, Synovec RE, Implications of phase ratio for maximizing peak capacity in comprehensive two-dimensional gas chromatography time-of-flight mass spectrometry, J. Chromatogr. A, 1536 (2018) 16–26. [DOI] [PubMed] [Google Scholar]
- [64].Bean HD, Hill JE, Dimandja J-MD, Improving the quality of biomarker candidates in untargeted metabolomics via peak table-based alignment of comprehensive two-dimensional chromatography-mass spectrometry data, J. Chromatogr. A, 1394 (2015) 111–117. [DOI] [PMC free article] [PubMed] [Google Scholar]
- [65].de Lima PF, Furlan MF, Ribeiro FAD, Pascholati SF, Augusto F, In vivo determination of the volatile metabolites of saprotroph fungi by comprehensive two-dimensional gas chromatography, J. Sep. Sci, 38 (2015) 1924–1932. [DOI] [PubMed] [Google Scholar]
- [66].Koek MM, Muilwijk B, van Stee LLP, Hankemeier T, Higher mass loadability in comprehensive two-dimensional gas chromatography-mass spectrometry for improved analytical performance in metabolomics analysis, J. Chromatogr. A, 1186 (2008) 420–429. [DOI] [PubMed] [Google Scholar]
- [67].Harynuk J, Gorecki T, de Zeeuw J, Overloading of the second-dimension column in comprehensive two-dimensional gas chromatography, J. Chromatogr. A, 1071 (2005) 21–27. [DOI] [PubMed] [Google Scholar]
- [68].Zhu ZY, Harynuk J, Gorecki T, Effect of first-dimension column film thickness on comprehensive two-dimensional gas chromatographic separation, J. Chromatogr. A, 1105 (2006) 17–24. [DOI] [PubMed] [Google Scholar]
- [69].Nizio KD, Perrault KA, Troobnikoff AN, Ueland M, Shoma S, Iredell JR, Middleton PG, Forbes SL, In vitro volatile organic compound profiling using GC×GC-TOFMS to differentiate bacteria associated with lung infections: A proof-of-concept study, J. Breath Res, 10 (2016) 026008. [DOI] [PubMed] [Google Scholar]
- [70].Wandro S, Carmody L, Gallagher T, LiPuma JJ, Whiteson K, Making it last: Storage time and temperature have differential impacts on metabolite profiles of airway samples from cystic fibrosis patients, mSystems, 2 (2017). [DOI] [PMC free article] [PubMed] [Google Scholar]
- [71].Rodriguez-Perez R, Cortes R, Guaman A, Pardo A, Torralba Y, Gomez F, Roca J, Barbera JA, Cascante M, Marco S, Instrumental drift removal in GC-MS data for breath analysis: The short-term and long-term temporal validation of putative biomarkers for COPD, J. Breath Res, 12 (2018) 036007. [DOI] [PubMed] [Google Scholar]
- [72].Phillips M, Byrnes R, Cataneo RN, Chaturvedi A, Kaplan PD, Libardoni M, Mehta V, Mundada M, Patel U, Ramakrishna N, Schiff PB, Zhang X, Detection of volatile biomarkers of therapeutic radiation in breath, J. Breath Res, 7 (2013) 036002. [DOI] [PubMed] [Google Scholar]
- [73].Gaquerel E, Baldwin IT, Honing in on phenotypes: Comprehensive two-dimensional gas chromatography of herbivory-induced volatile emissions and novel opportunities for system-level analyses, AoB PLANTS, 5 (2013) plt002. [DOI] [PMC free article] [PubMed] [Google Scholar]
Associated Data
This section collects any data citations, data availability statements, or supplementary materials included in this article.