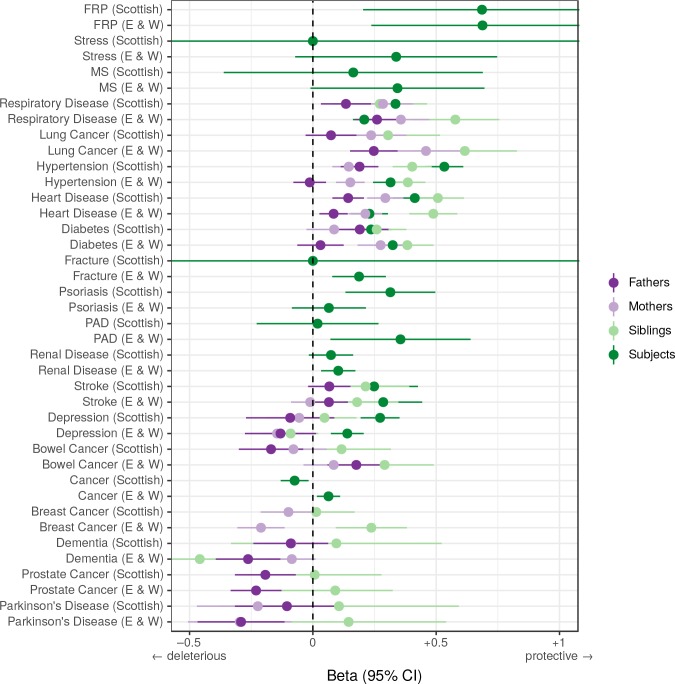
Figure 10. Associations between polygenic lifespan score and diseases of UK Biobank subjects and their kin.
Logistic regression was performed on standardised polygenic survival score (all variants) and 21 disease traits reported by 24,059 Scottish and 29,815 English/Welsh out-of-sample individuals about themselves and their kin. For grouping of UK Biobank disease codes, see Figure 10—source data 1. Displayed here are inverse-variance meta-analysed estimates of the diseases for which multiple sources of data were available (i.e. parents and/or siblings; see Figure 10—figure supplement 1 for all associations). ‘Cancer’ is only in subjects, whilst the specific subtypes are analysed for kin. The left panel shows disease estimates for each kin separately; the right panel shows the combined estimate, with standard errors adjusted for correlation between family members. Diseases have been ordered by magnitude of effect size (combined estimate). Beta – log odds reduction ratio of disease per standard deviation of polygenic survival score, where a negative beta indicates a deleterious effect of score on disease prevalence (lifetime so far), and positive beta indicates a protective effect on disease. Effect sizes for first degree relatives have been doubled. Cancer – Binary cancer phenotype (any cancer, yes/no).


