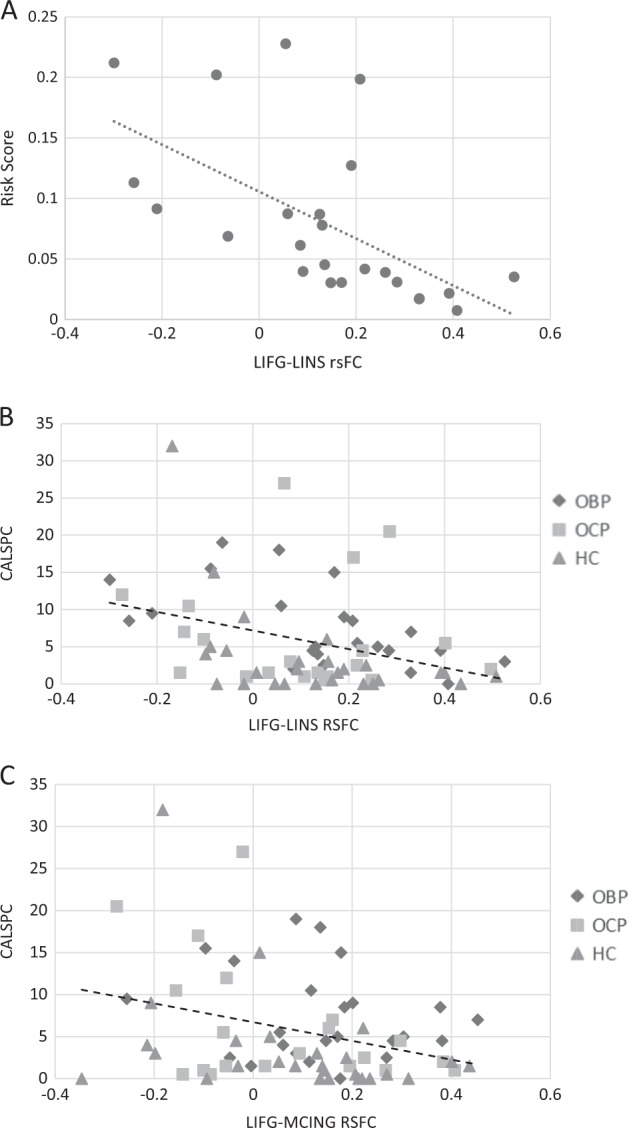
Fig. 2.

Correlations between LIFG and symptom dimensions. a Correlation between LIFG-LINS rsFC and risk score in OBP (n = 24; r = −0.64, p = 0.002). b Correlation between LIFG-LINS rsFC and CALSpc in the full sample (n = 71; r = −0.43, p = 0.0003). c Correlation between LIFG-MCING rsFC and CALSpc in the full sample (n = 71; r = −0.40, p = 0.001). LIFG left inferior frontal gyrus, LINS left insula, CALSpc Child Affective Lability Scale, OBP offspring of bipolar parents, OCP offspring of control parents, HC healthy controls
