

Abstract
The critical importance of glutathione in mitigating the deleterious effects of electrophile generating drugs such as acetaminophen (APAP) is well established. However, the role of other antioxidant systems, such as that provided by thioredoxin, has not been extensively studied. Selenoprotein thioredoxin reductase 1 (Txnrd1) is important for attenuating activation of the apoptosis signaling-regulating kinase 1 (ASKl) and the c-Jun N-terminal kinase (JNK) pathway caused by high doses of APAP. Therefore, a detailed investigation of the role of Txnrd1 in APAP-induced hepatotoxicity was conducted. Liver-specific Txnrd1 knockout mice (Txnrd1ΔLiv) were generated and treated with a hepatotoxic dose (400 mg/kg) of APAP for 1 or 6 h. Liver toxicity was assessed by measuring the activities of liver enzymes aspartate aminotransferase and alanine aminotransferase in serum, in addition to histopathological analysis of liver sections and analysis of glutathione levels. At 1 h post-APAP treatment, total and mitochondrial glutathione levels in control and Txnrd1ΔLiv mice were similarly depleted. However, at 6 h post-APAP treatment, Txnrd1ΔLiv mice were resistant to APAP toxicity as liver enzymes and histology were not significantly different from the corresponding untreated mice. Analyses revealed the compensatory up-regulation of many of the nuclear factor erythroid 2-related factor 2 (NRF2) target genes and proteins in Txnrd1ΔLiv mice with and without APAP treatment. Yet, JNK was phosphorylated to a similar extent in APAP-treated control mice. The results suggest that Txnrd1ΔLiv mice are primed for xenobiotic detoxication primarily through NRF2 activation.
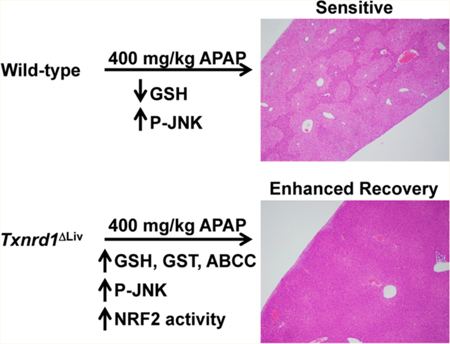
Graphical Abstract
INTRODUCTION
Acetaminophen (APAP) is the most common cause of drug- induced liver damage in the United States, Great Britain, and other parts of the world [reviewed in ref 1]. Metabolic bioactivation of APAP to the reactive electrophile, N-acetyl-p- benzoquinone imime (NAPQ1), causes extensive and rapid glutathione depletion, and ultimately, hepatotoxicity. It was proposed that these events are initiated by reactive oxygen species (ROS) formation in mitochondria leading to subsequent activation of apoptosis signaling-regulating kinase 1 (ASK1) and the c-Jun N-terminal kinase (JNK) pathway.2–6 ASK1 is particularly important for prolonged activation of JNK in response to toxic doses of APAP which leads to cell death.
In addition to being a major antioxidant and redox regulator in mammalian cells, thioredoxin reductase 1 (Txnrd1) is important for attenuating ASK1 through thioredoxin (Trx) reduction.7 In its reduced form, Trx binds to ASK1 and inhibits its activation. However, during periods of oxidative stress (e.g., treatment with toxic doses of APAP), Trx is oxidized and dissociates from ASK1, and ASK1 kinase activity is induced. These events have been reported to occur during APAP-induced hepatoxicity and also with treatment of another oxidative stress promoting agent, peroxynitrite.5,8,9 Moreover, the primary function of Txnrd1 in normal cells is to control the redox state of Trx and therefore protect cells from oxidative stress.10,11 In fact, Txnrd1 is an essential selenium-containing protein in development12 and is regarded as one of the major antioxidant and redox regulators in mammalian cells having roles in cell proliferation, transcription, DNA repair, and angiogenesis.13–16 Txnrd1 is known to have a role in protecting cells from transformation but more recently has been recognized to have a role in promoting the malignancy process [see reviews in refs 17 and 18]. However, transformed cells with genetic Txnrd1 deficiency were reported to have equal proliferation rates and to form tumors like wild-type controls, which are sensitive to pharmacological glutathione depletion.19 Although Txnrd1 is one of the most studied selenoproteins and redox regulators in mammals, its role in APAP-induced hepatotoxicity has not been specifically investigated.
The role of another selenoprotein, glutathione peroxidase 1 (GPX1), has been studied extensively in APAP-induced hepatotoxicity. Transgenic mice overexpressing GPX1 in liver were found to be more sensitive to a toxic dose of APAP than the corresponding GPX1 normal mice.20 Other investigators, however, reported that Gpxl -null mice were only marginally protected against APAP-induced hepatotoxicity.21–24 It was proposed that GPX1 may play different roles depending on the type of oxidative stress, ROS, or reactive nitrogen species (RNS).25
Since considerable insight into the role of glutathione metabolism in APAP hepatotoxicity has been provided,26 and little is known about the role of Txnrd1 in this process, liver- specific Txnrd1ΔLiv knockout mice were employed to elucidate the role of Txnrd1 in mediating the acute response of APAP- induced hepatotoxicity. It was anticipated that Txnrd1ΔLiv knockout mice would be more susceptible to hepatocytotoxicity than the control, Txnrd1 normal mice due to the loss of this strong antioxidant system. By contrast, Txnrd1ΔLivmice were found to be far more resistant. Therefore, the principal focus of the current study was to provide further insight into the means of how Txnrd1ΔLiv mice cope with the loss of a major antioxidant system.
EXPERIMENTAL PROCEDURES
Mice.
Mice analyzed in this study were generated by crossing Txnrd1 conditional knockout mice in a C57BL/6 background12 with Alb-cre transgenic mice in a C57BL/6 background. The resulting heterozygous floxed male and female mice were then crossed to obtain the desired experimental genotypes herein referred to as Txnrd1ΔLiv(Txnrd1flox/flox and Alb-cre) and control (Txnrd1+/+ and Alb-Cre) mice. Males, age 6–8 weeks and in identical backgrounds, were used in all experiments. Mice were handled in accordance with the National Institutes of Health Institutional Guidelines (NCI, NIH, Bethesda, MD, USA), and all mouse experiments were approved by the Animal Ethics Committee at the National Institutes of Health.
Acetaminophen Experiments.
Groups of 6–8 week-old male mice were given an intraperitoneal injection of APAP (400 mg/kg) dissolved in saline. All mice were euthanized by CO2 asphyxiation 1 or 6 h after the APAP dose. To assess liver damage, livers were washed in phosphate buffered saline, and portions of liver tissue were fixed in 10% buffered formalin or flash frozen at −80 °C. Necrosis was scored by hematoxylin and eosin staining.
Serum Chemistry.
APAP-induced liver injury was determined by measuring aspartate aminotransferase (AST) and alanine aminotransferase (ALT) catalytic activities in serum using a commercial AST or ALT assay kit (Catachem, Bridgeport, CT).
Glutathione Measurements.
Reduced glutathione (GSH) levels in liver and liver mitochondria extracts were measured using a glutathione assay kit (Sigma-Aldrich, St. Louis, MO). Liver mitochondria were isolated by differential centrifugation. Briefly, 100 mg of liver were dounce homogenized in 10 volumes of buffer containing 0.2 mM EDTA, 0.25 M sucrose, and 10 mM Tris-HCl at pH 7.8. The nuclear fraction was removed by centrifugation at 1,000g for 10 min at 4 °C. The supernatant was spun again at 1,000g for 10 min at 4 °C. Mitochondria were pelleted from the supernatant by spinning at 18,000g for 10 min at 4 °C.
RNA Analysis.
mRNA levels were determined by quantitative real-time polymerase chain reaction (QPCR). RNA was extracted using TRIzol reagent (Invitrogen, Carlsbad, CA) and QPCR performed using cDNA generated from 1 μg of total RNA with SuperScript II Reverse Transcriptase (Invitrogen, Carlsbad, CA). Primers for QPCR were designed using qPrimerDepot (http://mouseprimerdepot.nci.nih.gov). QPCR reactions were carried out using the SYBR Green PCR master mix (SuperArray, Frederick, MD) and an ABI Prism 7900HT Sequence Detection System (Applied Biosystems). Results were normalized to mouse Gapdh.
Western Blotting.
One hundred milligrams of liver was lysed in buffer containing 10 mM Tris-HCl (pH 7.5), 150 mM NaCl, 1 mM EDTA, 1% NP40, 0.5% Triton, 20 mM β-glycerophosphate, and protease inhibitors (Complete Mini Protease Inhibitor Cocktail; Roche Diagnostics). Normalized protein lysates (BCA Protein Assay Kit; Pierce) were separated on a 4–12% SDS-PAGE gel, transferred to polyvinylidene difluoride membranes, and stained with antibodies detecting the phosphorylated JNK, total JNK (Cell Signaling Technology, Danvers, MA), GST-α, GST-μ, GST-π (Detroit R&D, Detroit, MI), GSS (Abcam, Cambridge, UK), GSR (Epitomics, Cambridge, MA), GCLC (Thermo Scientific, Rockford, IL) or CYP2E1 (Abcam, Cambridge, UK), or actin (Santa Cruz Biotechnology, Inc., Santa Cruz, CA). Antibodies against APAP were the generous gift of Dr. Lance Pohl, NHLBI, NIH, Bethesda, MD, USA.
Determination of APAP Metabolite Profiles in Urine and Serum.
Urine and serum samples were collected at 6 h after intraperitoneal injection of 10 or 400 mg/kg APAP. Mice were individually housed, and urine was collected in glass metabowls (Jencons, Bridgeville, PA). One volume of urine was diluted with 20 volumes of water and spun at 14,000g for 10 min at 4 °C. The supernatant was transferred to an autosampler tube and analyzed by ultraperformance liquid chromatography coupled with electrospray ionization quadrupole time-of-flight mass spectrometry as described.27 The mass chromatographic data were aligned and deconvoluted using MarkerLynx software to generate a data matrix consisting of peak areas corresponding to a unique m/z and retention time. SIMCA-P12+ (Umetrics, Kinnelon, NJ) software was used to conduct principal components analysis (PCA) and orthogonal projection to latent structures (OPLS) analysis.
APAP and its urinary metabolites (CYS-APAP, NAC-APAP, APAP- Glucuronide, and APAP-sulfate) were identified through accurate mass measurement (Table 1), comparison with authentic standards, and analysis of MSMS fragmentation patterns. The peak areas were quantified to represent the signal intensities. In the case of 3- thiomethyl-APAP-sulfate and 3-methoxy-APAP-glucuronide, their structures were rationalized based on accurate mass measurement and tandem MS fragmentography.
Table 1.
APAP and APAP Metabolites Identified in Urine by UPLC-QTOFMS
| identity | elemental composition |
[M + H]+ | [M − H]− | levels in Txnrd1ΔLiv compared with control (400 mg/kg) |
levels in Txnrd1ΔLiv compared with control (10 mg/kg) |
|---|---|---|---|---|---|
| APAP | C8H9NO2 | 152.0712 | ↓ | ↓ | |
| CYS-APAP | C11H14N2O4S | 271.0753 | ↑ | ||
| NAC-APAP | C13H16N2O5S | 313.0858 | ↓ | ||
| APAP-glucuronide | C14H17NO8 | 328.1032 | ↓ | ||
| APAP-sulfate | C8H9NO5S | 232.0280 | ↓ | ||
| 3-methoxy-APAP-glucuronide | C15H19NO9 | 358.1138 | ↑ | ||
| 3-thiomethyl-APAP-sulfate | C9H11NO5S2 | 276.0000 | ↑ |
Statistical Analysis.
All values are presented as the standard error of the mean (SEM). Student’s t test and ANOVA with Bonferroni’s correction for multiple comparisons were performed using GraphPad Prism (San Diego, CA). P-values less than 0.05 were considered significant.
RESULTS
Txnrd1ΔLiv Mice Are Resistant to Acute APAP-Induced Hepatotoxicity.
Control male mice given an intraperitoneal dose of APAP (400 mg/kg) exhibited typical histopathological signs of APAP-induced hepatotoxicity including faint pericentral and periportal H&E staining of the liver parenchyma (Figure 1A and Supporting Information, Figure S1, left panels, respectively). In addition, these mice had increased ALT (35-fold, p < 0.05) and AST (20-fold, p < 0.01) enzyme levels (Figure 1B), which are two classical diagnostic indicators of hepatotoxicity. Decreased total (4.7-fold, p < 0.05) and mitochondrial (3-fold, p < 0.01) glutathione (GSH) levels (Figure 1C,D) were also observed in control mice treated with APAP, which are consistent with the antioxidant role of GSH in detoxifying the highly reactive APAP metabolite, NAPQI. By contrast, livers from Txnrd1ALlv mice were histologically normal (Figure 1A and Supporting Information, Figure Sl, right panels) and showed no significant histopathological changes associated with APAP treatment.
Figure 1.

Resistance of Txnrd1ΔLiv mice to APAP-induced hepatotoxicity. Control and Txnrd1ΔLiv mice (n = 3) were treated or untreated with a hepatotoxic dose of APAP and liver samples analyzed after 6 h. (A) Histopathological analysis of a representative liver sample from a control (left panel) or a Txnrd1ΔLiv mouse (right panel) following H&E staining. (B) AST (left panel) and ALT enzyme levels (right panel). (C) Total and (D) mitochondrial glutathione levels. *P < 0.05; **P < 0.01.
Txnrd1 levels in livers from Txnrd1ΔLiv mice were confirmed to be virtually absent by QPCR and 75Se labeling analyses (Supporting Information, Figure S2). Since the liver consists of about 85% hepatocytes and the albumin Cre is expressed in hepatocyes, the residual levels of Txnrd1 expression in Txnrd1ΔLivmice is likely due, at least in part, to other cell types that constitute only about 15% of liver. Even though Txnrd1ΔLiv mice treated with 400 mg/kg of APAP had increased AST and ALT levels (Figure 1B), on average, 4.9-fold and 4.3-fold, respectively, these changes were not statistically significant. Total liver (Figure 1C) and mitochondrial (Figure 1D) glutathione levels were unchanged in the Txnrd1ΔLivmice treated with APAP. However, mice receiving 400 mg/kg APAP for 1 h revealed that both the control and Txnrd1ΔLiv mice had dramatic and significant reductions in both total and mitochondrial GSH levels (Figure 2). Samples of total liver lysates were separated on a SDS-PAGE gel and the levels of APAP protein adducts examined by Western blotting (Supporting Information, Figure S3). Similar levels of APAP protein adducts were found between control and Txnrd1ΔLivmice at 1 or 6 h post-APAP treatment.
Figure 2.

Total and mitochondrial grlutatihione levels following 1h of APAP treat ment. Control and Txnrd1ΔLiv mice (n = 3) were treated or untreated with a hepatotoxic dose of APAP and liver samples analyzed after 1h for total and mitochondrial glutathione levels. **P < 0.01.
APAP-Treated Txnrd1ΔLiv Mice Have Normal Transcriptional and Biochemical Responses Associated with c-jun N-Terminal Kinase Activation.
Increased oxidative stress following toxic doses of APAP causes the dissociation of oxidized thioredoxin from ASK1, thus activating its signaling cascade, which includes phosphorylation of JNK.5 Since Txnrd1 is important for maintaining thioredoxin in its reduced form, and hence silencing ASK1 activation, the biochemical and transcriptional changes following APAP treatment were examined in the livers of Txnrd1ΔLiv and control mice. Control mice treated with 400 mg/kg APAP had increased JNK phosphorylation (Figure 3A), while similarly treated Txnrd1ΔLiv mice also manifested increased JNK phosphorylation (Figure 3A). In both cases, total JNK levels were unchanged. Additionally, gene expression of c- jun (Figure 3B) and c-fos (Figure 3C) were increased dramatically in the control (35- and 9-fold, respectively) and Txnrd1ΔLiv mice (241- and 4-fold, respectively) following APAP treatment. Interestingly, c-jun gene expression in the liver was 7-fold greater in Txnrd1ΔLiv mice treated with APAP compared with similarly treated control mice.
Figure 3.

Examination of the JNK pathway following APAP treatment. Control and Txnrd1ΔLiv mice (n = 3) were treated or untreated with a hepatotoxic dose of APAP for 6 h and liver extracts analyzed. (A) Western blot analysis of APAP effects on JNK phosphorylation (p-JNK; upper panel) and total JNK levels (lower panel). Gene expression of (B) c-jun and (C) c-fos. *P < 0.05; **P < 0.01.
Txnrd1ΔLiv Mice Have Elevated Levels of NRF2 Target Genes, GSTs, and ABC Transporters in the Liver.
It was previously established that disruption of Txnrd1 in the livers of mice results in up-regulation of NRF2 and a host of xenobiotic detoxifying enzymes and pathways.28 The levels of GST-α, GST- μ, and GST-π were thus examined in liver extracts from control and APAP-treated mice by Western blotting. The Txnrd1ΔLivmice had elevated levels of GST-α and GST-μ (Figure 4) and showed a slight reduction in the levels of GST-π compared to that of control mice. However, these mice manifested virtually no change in levels of these proteins in response to APAP with the exception of control that had an increase in GST-w. Other proteins important for glutathione synthesis were also examined by Western blotting, including GCLC, GSR, and GSS. All were up-regulated in the livers of Txnrd1ΔLiv mice compared to that in controls, but these enzymes manifested only slight changes in response to APAP treatment in Txnrd1ΔLivmice.
Figure 4.
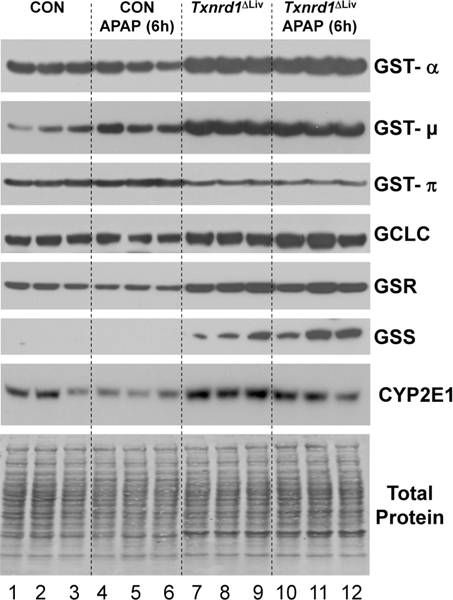
Western blot analysis of Nrf2 gene products. Control and Txnrd1ΔLiv mice (n = 3) were treated or untreated with a hepatotoxic dose of APAP for 6 h and liver extracts analyzed by Western blotting of proteins involved in glutathione synthesis, GST-α, GST-μ, GST-π, GCLC, GSR, and GSS, and the cytochrome P450 enzyme, CYP2E1. Total protein is shown as a loading control.
These observations were further supported by QPCR analysis of genes encoding the above enzymes involved in glutathione synthesis (Figure 5A). However, unlike the Western blot data, the QPCR analysis for Gclc, Gsr, and Gss did not reveal any statistically significant differences between control and Txnrd1ΔLiv mice. Interestingly, Western blot analysis of cytochrome P450 2e1 (Cyp2el) was down-regulated following APAP treatment in control mice as previously reported29 and is consistent with reduced protein synthesis during APAP-induced hepatotoxicity. However, in the Txnrd1ΔLiv mice, CYP2E1 levels were only mildly reduced in response to APAP treatment (Figure 4). QPCR analysis demonstrated that Cyp2e1 gene expression was not significantly different when comparing control and Txnrd1ΔLiv mice receiving similar treatments (Figure 5B). However, Cyp2e1 expression was significantly down-regulated in Txnrd1ΔLiv mice following APAP treatment.
Figure 5.

QPCR analysis following APAP treatment. Control and Txnrd1ΔLiv mice (n = 3) were treated or untreated with a hepatotoxic dose of APAP for 6 h and mRNA levels determined for (A) enzymes involved in glutathione metabolism (Gstal, Gsta2, Gclc, Gsr, and Gss), (B) Cyp2e1, and (C) the transporters Abcc3 and Abcc4. *P < 0.05.
The ABC transporters, ABCC3/MRP3 and ABCC4/MRP4, are also regulated by NRF2 and are important for mediating APAP detoxication in the liver.30,31 Expression of the Abcc3/ Mrp3 and Abcc4/Mrp4 transporter mRNAs were also elevated in Txnrd1ΔLiv mice compared with the control (Figure 5C). In untreated Txnrd1ΔLiv mice, Abcc3/Mrp3 mRNA was elevated 2-fold above control mice, and in APAP-treated Txnrd1ΔLiv animals, this mRNA was elevated 3-fold above the control. Interestingly, in untreated Txnrd1ΔLiv mice, Abcc4/Mrp4 mRNA was increased 32-fold above control mice, and in APAP-treated, Txnrd1ΔLiv animals, it was elevated 15-fold above. Overall, these results strongly suggest that Txnrd1ΔLiv mice are primed for xenobiotic detoxication.
Txnrd1ΔLiv Mice Metabolize APAP through Different Pathways Compared to Those in Controls.
Given that Txnrd1ΔLiv mice have elevated GSTs and expression of the Abcc transporter, it was important to determine APAP metabolism in Txnrd1ΔLiv mice. Therefore, a metabolomic investigation was conducted comparing urine from control and Txnrd1ΔLiv animals treated with 400 mg/kg APAP in order to elucidate the metabolic fate of APAP in both genotypes. Urine samples from control and Txnrd1ΔLiv mice treated with APAP were clearly distinguished from each other by PCA (not shown) and OPLS analyses (Supporting Information, Figure S4A-B) with APAP metabolites contributing mostly to the observed separation. We did not find an indication of kidney toxicity at these doses as indicated by the lack of change in creatinine excretion (Supporting Information, Figure S5). Interestingly, unconjugated APAP and APAP-sulfate (Figure 6A) were reduced 3-fold (p < 0.001 and p < 0.05, respectively) in Txnrd1ΔLiv mice compared with that in the controls. APAP-glucuronide was marginally reduced in Txnrd1ΔLiv animals. In the Txnrd1ΔLivmice, levels of 3- methoxy-APAP-glucuronide and 3-thiomethyl-APAP-sulfate (Figure 6A) were increased 2- and 3-fold, respectively. 3- Thiomethyl-APAP-sulfate was identified based on accurate mass measurement and tandem MS fragmentography (Supporting Information, Figure S4C). Levels of urinary APAP-CYS and NAC-APAP (Figure 6A), which are degradation products of APAP-glutathione that are presumably generated in the kidney, were unchanged at this dose but were significantly reduced in serum (Supporting Information, Figure S6).
Figure 6.
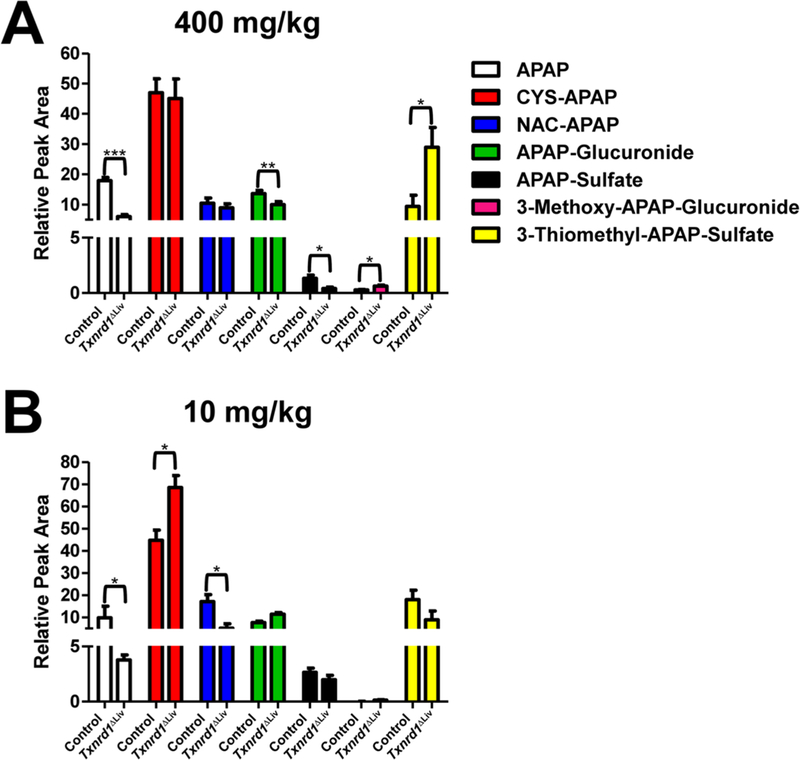
APAP metabolism. Urine samples from APAP-treated control and Txnrd1ΔLiv mice (n = 3) were examined for APAP and resulting metabolites for 6 h. (A) APAP and APAP metabolites after the 400 mg/kg dose: APAP (white bars), CYS-APAP (red bars), NAC-APAP (blue bars), APAP- glucuronide (green bars), APAP-sulfate (black bars), 3-methoxy-APAP-glucuronide (pink bars), and 3-thiomethyl-APAP-sulfate (yellow bars) are represented as percent of the total dose. (B) APAP and APAP metabolites after the 10 mg/kg dose. *P < 0.05; **P < 0.01; ***P < 0.001. Relative peak area denotes the individual metabolite normalized by the total peak area for APAP and the six metabolites.
APAP metabolism was also evaluated in control and Txnrd1ΔLiv mice after receiving a substantially lower dose of APAP, 10 mg/kg, in order to map the metabolic route of APAP, when pathways were not saturated and not causing overt organ toxicity. After receiving a subtoxic dose, Txnrd1ΔLiv mice levels of APAP and NAC-APAP were reduced 2.5- and 3.3-fold, respectively (Figure 6B). Interestingly, the Txnrd1ΔLiv mice excreted 1.5-fold more CYS-APAP than the controls. All other APAP metabolites that were examined were not different between the two genotypes.
DISCUSSION
The present study reports the finding that disruption of Txnrd1 in the mouse liver provides enhanced recovery from acute APAP- induced hepatotoxicity primarily through NRF2 activation and improved scavenging of ROS. Treatment of mice lacking Txnrd1 in liver with toxic doses of APAP resulted in enhanced recovery as indicated by H&E liver sections showing no significant liver damage or lower serum ALT and AST liver enzymes levels. Furthermore, Txnrd1ΔLiv mice recovered from depleted GSH levels at 1 h and were primed for detoxication of APAP as indicated by the increased expression and protein levels of GSTs, other enzymes in the glutathione system, and the transporters, ABCC3 and ABCC4. However, and perhaps most intriguing, despite the lack of Txnrd1 expression in the liver, knockout mice showed potent induction of c-JUN and c-FOS following APAP exposure similar to their control counterparts. In addition, they exhibited phosphorylation of JNK, a key initiator of hepatic necrosis and apoptosis.
The observation that Txnrd1ΔLiv mice are resistant to acute APAP-induced hepatotoxicity is consistent with increased NRF2 activity in these mice.28 Furthermore, liver-specific deletion of autophagy protein 5 (ATG5) results in similar up-regulation of the NRF2 pathway and renders the mice protected from hepatotoxic doses ofAPAP.32 In Txnrd1ΔLiv mice, elevated levels of GSTs and other enzymes in the glutathione system, as well as ABCC3/4 transporters, likely contribute to the conjugation and rapid expulsion of APAP from hepatocytes.33,34 This is also evident by the increased production of urinary CYS-APAP (produced from GSH-APAP) in the Txnrd1ΔLiv mice treated with a low dose of APAP (10 mg/kg). Despite this, Txnrd1ΔLiv mice still exhibited activation of the JNK pathway (phosphory- lated JNK, elevated c-JUN, and c-FOS), most likely due to the initial depletion of GSH (Figure 2), and manifested similar levels of APAP protein adducts. Others have reported that APAP protein adducts can occur without apparent liver injury.35 This is particularly interesting given that in Askl-null mice, c-JUN and c-FOS expression were dramatically reduced, and JNK levels were highly activated. Current models suggest that the rapid depletion of glutathione caused by the production of NAPQI leads to the generation ofROS and hence activation of ASK1 and JNK.36 An additional explanation of increased p-JNK levels is that ASK1 is hyperactivated without regulation by TXNRD1. However, in untreated Txnrd1ΔLiv mice, no phosphorylation of JNK was detected. It is also likely that another factor (e.g., GSIK-3β) in addition to GSH depletion in the mitochondria may be responsible.37
Another interesting observation is the differential metabolism of APAP in Txnrd1ΔLiv mice compared to that in control mice. Formation of 3-thiomethyl-APAP-sulfate at high doses has been reported in rodents, dogs, and humans that is likely generated from GSH-APAP, and in Txnrd1ΔLiv mice, the high levels of 3- thiomethyl-APAP-sulfate also likely arises from the enhanced action of GSTs.38,39 Interestingly, the activity of cysteine S- conjugate β-lyases can shunt cysteine conjugates, such as NAC- or CYS-APAP, to the synthesis of the thiomethyl conjugate as part of what is known as the thiomethyl shunt.40 Other drugs, including methazolamide, cisplatin, and busulfan, can undergo metabolism via this route, and this enzymatic activity is evolutionarily conserved in bacteria and fungi.40 It also cannot be ruled out that the synthesis of 3-thiomethyl-APAP-sulfate metabolite is formed by gut bacteria that also possess β-lyase activity. What is most intriguing is the unique relationship between selenoproteins and cysteine Se-conjugate β-lyases, and while speculative, it seems reasonable that TRX may be important for detoxifying reactive metabolites of APAP.
It is also of interest to note that Txnrd1 deletion enhances tumor cell killing especially after treatment with the GSH depleting agent, L-buthionine sulfoximine (BSO), a highly specific and irreversible inhibitor of γ-glutamyl-cysteine- synthetase (γ-GCS).19,41 This presumable discrepancy might be explained in light of the different modes of action of BSO and APAP. Whereas BSO is a very strong and rapid inducer of GSH depletion by efficiently inhibiting γ-GCS and results in de novo synthesis of GSH, APAP causes depletion of available GSH leading to a compensatory NRF2 dependent up-regulation of Gclc/Gclm and related enzymes. Enhancement of these NRF2 induced enzymes in turn leads to a higher steady-state GSH synthesis, which is suggested by our data.
Numerous investigators have recognized an interrelationship between the TRX and GSH systems, particularly in tumors and cancer cells [for example, see refs 19 and 42 and references therein]. Tumors and cancer cells require a strong antioxidant system or systems due to the fact that they suffer from oxidative stress, and the down-regulation of one system in malignancy often results in an up-regulation of another system [see reviews in refs 43–45]. Thus, it is not surprising that Txnrd1ΔLiv mice have elevated levels of the GSH system, which contributes to improved ROS scavenging and ultimately reduced acute hepatotoxicity. In conclusion, the present findings may be taken into account when designing novel treatment strategies to ameliorate APAP induced liver toxicity, for instance, by transiently inhibiting Txnrd1 leading to an NRF2-dependent up-regulation of hepatic detoxifying genes.
Supplementary Material
Acknowledgments
Funding
This work was supported by the Intramural Research Program at the Center for Cancer Research, National Cancer Institute, National Institutes of Health (to D.L.H. and F.J.G.).
ABBREVIATIONS
- ABC transporters
ABCC3/MRP3 and ABCC4/MRP4
- APAP
acetaminophen
- ALT
alanine aminotransferase
- ASK1
apoptosis signaling-regulating kinase 1
- AST
aspartate aminotransferase
- GPX1
glutathione peroxidase 1
- GSK-3β
glycogen synthase kinase-3β
- GST-α, -μ, and -π
glutathione S-transferase-α, -μ, and -π
- GST1A and GST2A
glutathione S-transferase 1A and −2A
- JNK
c-Jun N-terminal kinase
- NRF2
nuclear factor erythroid 2-related factor 2
- PCA
principal components analysis
- RNS
reactive nitrogen species
- ROS
reactive oxygen species
- Trx
thioredoxin
- Txnrd1
thioredoxin reductase 1
Footnotes
The authors declare no competing financial interest.
Supporting Information
Histopathological analysis of additional mouse livers from control or Txnrd1ΔLiv mice, characterization of livers from control and Txnrd1ΔLiv mice, western blot analysis of APAP protein adducts, identification ofAPAP metabolites in urine from control and Txnrd1ΔLiv mice, characterization of creatinine in control and Txnrd1ΔLiv mice, and quantitation of APAP metabolites in serum. This material is available free of charge via the Internet at http://pubs.acs.org.
REFERENCES
- (1).Chun LJ, Tong MJ, Busuttil R W., and Hiatt JR (2009) Acetaminophen hepatotoxicity and acute liver failure. J. Clin. Gastroenterol. 43, 342–349. [DOI] [PubMed] [Google Scholar]
- (2).Gunawan BK, Liu ZX, Han D, Hanawa N, Gaarde WA, and Kaplowitz N (2006) c-Jun N-terminal kinase plays a major role in murine acetaminophen hepatotoxicity. Gastroenterology 131, 165–178. [DOI] [PubMed] [Google Scholar]
- (3).Henderson NC, Pollock KJ, Frew J, Mackinnon AC, Flavell RA, Davis R, Sethi T, and Simpson KJ (2007) Critical role of c- jun (NH2) terminal kinase in paracetamol- induced acute liver failure. Gut 56, 982–990. [DOI] [PMC free article] [PubMed] [Google Scholar]
- (4).Latchoumycandane C, Goh CW, Ong MM, and Boelsterli UA (2007) Mitochondrial protection by the JNK inhibitor leflunomide rescues mice from acetaminophen-induced liver injury. Hepatology 45, 412–421. [DOI] [PubMed] [Google Scholar]
- (5).Nakagawa H, Maeda S, Hikiba Y, Ohmae T, Shibata W, Yanai A, Sakamoto K, Ogura K, Noguchi T, Karin M, Ichijo H, and Omata M (2008) Deletion of apoptosis signal-regulating kinase 1 attenuates acetaminophen-induced liver injury by inhibiting c-Jun N- terminal kinase activation. Gastroenterology 135, 1311–1321. [DOI] [PubMed] [Google Scholar]
- (6).Win S, Than TA, Han D, Petrovic LM, and Kaplowitz N (2011) c-Jun N-terminal kinase (jNK)-dependent acute liver injury from acetaminophen or tumor necrosis factor (TNF) requires mitochondrial Sab protein expression in mice. J. Biol. Chem. 286, 35071–35078. [DOI] [PMC free article] [PubMed] [Google Scholar]
- (7).Saitoh M, Nishitoh H, Fujii M, Takeda K, Tobiume K, Sawada Y, Kawabata M, Miyazono K, and Ichijo H (1998) Mammalian thioredoxin is a direct inhibitor of apoptosis signal- regulating kinase (ASK) 1. EMBO J. 17, 2596–2606. [DOI] [PMC free article] [PubMed] [Google Scholar]
- (8).Knight TR, Ho YS, Farhood A, and Jaeschke H (2002) Peroxynitrite is a critical mediator of acetaminophen hepatotoxicity in murine livers: protection by glutathione. J. Pharmacol. Exp. Ther. 303, 468–475. [DOI] [PubMed] [Google Scholar]
- (9).Tao L, Jiao X, Gao E, Lau G, Sharma K, Koch W, and Ma XL (2006) Nitrative inactivation of thioredoxin-1 and its role in postischemic myocardial apoptosis. Circulation 114, 1395–1402. [DOI] [PubMed] [Google Scholar]
- (10).Turanov AA, Kehr S, Marino SM, Yoo MH, Carlson BA, Hatfield DL, and Gladyshev VN (2010) Mammalian thioredoxin reductase 1: roles in redox homoeostasis and characterization of cellular targets. Biochem. J. 430, 285–293. [DOI] [PMC free article] [PubMed] [Google Scholar]
- (11).Turanov AA, Hatfield DL, and Gladyshev VN (2010) Characterization of protein targets of mammalian thioredoxin reductases. Methods Enzymol 474, 245–254. [DOI] [PMC free article] [PubMed] [Google Scholar]
- (12).Jakupoglu C, Przemeck GK, Schneider M, Moreno SG, Mayr N, Hatzopoulos AK, de Angelis MH, Wurst W, Bornkamm GW, Brielmeier M, and Conrad M (2005) Cytoplasmic thioredoxin reductase is essential for embryogenesis but dispensable for cardiac development. Mol. Cell. Biol. 25, 1980–1988. [DOI] [PMC free article] [PubMed] [Google Scholar]
- (13).Fujino G, Noguchi T, Takeda K, and Ichijo H (2006) Thioredoxin and protein kinases in redox signaling. Semin. Cancer Biol. 16, 427–435. [DOI] [PubMed] [Google Scholar]
- (14).Rundlof AK, and Arner ES (2004) Regulation of the mammalian selenoprotein thioredoxin reductase 1 in relation to cellular phenotype, growth, and signaling events. Antioxid. Redox Signaling 6, 41–52. [DOI] [PubMed] [Google Scholar]
- (15).Biaglow JE, andMiller RA. (2005) The thioredoxin reductase/ thioredoxin system: novel redox targets for cancer therapy. Cancer Biol. Ther. 4, 6–13. [DOI] [PubMed] [Google Scholar]
- (16).Arner ES, and Holmgren A (2006) The thioredoxin system in cancer-introduction to a thematic volume of Seminars in Cancer Biology. Semin. Cancer Biol. 16, 419. [DOI] [PubMed] [Google Scholar]
- (17).Hatfield DL, Yoo MH, Carlson BA, and Gladyshev VN (2009) Selenoproteins that function in cancer prevention and promotion. Biochim. Biophys. Acta Gen. Subj. 1790, 1541–1545. [DOI] [PMC free article] [PubMed] [Google Scholar]
- (18).Yoo MH, Carlson BA, Tsuji PA, Tobe R, Naranjo-Suarez S, Lee BJ, Davis CD, Gladyshev VN, and Hatfield DL (2012) Selenoproteins Harboring a Split Personality in Both Preventing and Promoting Cancer, in Selenium: Its Molecular Biology and Role in Human Health (Hatfield DL., Berry MJ., and Gladyshev VN., Eds.) pp 325–333, Springer Science + Business Media, LLC, New York. [Google Scholar]
- (19).Mandal PK, Schneider M, Kolle P, Kuhlencordt P, Forster H, Beck H, Bornkamm GW, and Conrad M (2010) Loss of thioredoxin reductase 1 renders tumors highly susceptible to pharmacologic glutathione deprivation. Cancer Res. 70, 9505–9514. [DOI] [PubMed] [Google Scholar]
- (20).Mirochnitchenko O, Weisbrot-Lefkowitz M, Reuhl K, Chen L, Yang C, and Inouye M (1999) Acetaminophen toxicity. Opposite effects of two forms of glutathione peroxidase. J. Biol. Chem. 274, 10349–10355. [DOI] [PubMed] [Google Scholar]
- (21).Zhu JH, Zhang X, McClung JP, and Lei XG (2006) Impact of Cu, Zn-superoxide dismutase and Se-dependent glutathione peroxidase-1 knockouts on acetaminophen-induced cell death and related signaling in murine liver. Exp. Biol. Med. (Maywood, NJ, U.S.) 231, 1726–1732. [DOI] [PubMed] [Google Scholar]
- (22).Zhu JH, McClung JP, Zhang X, Aregullin M, Chen C, Gonzalez FJ, Kim TW, and Lei XG (2009) Comparative impacts of knockouts of two antioxidant enzymes on acetaminophen-induced hepatotoxicity in mice. Exp. Biol. Med. (Maywood, NJ U.S.) 234, 1477–1483. [DOI] [PMC free article] [PubMed] [Google Scholar]
- (23).Zhu JH, and Lei XG (2006) Double null of selenium- glutathione peroxidase-1 and copper, zinc-superoxide dismutase enhances resistance of mouse primary hepatocytes to acetaminophen toxicity. Exp. Biol. Med. (Maywoodj NJ U.S.) 231, 545–552. [DOI] [PubMed] [Google Scholar]
- (24).Lei XG, Zhu JH, McClung JP, Aregullin M, and Roneker CA (2006) Mice deficient in Cu,Zn-superoxide dismutase are resistant to acetaminophen toxicity. Biochem. J. 399, 455–461. [DOI] [PMC free article] [PubMed] [Google Scholar]
- (25).Lei XG, Cheng WH, and McClung JP (2007) Metabolic regulation and function of glutathione peroxidase-1. Annu. Rev. Nutr. 27, 41–61. [DOI] [PubMed] [Google Scholar]
- (26).Yuan L, and Kaplowitz N (2009) Glutathione in liver diseases and hepatotoxicity. Mol. Aspects Med. 30, 29–41. [DOI] [PubMed] [Google Scholar]
- (27).Patterson AD, Bonzo JA, Li F, Krausz KW, Eichler GS, Aslam S, Tigno X, Weinstein JN, Hansen BC, Idle JR, and Gonzalez FJ (2011) Metabolomics reveals attenuation of the SLC6A20 kidney transporter in nonhuman primate and mouse models of type 2 diabetes mellitus. J. Biol. Chem. 286, 19511–19522. [DOI] [PMC free article] [PubMed] [Google Scholar]
- (28).Suvorova ES, Lucas O, Weisend CM, Rollins MF, Merrill GF, Capecchi MR, and Schmidt EE (2009) Cytoprotective Nrf2 pathway is induced in chronically txnrd 1-deficient hepatocytes. PLoS One 4, e6158. [DOI] [PMC free article] [PubMed] [Google Scholar]
- (29).Cheung C, Yu AM, Ward JM, Krausz KW, Akiyama TE, Feigenbaum L, and Gonzalez FJ (2005) The cyp2e1-humanized transgenic mouse: role of cyp2e1 in acetaminophen hepatotoxicity. Drug Metab. Dispos. 33, 449–457. [DOI] [PubMed] [Google Scholar]
- (30).Aleksunes LM, Slitt AL, Maher JM, Augustine LM, Goedken MJ, Chan JY, Cherrington NJ, Klaassen CD, and Manautou JE (2008) Induction of Mrp3 and Mrp4 transporters during acetaminophen hepatotoxicity is dependent on Nrf2. Toxicol. Appl. Pharmacol. 226, 74–83. [DOI] [PMC free article] [PubMed] [Google Scholar]
- (31).Cheng Q, Taguchi K, Aleksunes LM, Manautou JE, Cherrington NJ, Yamamoto M, and Slitt AL (2011) Constitutive activation of nuclear factor-E2-related factor 2 induces biotransformation enzyme and transporter expression in livers of mice with hepatocyte-specific deletion of Kelch-like ECH-associated protein 1. J. Biochem. Mol. Toxicol. 25, 320–329. [DOI] [PMC free article] [PubMed] [Google Scholar]
- (32).Ni HM, Boggess N, McGill MR, Lebofsky M, Borude P, Apte U, Jaeschke H, and Ding WX (2012) Liver-specific loss of Atg5 causes persistent activation of Nrf2 and protects against acetaminophen- induced liver injury. Toxicol. Sci. l27, 438–450. [DOI] [PMC free article] [PubMed] [Google Scholar]
- (33).Zamek-Gliszczynski MJ, Nezasa K, Tian X, Bridges AS, Lee K, Belinsky MG, Kruh GD, and Brouwer KL (2006) Evaluation of the role of multidrug resistance-associated protein (Mrp) 3 and Mrp4 in hepatic basolateral excretion of sulfate and glucuronide metabolites of acetaminophen, 4-methylumbelliferone, and harmol in Abcc3−/− and Abcc4−/− mice. J. Pharmacol. Exp. Ther. 319, 1485–1491. [DOI] [PubMed] [Google Scholar]
- (34).Dai G, Chou N, He L, Gyamfi MA, Mendy AJ, Slitt AL, Klaassen CD, and Wan YJ (2005) Retinoid X receptor alpha regulates the expression of glutathione s-transferase genes and modulates acetaminophen-glutathione conjugation in mouse liver. Mol. Pharmacol. 68, 1590–1596. [DOI] [PubMed] [Google Scholar]
- (35).McGill MR, Lebofsky M, Norris HR, Slawson MH, Bajt ML, Xie Y, Williams CD, Wilkins DG, Rollins DE, and Jaeschke H (2013) Plasma and liver acetaminophen-protein adduct levels in mice after acetaminophen treatment: Dose-response, mechanisms, and clinical implications. Toxicol. Appl. Pharmacol. 269, 240–249. [DOI] [PMC free article] [PubMed] [Google Scholar]
- (36).Jones DP, Lemasters JJ, Han D, Boelsterli UA, and Kaplowitz N (2010) Mechanisms of pathogenesis in drug hepatotox- icity putting the stress on mitochondria. Mol. Interventions 10, 98–111. [DOI] [PMC free article] [PubMed] [Google Scholar]
- (37).Shinohara M, Ybanez MD, Win S, Than TA, Jain S, Gaarde WA, Han D, and Kaplowitz N (2010) Silencing glycogen synthase kinase-3beta inhibits acetaminophen hepatotoxicity and attenuates JNK activation and loss of glutamate cysteine ligase and myeloid cell leukemia sequence 1. J. Biol. Chem. 285, 8244–8255. [DOI] [PMC free article] [PubMed] [Google Scholar]
- (38).Klutch A, Levin W, Chang RL, Vane F, and Conney AH (1978) Formation of a thiomethyl metabolite of phenacetin and acetaminophen in dogs and man. Clin. Pharmacol. Ther. 24, 287–293. [DOI] [PubMed] [Google Scholar]
- (39).Hart SJ, Healey K, Smail MC, and Calder IC (1982) 3- thiomethylparacetamol sulphate and glucuronide: metabolites of paracetamol and N-hydroxyparacetamol. Xenobiotica 12, 381–386. [DOI] [PubMed] [Google Scholar]
- (40).Cooper AJ, Krasnikov BF, Niatsetskaya ZV, Pinto JT, Callery PS, Villar MT, Artigues A, and Bruschi SA (2011) Cysteine S-conjugate beta-lyases: important roles in the metabolism of naturally occurring sulfur and selenium-containing compounds, xeno- biotics and anticancer agents. Amino Acids 41, 7–27. [DOI] [PMC free article] [PubMed] [Google Scholar]
- (41).Mandal PK, Seiler A, Perisic T, Kolle P, Banjac Canak A, Forster H, Weiss N, Kremmer E, Lieberman MW, Bannai S, Kuhlencordt P, Sato H, Bornkamm GW, and Conrad M (2010) System x(c)- and thioredoxin reductase 1 cooperatively rescue glutathione deficiency. J. Biol. Chem. 285, 22244–22253. [DOI] [PMC free article] [PubMed] [Google Scholar]
- (42).Carlson BA, Yoo MH, Tobe R, Mueller C, Naranjo-Suarez S, Hoffmann VJ, Gladyshev VN, and Hatfield DL (2012) Thioredoxin reductase 1 protects against chemically induced hepatocarcinogenesis via control of cellular redox homeostasis. Carcinogenesis 33, 1806–1813. [DOI] [PMC free article] [PubMed] [Google Scholar]
- (43).Franco R, and Cidlowski JA (2009) Apoptosis and glutathione: beyond an antioxidant. Cell Death Differ. 16, 1303–1314. [DOI] [PubMed] [Google Scholar]
- (44).Corti A, Franzini M, Paolicchi A, and Pompella A (2010) Gamma-glutamyltransferase of cancer cells at the crossroads of tumor progression, drug resistance and drug targeting. Anticancer Res. 30, 1169–1181. [PubMed] [Google Scholar]
- (45).Montero AJ, and Jassem J (2011) Cellular redox pathways as a therapeutic target in the treatment of cancer. Drugs 71, 1385–1396. [DOI] [PubMed] [Google Scholar]
Associated Data
This section collects any data citations, data availability statements, or supplementary materials included in this article.