

Abstract
Aim
Cirrhosis is a leading cause of death worldwide, yet there are no well‐established risk stratifying tools for lethal complications, including hepatocellular carcinoma (HCC). Patients with liver cirrhosis undergo routine endoscopic surveillance, providing ready access to duodenal aspirate samples that could be a source for identifying novel biomarkers. The aim of this study was to characterize the microbiome and bile acid profiles in duodenal aspirates from patients with liver cirrhosis to assess the feasibility of developing biomarkers for HCC risk stratification.
Methods
Thirty patients with liver cirrhosis were enrolled in the Microbiome, Microbial Markers, and Liver Disease study between May 2015 and March 2017. Detailed clinical and epidemiological data were collected at baseline and at 6‐monthly follow‐up visits. Duodenal aspirate fluid was collected at baseline for microbial characterization using 16S ribosomal RNA sequencing and bile acid quantification using mass spectroscopy.
Results
Alcohol‐related cirrhosis was associated with reductions in the Bacteroidetes phylum, particularly Prevotella (13‐fold reduction), and expansion of Staphylococcus (13‐fold increase), compared to hepatitis C virus‐related cirrhosis. Participants with hepatic encephalopathy (HE) had less microbial diversity compared to patients without HE (P < 0.05), and were characterized by expansion of Mycobacterium (45‐fold increase) and Gram‐positive cocci including Granulicatella (3.1‐fold increase), unclassified Planococcaceae (3.3‐fold increase), and unclassified Streptococcaceae (4.5‐fold increase). Non‐Hispanic White patients had reduced microbial richness (P < 0.01) and diversity (P < 0.05), and increased levels of conjugated ursodeoxycholic acid (glycoursodeoxycholic acid and tauroursodeoxycholic acid, P < 0.05) compared to Hispanic patients.
Conclusion
Microbial profiles of duodenal aspirates differed by cirrhosis etiology, HE, and Hispanic ethnicity.
Keywords: bile acids, cirrhosis, microbiome
Introduction
Liver cirrhosis is one of the leading causes of death worldwide, accounting for over 49 000 deaths in 2010.1 Although there are many serious complications related to cirrhosis, hepatocellular carcinoma (HCC) is one of the leading causes of death in this cohort. Hepatocellular carcinoma is the fifth most commonly diagnosed cancer worldwide in adult men, and is the second leading cause of cancer‐related mortality in the world.2 The burden of HCC depends heavily on age and ethnicity. Older Hispanic men have the highest HCC incidence rate of any major demographic group, and HCC risk overall is nearly three times higher in Hispanics compared to non‐Hispanic White people.3, 4 Advanced HCC is essentially untreatable with most patients surviving less than 6 months, explaining the low 5‐year survival rate of 18%.4 However, given the long subclinical growth period for HCC, effective early detection could allow for curative interventions.
Currently there is no well‐established biomarker to predict which patients with cirrhosis will develop HCC. However, recent advances in our understanding of gut microbes, microbial products, and bile acids have provided insight into how imbalances in the gut–liver axis influence the progression from cirrhosis to HCC.5 Lipopolysaccharide (also known as endotoxin, a potent immunogenic component of certain bacterial cell membranes) can promote hepatocyte damage and transformation by activating immune cells, inducing cytokine secretion, and inducing reactive oxygen species.6, 7, 8 Furthermore, one of the major roles of the gut microbiome is to metabolize primary bile acids into secondary bile acids to be recirculated as part of the enterohepatic circulation.7 In cirrhosis, inefficiency in capturing and secreting bile acids results in bile acid accumulation in the liver where they can act as carcinogens.6, 8, 9 Therefore, the gut microbiota and bile acid analysis can provide the basis for potentially novel biomarkers.
We hypothesize that small intestinal microbiota and bile acids could serve as biomarkers for early diagnosis of HCC. As an initial step into investigating these biomarkers, we carried out this study to examine the feasibility of using duodenal aspirates during routine upper endoscopy as a means of collecting and analyzing bile acids and the gut microbiome. We show that there is an association between the microbiome and bile acid composition of duodenal aspirate samples with cirrhosis etiology, cirrhosis complications, and race/ethnicity. This study is based in an ongoing cohort study of a diverse population of participants with liver cirrhosis. Our results indicate the feasibility of the duodenal aspirate sampling strategy and the potential application of duodenal microbial signatures as biomarkers.
Methods
Study cohort
This study was nested within an ongoing prospective cohort study of participants with liver cirrhosis to investigate biomarkers for HCC development, the Microbiome, Microbial Markers, and Liver Disease (M3LD) study. Patients with a diagnosis of liver cirrhosis confirmed by biopsy or imaging, who were 18 years of age or older, were eligible for the study. Having a prior organ transplant or diagnosis of HCC were exclusion criteria. Participants were recruited and consented at the time of a standard of care upper gastrointestinal endoscopy screening procedure at Cedars‐Sinai Medical Center or Ronald Reagan UCLA Medical Center (both Los Angeles, CA, USA). Cirrhosis‐related clinical data (e.g. etiology, complications, and clinical laboratory tests) and medication usage were captured from electronic medical records using standardized case report forms. The etiology of each patient's cirrhosis was obtained by chart review of their clinical hepatology notes. Non‐alcoholic fatty liver disease patients had no history of heavy alcohol use defined per standard clinical criteria based on the US Department of Health and Human Services of >1 standard drink per day for women and >2 standard drinks per day for men.10 The present study cohort consists of 30 participants enrolled in 2016–2017.
The additional time and procedural risk with adding duodenal aspiration to routine upper endoscopy were negligible. No patients had any adverse events due to the added procedure. The study was approved by the Institutional Review Boards at Cedars‐Sinai Medical Center and the University of California, Los Angeles. Verbal and written informed consent for duodenal aspiration was obtained from all patients.
Aspirate fluid collection and processing
Duodenal aspirates were collected during an esophagogastroduodenoscopy through a sterile disposable aspiration catheter passed through the working channel of the upper endoscope, its tip positioned in the 2nd portion of the duodenum distal to the ampulla of Vater. Upon reaching the area of interest, any fluid present was aspirated and collected first into the aspirate container attached to the catheter. If less than 15 mL fluid was collected, 30 mL sterile water was flushed by syringe and recollected immediately by aspiration. The aspirate fluid was immediately transported over ice to the processing laboratory where it was aliquoted into barcoded vials and placed in a −80°C freezer for storage until biomarker testing.
Standardization of aspirate samples
For data normalization and to compensate for the in vivo dilution of the duodenal aspirate during collection, protein content, osmolality, and visual color grade of the sample were determined. Protein content in the duodenal aspirate samples was determined using the Bradford method.11 Samples were analyzed on a Spectramax EMax (Molecular Devices, San Jose, CA, USA) microplate reader with SoftMax Pro version 4.6 (Molecular Devices, San Jose, CA, USA). Osmolality was analyzed on a Fiske Micro‐Osmometer model 210 (Advanced Instruments, Norwood, MA, USA). Each sample was visually inspected and assigned a color saturation grade: 0, clear; 1, light yellow; 2, moderate yellow; or 3, dark yellow. Coloration is a surrogate for the concentration of bile pigments (mostly bilirubin) in the sample.
Bile acid characterization
In total, 15 major bile acids were measured in human duodenal aspirate samples by Metabolon, Morrisville, NC, USA: cholic acid, chenodeoxycholic acid, deoxycholic acid, lithocholic acid, ursodeoxycholic acid (UDCA), glycocholic acid, glycochenodeoxycholic acid, glycodeoxycholic acid, glycoursodeoxycholic acid (GUDCA), taurocholic acid, taurochenodeoxycholic acid, taurodeoxycholic acid, taurolithocholic acid, tauroursodeoxycholic acid (TUDCA), and glycolithocholic acid.
Aliquots of 50.0 μL of each sample were extracted with an acidified methanol solution. Following centrifugation, the clear supernatant was diluted. For calibration and assay optimization, several dilution levels of the study samples were tested: 10‐fold, 1000‐fold, 10 000‐fold, and 100 000‐fold. For quality control (QC), diluted human bile samples were used to monitor method performance with most bile acid concentrations at the endogenous level.
Study samples and QC samples were spiked with a solution of labeled internal standards and evaporated to dryness in a gentle stream of nitrogen. The dried extracts were reconstituted and injected onto an Agilent 1290 (Santa Clara, CA, USA) /Sciex QTrap 6500 liquid chromatography–tandem mass spectrometry system equipped with a C18 reverse phase high‐performance liquid chromatography column. The mass spectrometer was operated in negative mode using electrospray ionization. The peak area of each bile acid parent (pseudo‐MRM mode) or product ion was measured against the peak area of the respective internal standard parent (pseudo‐MRM mode) or product ion.
Microbiome characterization: 16S ribosomal RNA sequencing
Genomic DNA was extracted from 0.5 mL duodenal aspirate using the Powersoil kit as per the manufacturer's instructions (MO BIO, Carlsbad, CA, USA). The V4 region of 16S ribosomal RNA (rRNA) genes was amplified and underwent paired end sequencing on an Illumina MiSeq (San Diego, CA, USA) as previously described.12 The 253 base pair reads were processed using QIIME version 1.9.1 with default parameters.13 Sequence depth ranged from 49 892 to 513 103 sequences per sample. Operational taxonomic units (OTUs) were picked against the May 2013 version of the Greengenes database, prefiltered at 97% identity. The OTUs were removed if they were present in fewer than three samples. Alpha diversity (i.e. diversity within a sample) and beta diversity (differences in composition across samples) were calculated in QIIME using OTU‐level data rarefied to 49 892 sequences.
Statistical analyses
For bile acids, quantitation was carried out using a weighted linear least squares regression analysis generated from fortified calibration standards prepared immediately prior to each run. Precision was evaluated using the corresponding QC replicates in each sample run. Intra‐run precision (% CV) of all analytes met acceptance criteria (only intra‐run precision was evaluated as samples were analyzed in a single batch). To examine the association between total bile acid levels and measures of protein content, osmolality, visual color grade, and patient and clinical parameters, we used linear regression models similar to prior published work.14
Microbiome data were analyzed for alpha diversity, beta diversity, and association of taxa abundance with clinical parameters. Alpha diversity refers to metrics of diversity within a community (i.e. patient sample), which pertain to the total number of species (richness), the total length along a phylogenetic tree covered by a community (phylogenetic diversity), or how evenly distributed the members of a community are among the species present (evenness).15 For this study, we used Faith's phylogenetic diversity (PD), Chao1 (a metric of richness), and Shannon index (a metric of evenness) with 97% OTUs representing the equivalent of species. The significance of differences in alpha diversity was calculated by two‐tailed t‐test. Beta diversity refers to comparison of microbial composition across communities (i.e. patient samples) based upon which species are present/absent or their relative abundances.16 In this study, beta diversity was calculated using unweighted UniFrac, a phylogenetic metric that compares the fraction of a phylogenetic tree that is covered by the species present in one sample compared to another, and visualized by principal coordinates analysis.16 Adonis, a permutational anova, was carried out using 100 000 permutations to test for differences in unweighted UniFrac distances across the color grade and various clinical features including cirrhosis etiology, cirrhosis complications, race/ethnicity, severity of cirrhosis, presence of diabetes, and certain medications associated with microbial shifts (rifaximin, lactulose, proton pump inhibitor, and UDCA).17 A Model for End‐stage Liver Disease (MELD) score ≥15 was used as a cut‐off value to stratify severity of cirrhosis consistent with practice guidelines.18 Association of microbial genera with color grade, clinical features, and medications as mentioned above were evaluated using DESeq2 in R, which uses an empirical Bayesian approach to shrink dispersion and fit non‐rarified count data to a negative binomial model.19 This method has previously been shown to be robust for detecting differences in the abundances of microbes in 16S rRNA datasets.20 P‐values for differential abundance were converted to q‐values to correct for multiple hypothesis testing (<0.05 for significance).21
Results
Patient demographics
The study cohort included 30 participants with a median age of 59.5 years (interquartile range, 56.7–62.2; Table 1). The majority of participants were men (60%). Most were White (77%), 10% were Black, 10% were Asian, and 3% were of mixed race. Among the White participants, 37% were Hispanic. The majority of patients had hepatitis C virus (HCV), alcohol (ETOH), or non‐alcoholic steatohepatitis (NASH) as the underlying etiology of their cirrhosis (50%, 27%, and 13%, respectively). Complications of cirrhosis included varices, ascites, or hepatic encephalopathy (HE) (77%, 57%, and 43%, respectively). Active treatment for HE was with lactulose (23%) and/or rifaximin (33%).
Table 1.
Selected characteristics of study participants
| Characteristic | n = 30 |
|---|---|
| Male sex, n (%) | 18 (60) |
| Age, years; median (IQR) | 59.5 (56.7–62.2) |
| Race, n (%) | |
| White | 23 (77) |
| Black | 3 (10) |
| Asian | 3 (10) |
| Mixed | 1 (3) |
| Ethnicity, n (%) | |
| Hispanic | 11 (37) |
| Non‐Hispanic White | 13 (43) |
| Other | 6 (20) |
| Cirrhosis etiology, n (%) | |
| HCV | 15 (50) |
| ETOH | 8 (27) |
| NASH | 4 (13) |
| HBV | 1 (3) |
| PSC | 1 (3) |
| AIH | 1 (3) |
| Laboratory data, mean (SE) | |
| International normalized ratio | 1.27 (0.04) |
| Total bilirubin | 2.39 (0.62) |
| Creatinine | 1.37 (0.27) |
| Sodium | 140.1 (0.67) |
| MELD‐Na | 14 (1.0) |
| Prior cirrhosis complications, n (%) | |
| Varices | 23 (77) |
| Ascites | 17 (57) |
| Encephalopathy | 13 (43) |
| Current lactulose use,† n (%) | 7 (23) |
| Current rifaximin use,† n (%) | 10 (33) |
| History of diabetes, n (%) | 5 (17) |
| Current proton pump inhibitor use,† n (%) | 17 (57) |
| Current ursodeoxycholic acid use,† n (%) | 2 (7) |
At time of duodenal specimen collection.
AIH, autoimmune hepatitis; ETOH, alcohol; HBV, hepatitis B virus; HCV, hepatitis C virus; IQR, interquartile range; MELD‐Na, Model for End‐stage Liver Disease + serum sodium; NASH, non‐alcoholic steatohepatitis; PSC, primary sclerosing cholangitis; SE, standard error.
Standardization of aspirate sample
Most samples fell below the limit of quantitation for protein content and osmolality, and these measures were weakly associated with total bile acid levels (Fig. S1A,B). Color grade was most strongly associated with total bile acid levels (P < 0.001; Fig. S1C).
Microbial differences based on color grade
To investigate whether sample color reflected microbial heterogeneity of samples obtained by duodenal aspiration, an initial analysis was carried out of microbial diversity for all the samples stratified by color grade, based on 16S rRNA sequence data. As color grade increased, there was a decrease in microbial richness measured by the number of types of organisms (Chao1, P < 0.05), PD measured by the evolutionary distance between organisms (Faith's PD, P < 0.05), and species evenness measured by the abundance of organisms across species (Shannon index, P < 0.001; Fig. 1a). Overall microbial composition as represented by UniFrac, a measure of phylogenetic similarity between samples, showed highly statistically significant differences in the microbiome of samples with color grade 0 compared to the other three color grades (P < 0.0001; Fig. 1b). Total measured bile acids were markedly lower in color grade 0 samples compared to color grade 1 (P < 0.01), grade 2 (P < 0.001), or grade 3 (P < 0.001), consistent with bile pigments such as bilirubin conferring color to the samples (Fig. 1c). Analysis of relative abundance of microbes at the phylum and genus levels confirmed taxonomic shifts by color grade categories (Fig. 1d,e). As the color grade increased, there were relatively fewer Bacteroidetes and more Firmicutes (P = 0.0005 for the trend in the Bacteroidetes : Firmicutes ratio), associated with expansion of Streptococcus compared to grade 0 samples. There was no association of cirrhosis etiology, composition, or race/ethnicity with color grade 0 as opposed to the other three color grades grouped together (data not shown).
Figure 1.
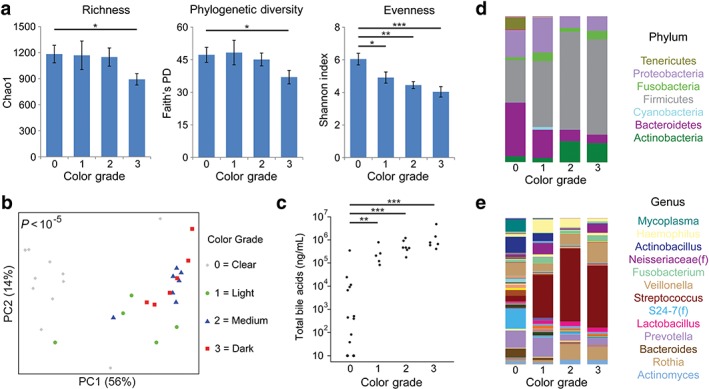
Aspirate color grade predicts specimen microbiome and bile acid profiles in cirrhotic patients. (a) Microbial diversity was assessed by richness (Chao1 index), phylogenetic diversity (Faith's PD), and evenness (Shannon index) for all duodenal aspirate samples stratified by color grade: 0, clear; 1, light yellow; 2, moderate yellow; or 3, dark yellow. Bars represent mean ± SEM. *P < 0.05; **P < 0.01; ***P < 0.001. (b) Overall microbial composition is represented in a principal coordinates (PC) analysis plot derived from unweighted UniFrac distances. Each symbol represents one patient, with color and shape representing color grade. P‐value for difference in UniFrac distance across groups is shown. (c) Total bile acid concentration is shown, stratified by color grade. (d) Bar graphs represent mean phyla abundances by color grade. Each color within the bar graphs represents a phylum, with area of the color proportional to relative abundance. (e) Genus level taxonomic summary by color grade. [Color figure can be viewed at wileyonlinelibrary.com]
Microbial differences based on etiology of cirrhosis
The observed microbial differences between color grades, particularly between color grade 0 and grades 1–3, and very low bile acid levels in samples with color grade 0, prompted us to limit further analyses to samples with color grades 1–3. Initial analysis focused on the relationship between duodenal aspirate microbial profiles and cirrhosis etiology. There were no significant differences in microbial diversity metrics among the three primary etiologies of cirrhosis: HCV (including all those who had additional contributing factors), ETOH, and NASH. However, there was a suggestive difference in microbial composition (P = 0.055) between cirrhosis patients with HCV compared to ETOH or NASH etiologies (Fig. 2a). In ETOH cirrhotic patients, there were relatively fewer Bacteroidetes and more Cyanobacteria and Firmicutes than those with HCV cirrhosis or NASH cirrhosis (Fig. 2b). Differential abundance testing was carried out at the genus level to identify microbes that distinguish HCV from ETOH cirrhosis, the two most common etiologies. Figure 2(c) shows log2 fold changes for genera with differential abundance between ETOH cirrhosis and HCV cirrhosis in DESeq2 models at q < 0.05. Alcohol‐associated cirrhosis had enrichment of Staphylococcus (13‐fold increase) and depletion of multiple genera within the Bacteroidetes and Firmicutes phyla including Prevotella (13‐fold reduction), [Prevotella] (493‐fold reduction; distinguished from Prevotella by being in the Paraprevotellaceae family), Dialister (11‐fold reduction), and Parvimonas (10‐fold reduction). There were no statistically significant differences in any of the 15 measured bile acids among the three cirrhosis etiologies (data not shown).
Figure 2.
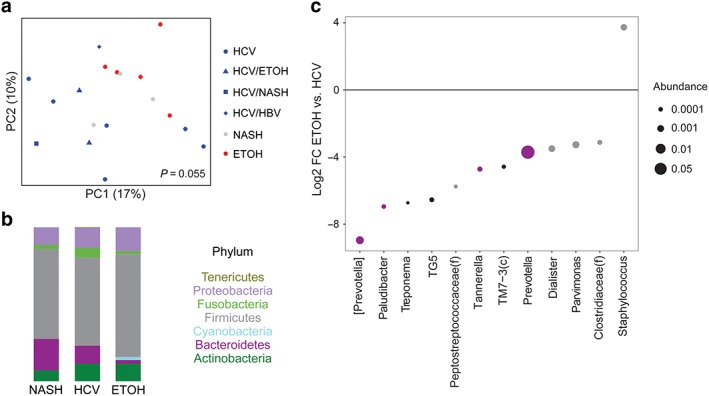
Alcohol (ETOH) cirrhosis is associated with reduced duodenal Prevotella compared to hepatitis C virus (HCV) and non‐alcoholic steatohepatitis (NASH) cirrhosis. (a) Principal coordinates (PC) analysis plot of microbial composition. Each color/shape combination represents a different cirrhosis etiology. P‐value is shown for the difference in UniFrac distance between ETOH cirrhosis and all HCV‐related cirrhosis. HBV, hepatitis B virus. (b) Phylum summary for NASH, HCV, and ETOH cirrhosis. Note that patients with HCV were included in the HCV category, irrespective of the existence of other etiologies. (c) Log2 fold changes (FC) are shown for genera with differential abundance between ETOH cirrhosis and HCV cirrhosis in DESeq2 models at q < 0.05. Dot size is proportional to the abundance of the genus and color corresponds to phylum as depicted in (b). [Color figure can be viewed at wileyonlinelibrary.com]
Microbial differences based on cirrhosis complications
There were no differences in microbial diversity or composition between patients with or without varices or between patients with or without ascites (data not shown). Compared to patients without HE, patients with HE had reduced PD (P < 0.05) and a non‐significant trend towards reduced microbial richness and evenness (Fig. 3a). There was a trend towards an overall difference in microbial composition by UniFrac analysis, although it was not significant (P = 0.13) (Fig. 3b). This corresponded to taxonomic shifts within the Firmicutes phylum evident at the genus level, characterized by expansion in HE patients of Mycobacterium (45‐fold) and Gram‐positive cocci including Granulicatella (3.1‐fold), unclassified Planococcaceae (3.3‐fold), and unclassified Streptococcaceae (4.5‐fold) as well as depletion of genera including Ruminococcus (4.5‐fold), Faecalibacterium (5.4‐fold), unclassified Lachnospiraceae (5.3‐fold), and unclassified Clostridiales (5.4‐fold) (Fig. 3c,d). There were no significant differences in the levels of any of the 15 bile acids between HE and non‐HE patients (data not shown).
Figure 3.
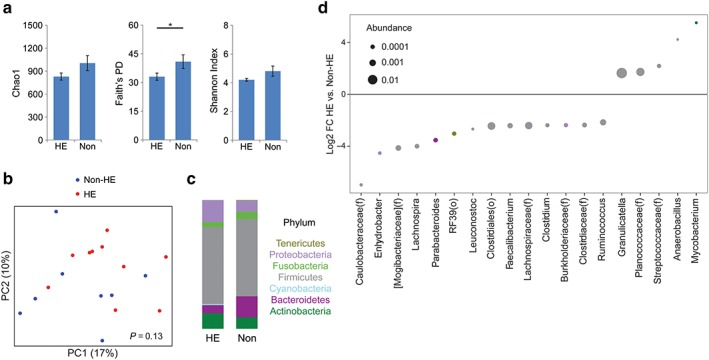
Hepatic encephalopathy (HE) is characterized by reduced diversity and altered composition of the duodenal microbiome. (a) Microbial richness, phylogenetic diversity, and evenness comparing patients with HE and those without (Non). *P < 0.05. (b) Principal coordinates (PC) analysis plot of microbial composition in samples with color grade 1–3. Red dots indicate patients with HE, blue indicates those without. (c) Phylum summary for HE and non‐HE patients. (d) Log2 fold changes (FC) are shown for genera with differential abundance between HE patients and non‐HE patients at q < 0.05. Dot size is proportional to the abundance of the genus and color corresponds to phylum. [Color figure can be viewed at wileyonlinelibrary.com]
Microbial and bile acid differences by Hispanic ethnicity
Finally, we tested for associations between duodenal microbes and bile acids with race/ethnicity. There were no differences in microbial diversity or composition between races, likely due to the small number of non‐White patients in this cohort, but differences were found between Hispanics and non‐Hispanic Whites (NHW). The latter had reduced microbial richness (P < 0.01) and PD (P < 0.05) compared to Hispanics (Fig. 4a). Although there were no significant shifts in overall microbial composition at the phylum level, at the genus level, Hispanic patients had increased abundance of three genera in the Lachnospiraceae family – Blautia (12‐fold), Lachnospira (15‐fold), and Coprococcus (15‐fold) – as well as increased abundance of unclassified Lachnospiraceae (4.4‐fold) (Fig. 4b–d). Bile acid profiles were shifted in Hispanic compared to NHW patients, characterized by lower levels of two conjugated forms of UDCA, GUDCA and TUDCA.
Figure 4.
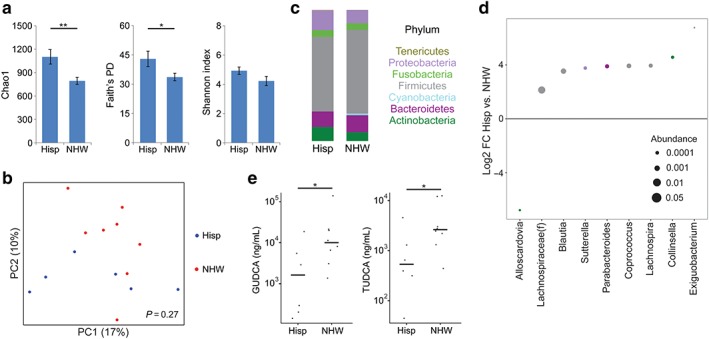
Hispanic ethnicity is associated with increased microbial diversity and decreased conjugated ursodeoxycholic acid in duodenal aspirates. (a) Microbial richness, phylogenetic diversity, and evenness are compared between non‐Hispanic White (NHW) and Hispanic (Hisp) cirrhosis patients. *P < 0.05; **P < 0.01. (b) Principal coordinates analysis plot of microbial composition comparing NHW (red) and Hispanic (blue) cirrhosis patients. (c) Phylum summary for NHW and Hispanic patients. (d) Log2 fold changes (FC) are shown for genera with differential abundance between NHW and Hispanic patients at q < 0.05. Dot size is proportional to the abundance of the genus and color corresponds to phylum. (e) Concentrations of glycoursodeoxycholic acid (GUDCA) and tauroursodeoxycholic acid (TUDCA) in duodenal aspirates are compared between Hispanic and NHW patients. [Color figure can be viewed at wileyonlinelibrary.com]
There were no microbial or bile acid differences with any other measured covariates, including the presence of diabetes, MELD‐Na score ≥ 15, the use of proton pump inhibitors, or the use of UDCA.
Discussion
This is one of the first studies to examine the foregut microbiome in cirrhotic patients. We show that the duodenal microbiome profile and bile acid composition of cirrhotic patients vary by cirrhosis etiology, the presence of HE, and Hispanic ethnicity. All cirrhotic patients are recommended to undergo routine screening upper endoscopies for esophageal and gastric varices, which provides an ideal time for foregut microbiome sampling. Studies investigating the microbiome of the small bowel have relied on duodenal biopsy, scraping, or aspiration of duodenal content after saline injection.22, 23, 24 In this study, we utilized duodenal aspiration as this would also allow for measurement of bile acids, which are of great interest given the preclinical reports implicating bile acids in hepatocarcinogenesis.
Our observation that the duodenal microbiome differs between HCV‐associated cirrhosis and ETOH‐associated cirrhosis is supported by previous studies observing microbial differences in duodenal biopsies according to cirrhosis etiology.25, 26 We found that, on a genus level, Prevotella was the dominant genus that was underrepresented in ETOH cirrhosis when compared to HCV cirrhosis. This finding is similar to other studies that showed a relative increase in Prevotella in the stool of HCV cirrhotic patients.27 The distinct dysbiosis associated with alcoholic cirrhosis might be linked to a downregulation of certain bactericidal proteins, Reg3b and Reg3g.28, 29 Furthermore, Provetella has been associated with a decrease in HCC growth in mice.30 Whether this association is true in humans is still under investigation.
We also observed differences in the duodenal microbiome according to the presence of HE, which is typically a late complication of cirrhosis. Although prior studies have shown that small intestinal bacterial overgrowth is associated with HE, we additionally found that patients with HE also have lower microbial richness and diversity in the duodenum compared to patients without HE.31, 32 Potentially related to this observation are prior reports that have linked lower diversity of the fecal microbiome to cirrhosis severity.33, 34 Lactulose, a non‐absorbable sugar, and rifaximin, a minimally absorbed antibiotic, are typically used as first‐line treatments for HE and were used by 7 and 10 participants in our study, respectively. Prior reports suggest that, although these treatments can have effects on bacterial metabolites and function, they have minimal effects on microbial composition.35, 36, 37
Our study also showed that the small intestinal microbiome of cirrhotics varies across ethnicity, with NHW study participants having lower richness and diversity than Hispanic participants. Hispanics also had lower levels of two conjugated forms of UDCA, a secondary bile acid with chemopreventive and anti‐inflammatory properties, which is increasingly used for the treatment of cholestatic liver diseases. Recent studies have suggested that UDCA can suppress HCC in vitro and in vivo, raising the possibility that bile acid differences could mediate differential susceptibility of Hispanic and NHW individuals to HCC.38, 39, 40 Dietary factors can have important contributions to the microbiome and composition of the bile acid pool,41, 42 and dietary differences by ethnicity could be contributing to these observed associations. We are currently collecting diet information through food frequency questionnaires on M3LD participants to facilitate more in‐depth analyses of the role of diet in these microbiome and bile acid associations in the future.
We observed significant heterogeneity in the microbiome by color of the aspirate samples. The coloration of the aspirate is directly linked to the amount of specimen present in the duodenum prior to injection with water: the dark samples came from participants who had fluid that was naturally pooling in the duodenum at the time of the endoscopy, who did not require flushing of the duodenum to obtain aspirate specimen. These dark samples are more likely to be characteristic of the luminal gut microbiome and of the naturally occurring concentration of bile acids present at the time of endoscopy. In contrast, a color grade 0 is more likely reflecting mucosal content due to the water injections releasing mucosal or adherent bacteria from the mucosal surface. A similar observation has been reported with respect to colonic lavage.43 Such samples would unsurprisingly have a lower concentration of bile acids as these are present primarily in the luminal secretions rather than on the mucosal surface.
This preliminary study shows several novel findings in patients with cirrhosis, but there are several limitations. It is a cross‐sectional study of only 30 patients, and many analyses excluded patients with color grade 0 samples due to their distinct microbial composition and low bile acid concentrations. Despite the modest number of patients, we found significant changes in the duodenal microbiome profile by important HCC risk factors. These results provide support for future investigations into duodenal aspirate biomarkers and risk of HCC in those with liver cirrhosis.
In conclusion, we present a novel approach using duodenal aspirates to evaluate the foregut microbiome and bile acid profiles of cirrhotic patients. With this method, we detected differences in duodenal microbiome profiles by etiology, presence of hepatic encephalopathy, and by Hispanic ethnicity. These observations provide preliminary data to further develop microbial biomarkers for risk prediction of cirrhosis‐related complications. Further long‐term studies should be undertaken to correlate these microbiome changes with disease outcomes such as HCC and associated morbidity/mortality.
Supporting information
Figure S1 Correlation between total bile acids and protein concentration, osmolality, and visual color grade of duodenal aspirates in patients with liver cirrhosis. Total acid levels (black bars) and (A) protein concentration (gray boxes), (B) osmolality (gray boxes), and (C) visual color grade (gray boxes): 0 (clear), 1 (light yellow), 2 (moderate yellow), or 3 (dark yellow), for each study participant.
Table S1. Analytical ranges and intra‐run precision for 15 major bile acids in human duodenal aspirate samples from participants with liver cirrhosis
Supporting info item
Acknowledgments
This work was supported by a grant from the National Cancer Institute (R01CA204145).
Jacobs, J. P. , Dong, T. S. , Agopian, V. , Lagishetty, V. , Sundaram, V. , Noureddin, M. , Ayoub, W. S. , Durazo, F. , Benhammou, J. , Enayati, P. , Elashoff, D. , Goodman, M. T. , Pisegna, J. , and Hussain, S. (2018) Microbiome and bile acid profiles in duodenal aspirates from patients with liver cirrhosis: The Microbiome, Microbial Markers and Liver Disease Study. Hepatol Res, 48: 1108–1117. 10.1111/hepr.13207.
Conflict of interest: The authors have no conflict of interest.
Financial support: This work was supported by a grant from the National Cancer Institute (R01CA204145).
References
- 1. Murray CJ, Atkinson C, Bhalla K et al The state of US health, 1990–2010: burden of diseases, injuries, and risk factors. JAMA 2013; 310: 591–608. [DOI] [PMC free article] [PubMed] [Google Scholar]
- 2. Jemal A, Bray F, Ferlay J. Global cancer statistics. CA Cancer J Clin 2011; 61: 69–90. [DOI] [PubMed] [Google Scholar]
- 3. El‐serag HB, Lau M, Eschbach K, Davila JA, Goodwin J. Epidemiology of hepatocellular carcinoma in Hispanics in the United States. Arch Intern Med 2007; 167: 1983–1989. [DOI] [PubMed] [Google Scholar]
- 4. Howlader N, Noone A, Krapcho M et al, eds. SEER Cancer Statistics Review, 1975–2014. Bethesda: National Cancer Institute. Available at: https://seer.cancer.gov/csr/1975_2014/, based on November 2016 SEER data submission, posted to the SEER web site, April 2017. Accessed February 13, 2018.
- 5. Yu L‐X, Schwabe RF. The gut microbiome and liver cancer: mechanisms and clinical translation. Nat Rev Gastroenterol Hepatol 2017; 14: 527–539. [DOI] [PMC free article] [PubMed] [Google Scholar]
- 6. Xie G, Wang X, Huang F et al Dysregulated hepatic bile acids collaboratively promote liver carcinogenesis. Int J Cancer 2016; 139: 1764–1775. [DOI] [PMC free article] [PubMed] [Google Scholar]
- 7. Roberts MS, Magnusson BM, Burczynski FJ, Weiss M. Enterohepatic circulation: physiological, pharmacokinetic and clinical implications. Clin Pharmacokinet 2002; 41: 751–790. [DOI] [PubMed] [Google Scholar]
- 8. Sun L, Beggs K, Borude P et al Bile acids promote diethylnitrosamine‐induced hepatocellular carcinoma via increased inflammatory signaling. Am J Physiol Gastrointest Liver Physiol 2016; 91–104. [DOI] [PMC free article] [PubMed] [Google Scholar]
- 9. Wang X, Fu X, Van Ness C, Meng Z, Ma X, Huang W. Bile acid receptors and liver cancer. Curr Pathobiol Rep 2013; 1: 29–35. [DOI] [PMC free article] [PubMed] [Google Scholar]
- 10. US Department of Health and Human Services and US Department of Agriculture. 2015–2020 Dietary Guidelines for Americans , 8th edn. December 2015. Available at: https://health.gov/dietaryguidelines/2015/guidelines/. Accessed February 13, 2018.
- 11. Bradford MM. A rapid and sensitive method for the quantitation of microgram quantities of protein utilizing the principle of protein‐dye binding. Anal Biochem 1976; 72: 248–254. [DOI] [PubMed] [Google Scholar]
- 12. Tong M, Jacobs JP, Mchardy IH, Braun J, Angeles L. Sampling of intestinal microbiota and targeted amplification of bacterial 16S rRNA genes for microbial ecologic analysis. Curr Protoc Immunol 2014; 107: 7.41.1–7.41.11. [DOI] [PMC free article] [PubMed] [Google Scholar]
- 13. Caporaso JG, Kuczynski J, Stombaugh J et al QIIME allows analysis of high‐throughput community sequencing data. Nat Methods 2011; 7: 335–336. [DOI] [PMC free article] [PubMed] [Google Scholar]
- 14. Jacobs JP, Goudarzi M, Singh N et al A disease‐associated microbial and metabolomics state in relatives of pediatric inflammatory bowel disease patients. Cell Mol Gastroenterol Hepatol 2016; 2: 750–766. [DOI] [PMC free article] [PubMed] [Google Scholar]
- 15. Lozupone CA, Knight R. Species divergence and the measurement of microbial diversity. FEMS Microbiol Rev 2008; 32: 557–578. [DOI] [PMC free article] [PubMed] [Google Scholar]
- 16. Goodrich JK, Di Rienzi SC, Poole AC et al Conducting a microbiome study. Cell 2014; 158: 250–262. [DOI] [PMC free article] [PubMed] [Google Scholar]
- 17. Anderson MJ. A new method for non parametric multivariate analysis of variance. Austral Ecol 2001; 26(2001): 32–46. [Google Scholar]
- 18. Martin P, DiMartini A, Feng S, Brown R, Fallon M. Evaluation for liver transplantation in adults: 2013 practice guideline by the American Association for the Study of Liver Diseases and the American Society of Transplantation. Hepatology 2014; 59: 1144–1165. [DOI] [PubMed] [Google Scholar]
- 19. Love MI, Huber W, Anders S. Moderated estimation of fold change and dispersion for RNA‐seq data with DESeq2. Genome Biol 2014; 15: 550. [DOI] [PMC free article] [PubMed] [Google Scholar]
- 20. McMurdie PJ, Holmes S. Waste not, want not: why rarefying microbiome data is inadmissible. PLoS Comput Biol 2014; 10: e1003531. [DOI] [PMC free article] [PubMed] [Google Scholar]
- 21. Storey JD, Tibshirani R. Statistical significance for genomewide studies. Proc Natl Acad Sci USA 2003; 100: 9440–9445. [DOI] [PMC free article] [PubMed] [Google Scholar]
- 22. Kerckhoffs PM, Ben‐amor K, Samsom M et al Molecular analysis of faecal and duodenal samples reveals significantly higher prevalence and numbers of Pseudomonas aeruginosa in irritable bowel syndrome. J Med Microbiol 2011; 60: 236–245. [DOI] [PubMed] [Google Scholar]
- 23. Kerckhoffs APM, Samsom M, Van Der Rest ME et al Lower Bifidobacteria counts in both duodenal mucosa‐associated and fecal microbiota in irritable bowel syndrome patients. World J Gastroenterol 2009; 15: 2887–2892. [DOI] [PMC free article] [PubMed] [Google Scholar]
- 24. Giamarellos‐Bourboulis E, Tang J, Pyleris E et al Molecular assessment of differences in the duodenal microbiome in subjects with irritable bowel syndrome. Scand J Gastroenterol 2015; 50: 1076–1087. [DOI] [PubMed] [Google Scholar]
- 25. Chen Y, Ji F, Guo J, Shi D, Fang D, Li L. Dysbiosis of small intestinal microbiota in liver cirrhosis and its association with etiology. Sci Rep 2016; 6: 34055. [DOI] [PMC free article] [PubMed] [Google Scholar]
- 26. Bajaj JS, Kakiyama G, Zhao D et al Continued alcohol misuse in human cirrhosis is associated with an impaired gut–liver axis. Alcohol Clin Exp Res 2017; 41: 1857–1865. [DOI] [PubMed] [Google Scholar]
- 27. Aly AM, Adel A, El‐Gendy AO, Essam TM, Aziz RK. Gut microbiome alterations in patients with stage 4 hepatitis C. Gut Pathog 2016; 8: 42. [DOI] [PMC free article] [PubMed] [Google Scholar]
- 28. Yan AW, Fouts DE, Brandl J et al Enteric dysbiosis associated with a mouse model of alcoholic liver disease. Hepatology 2011; 53: 96–105. [DOI] [PMC free article] [PubMed] [Google Scholar]
- 29. Cash HL, Whitham CV, Behrendt CL, Hooper LV. Symbiotic bacteria direct expression of an intestinal bactericidal lectin. Science 2006; 313: 1126–1131. [DOI] [PMC free article] [PubMed] [Google Scholar]
- 30. Li J, Sung CYJ, Lee N et al Probiotics modulated gut microbiota suppresses hepatocellular carcinoma growth in mice. Proc Natl Acad Sci USA 2016; 113: E1306–E1315. [DOI] [PMC free article] [PubMed] [Google Scholar]
- 31. Zhang Y, Feng Y, Cao B, Tian Q. The effect of small intestinal bacterial overgrowth on minimal hepatic encephalopathy in patients with cirrhosis. Arch Med Sci 2016; 12: 592–596. [DOI] [PMC free article] [PubMed] [Google Scholar]
- 32. Gupta A, Dhiman RK, Kumari S et al Role of small intestinal bacterial overgrowth and delayed gastrointestinal transit time in cirrhotic patients with minimal hepatic encephalopathy. J Hepatol 2010; 53: 849–855. [DOI] [PubMed] [Google Scholar]
- 33. Pande C, Kumar A, Sarin SK. Small‐intestinal bacterial overgrowth in cirrhosis is related to the severity of liver disease. Aliment Pharmacol Ther 2009; 29: 1273–1281. [DOI] [PubMed] [Google Scholar]
- 34. Bhat M, Arendt BM, Bhat V, Renner EL, Humar A, Allard JP. Implication of the intestinal microbiome in complications of cirrhosis. World J Hepatol 2016; 8: 1128–1136. [DOI] [PMC free article] [PubMed] [Google Scholar]
- 35. Bajaj JS. The role of microbiota in hepatic encephalopathy. Gut Microbes 2014; 5: 397–403. [DOI] [PMC free article] [PubMed] [Google Scholar]
- 36. Vanhoutte T, De Preter V, De Brandt E, Verbeke K, Swings J, Huys G. Molecular monitoring of the fecal microbiota of healthy human subjects during administration of lactulose and Saccharomyces boulardii . Appl Environ Microbiol 2006; 72: 5990–5997. [DOI] [PMC free article] [PubMed] [Google Scholar]
- 37. Jiang ZD, Ke S, DuPont HL. Rifaximin‐induced alteration of virulence of diarrhoea‐producing Escherichia coli and Shigella sonnei . Int J Antimicrob Agents 2010; 35: 278–281. [DOI] [PubMed] [Google Scholar]
- 38. Liu H, Xu H‐W, Zhang Y‐Z et al Ursodeoxycholic acid induces apoptosis in hepatocellular carcinoma xenografts in mice. World J Gastroenterol 2015; 21: 10367–10374. [DOI] [PMC free article] [PubMed] [Google Scholar]
- 39. Zhu L, Shan LJ, Liu YJ, Chen D, Xiao XG, Li Y. Ursodeoxycholic acid induces apoptosis of hepatocellular carcinoma cells in vitro. J Dig Dis 2014; 15: 684–693. [DOI] [PubMed] [Google Scholar]
- 40. Chung GE, Yoon J‐H, Lee J‐H et al Ursodeoxycholic acid‐induced inhibition of DLC1 protein degradation leads to suppression of hepatocellular carcinoma cell growth. Oncol Rep 2011; 25: 1739–1746. [DOI] [PubMed] [Google Scholar]
- 41. Conlon MA, Bird AR. The impact of diet and lifestyle on gut microbiota and human health. Nutrients 2015; 7: 17–44. [DOI] [PMC free article] [PubMed] [Google Scholar]
- 42. Agus A, Denizot J, Thévenot J et al Western diet induces a shift in microbiota composition enhancing susceptibility to adherent‐invasive E. coli infection and intestinal inflammation. Sci Rep 2016; 6: 19032. [DOI] [PMC free article] [PubMed] [Google Scholar]
- 43. Watt E, Gemmell MR, Berry S, et al Extending colonic mucosal microbiome analysis‐assessment of colonic lavage as a proxy for endoscopic colonic biopsies. Microbiome 2016; 4: 61. [DOI] [PMC free article] [PubMed] [Google Scholar]
Associated Data
This section collects any data citations, data availability statements, or supplementary materials included in this article.
Supplementary Materials
Figure S1 Correlation between total bile acids and protein concentration, osmolality, and visual color grade of duodenal aspirates in patients with liver cirrhosis. Total acid levels (black bars) and (A) protein concentration (gray boxes), (B) osmolality (gray boxes), and (C) visual color grade (gray boxes): 0 (clear), 1 (light yellow), 2 (moderate yellow), or 3 (dark yellow), for each study participant.
Table S1. Analytical ranges and intra‐run precision for 15 major bile acids in human duodenal aspirate samples from participants with liver cirrhosis
Supporting info item