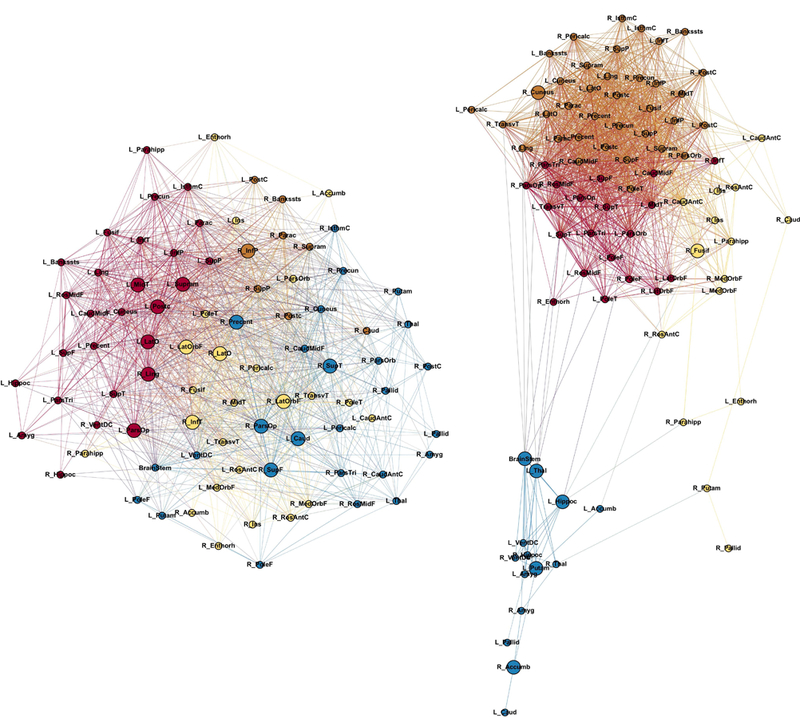
Figure 2:

Modularity in controls (left) and JME (right). Node abbreviations are the same as in Table 1S. Same color nodes belong to the same module. Bigger nodes represent the hubs of the network as calculated using BC. The spatial distribution of nodes was calculated using the force-atlas graph algorithm, where nodes that demonstrated stronger connections are located closer in space, while nodes with fewer connections tend to be farther in space. Calculated at a hybrid threshold of 35%.
