Abstract
Adiponectin (ApN) is a multifunctional adipokine. However, high, rather than low, concentrations of ApN are unexpectedly found in patients with chronic kidney disease (CKD) via an as yet unknown mechanism, and the role of ApN in CKD is unclear. Herein, we investigated the effect of ApN overexpression on progressive renal injury resulting from deoxycorticosterone acetate-salt (DOCA) and angiotensin II (ANG II) infusion using a transgenic, inducible ApN-overexpressing mouse model. Three groups of mice [wild type receiving no infusion (WT) and WT and cytochrome P450 1a1 (cyp1a1)-ApN transgenic mice (ApN-Tg) receiving DOCA+ANG II infusion (WT/DOCA+ANG II and ApN-Tg/DOCA+ANG II)] were assigned to receive normal food containing 0.15% of the transgene inducer indole-3-carbinol (I3C) for 3 wk. In the I3C-induced ApN-Tg/DOCA+ANG II mice, not the WT or WT/DOCA+ANG II mice, overexpression of ApN in liver resulted in 3.15-fold increases in circulating ApN compared with nontransgenic controls. Of note, the transgenic mice receiving DOCA+ANG II infusion were still hypertensive but had much less albuminuria and glomerular and tubulointerstitial fibrosis, which were associated with ameliorated podocyte injury determined by ameliorated podocyte loss and foot process effacement, and alleviated tubular injury determined by ameliorated mRNA overexpression of kidney injury molecule-1 and neutrophil gelatinase-associated lipocalin and mRNA decreases of cubilin and megalin in tubular cells, compared with WT/DOCA+ANG II mice. In addition, renal production of NF-κB-p65, NAPDH oxidase 2, and p47phox and MAPK-related cellular proliferation, which were induced in WT/DOCA+ANG II mice, were markedly reduced in ApN-Tg/DOCA+ANG II mice. These results indicate that elevated ApN in the CKD mouse model is renal protective. Enhancing ApN production or signaling may have therapeutic potential for CKD.
Keywords: adiponectin, albuminuria, angiotensin II, renal fibrosis
INTRODUCTION
Chronic kidney disease (CKD) is associated with a major public burden and its prevalence is rising throughout the world (47). New therapies to slow or even stop CKD progression are urgently needed.
Adiponectin (ApN) is a multifunctional adipokine with insulin-sensitizing, anti-inflammatory, and vasoprotective properties (25, 27, 48). Epidemiological studies have shown that ApN is downregulated in obesity and diabetes (6). Importantly, it has been observed that plasma ApN concentration is inversely related to urinary albumin excretion (38, 44, 50). Moreover, a growing body of evidence from animal models indicates that ApN crossing the glomerular filtration barrier possibly inhibits inflammation and oxidative stress in kidneys through activation of AMP-activated protein kinase and protects against the development of albuminuria (30). In contrast, ApN knockout mice display exacerbation of albuminuria, glomerular hypertrophy, markers of oxidative stress, podocyte foot effacement, and tubulointerstitial fibrosis in diabetes or a subtotal renal ablation model of progressive CKD, which are reversed by ApN treatment (33, 38). Our recent data have further shown that treatment with recombinant ApN peptide reduced the increases in albuminuria and markers of glomerulosclerosis seen in db/db mice, a type 2 diabetic mouse model (16). This independent antifibrotic effect of ApN is beyond its glucose-lowering and insulin-sensitizing actions and is probably through its anti-inflammatory and angiotensin-antagonistic effects since human ApN obliterates the stimulatory effects of ANG II and transforming growth factor-β (TGF-β) on the expression of profibrotic markers in cultured glomerular mesangial cells (16). Together, these exciting results make ApN, a natural human protein, a novel and promising candidate to treat a number of fibrotic diseases including diabetic nephropathy. However, high, rather than low, concentrations of ApN are unexpectedly found in patients with CKD via an as yet unknown mechanism (24, 26, 28). Whether the increases in serum ApN levels under these circumstances actually reflect attempts to limit renal inflammation, and are therefore the consequence instead of the cause of kidney disease, remains unclear.
To further understand the role of ApN in kidney disease, especially in CKD, in vivo, we therefore proposed to use a transgenic, inducible, ApN-overexpressing mouse model to investigate whether ApN transgenic mice with high levels of circulating ApN showed decreased or increased susceptibility to chronic fibrotic renal disease induced by DOCA+ANG II infusion and elucidate the potential signaling pathways that might be involved.
MATERIALS AND METHODS
Reagents
Unless otherwise indicated, all materials and chemicals were obtained from Sigma-Aldrich (St. Louis, MO).
Animals
Animal housing and care were in accordance with the National Institutes of Health Guide for the Care and Use of Laboratory Animals. The breeding, maintenance, and study of animals described herein were approved by the Animal Care Committee of the University of Utah.
Generation of cyp1a1 Human Full-Length ApN Transgenic Mice
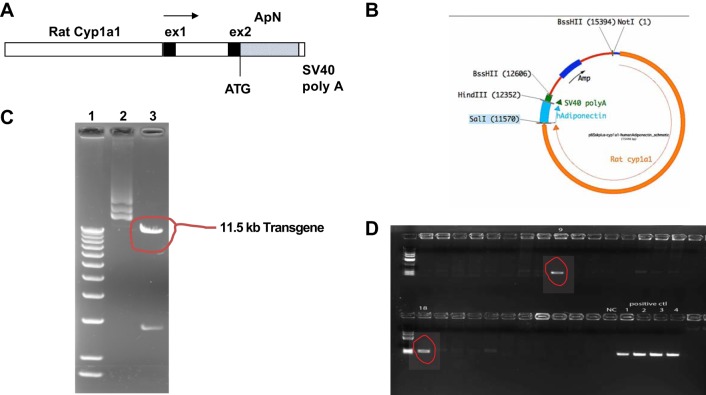
We first generated inbred transgenic mice with conditional expression of human full-length ApN primarily in the liver using the cytochrome P450 promoter, cyp1a1, to drive and direct expression of the ApN gene to the liver. The transgene is induced by xenobiotics such as indole-3-carbinol (I3C; 22), which act via the aryl hydrocarbon receptor, a basic helix-loop-helix transcription factor in the cyp1a1 promoter (3, 41). I3C is a naturally occurring agent found in cruciferous vegetables that acts as a benign inducer with a short biological half-life. Briefly, the rat cyp1a1 promoter was isolated by NotI-SalI double digestion of pAhIR1-lacZ (kindly provided by Dr. John J. Mullins, University of Edinburgh) to yield an 11.5-kb fragment containing 5′-flanking regions, exon 1, and part of exon 2 and cloned upstream of human full-length ApN cDNA and a simian virus 40 (SV40) poly(A) signal in pBluescript SK2(+) (described in Fig. 1, A and B). The injection fragment was excised by NotI-BssHII digestion (Fig. 1C), purified, and introduced into C57BL/6 mouse signal cell embryos by microinjection, which was performed at the University of Utah, Transgenic Animal Model Core. Founders were identified by PCR with human ApN-specific probes covering the cyp1a1 promoter and human ApN gene (sense, 5′-TCTTGCCTCACTTCTCAGCA-3′; antisense, 5′-ACCTGGATCTCCTTTCTCACC-3′; the size of PCR production is 261 bp; Fig. 1D), and the PCR production was further verified by DNA sequencing (data not shown). Founders were then bred with wild-type C57BL/6 mice (WT). Transgenic filial generation 1 (F1) mice were used to continually breed with WT mice to establish the transgenic line. The transgenic animals were fertile and developed normally. Transgenic mice after F3 were used for the designed experiments below.
Fig. 1.
A: schematic representation of the cDNA transgene. The transgene comprises the rat cytochrome P450 1a1 (cyp1a1) promoter, exon 1 (ex1), and part of exon 2 fused to the full length of human adiponectin (ApN) cDNA and simian virus 40 (SV40) poly(A) signal. B: structure of pBluescript SK2(+) (pBS)-cyp1a1-ApN plasmid. Amp, ampicillin resistance gene; hAdiponectin, human ApN. C: pure transgene plasmids were electrophoresed on 1% agarose gel and visualized by ethidium bromide staining under UV light. Lane 1, size marker, 1 kb more DNA ladder (Invitrogen); lane 2, purified plasmid pBS-cyp1a1-ApN; lane 3, pBS-cyp1a1-ApN plasmid was digested by NotI and BssHII and resulted in 11.5- and 3-kb cDNA fragments (two pieces) as indicated. The 11.5-kb DNA fragment is the cyp1a1-ApN transgene. D: two transgenic founders demonstrated by PCR. Fifty nanograms of the mouse tail DNA were used for PCR amplification in 25-µl reaction volume using the transgene primers. Ten microliters of PCR products were then analyzed by 1.0% agarose gel electrophoresis. In addition, the same amount of cDNA from negative control mouse and the transgene plasmid was used for PCR amplification, serving as negative (NC) or positive controls (ctl). Nos. 9 and 18 are positive founders.
Optimal Induction of Transgene Expression by I3C
The induction of cyp1a1 promoter-driven transgene by I3C (0.3% wt/wt) in cyp1a1 ren-2 transgenic rats has been shown to be effective (13). First, two doses of I3C (0.15 and 0.3% wt/wt, respectively) were mixed with the standard animal food by Harlan Laboratories (Madison, WI) and given to transgenic mice (n = 3 per group) for 2 wk. Age- and sex-matched nontransgenic control littermates (n = 3) were fed the standard diet only with 0.3% I3C for 2 wk. Animals were anesthetized, 1 ml blood was drawn from the cardiac puncture, and all organs were perfused with 30 ml ice-cold phosphate-buffered saline (PBS). Most organs including heart, lung, liver, abdominal fat, spleen, and kidney were harvested and stored at −80°C until analysis of ApN protein production with serum samples by Western blot assay.
Experiment Design
Three groups of mice were first subjected to uninephrectomy under isoflurane anesthesia at 8 wk of age. One week later, mice in groups 2 and 3 received subcutaneous implantation of a 25 mg DOCA pellet (Innovative Research), ANG II (1 ng·min−1·g body wt−1) infusion via subcutaneous implantation of an osmotic minipump (Alzet 1002; Durect, Cupertino, CA), and 1% NaCl in drinking water for 3 wk. The protocol of induction of CKD in mice in the present study was modified from a previously reported study (23). At the same time, all mice were given the standard diet with 0.15% I3C (determined in a dose experiment of I3C). Systolic blood pressure was measured before DOCA+ANG II infusion and before euthanasia in conscious and trained mice at room temperature by the tail cuff method (MC4000 multichannel blood pressure analysis system; Hatteras Instruments, Cary, NC). Body weight, 24-h water intake, and 24-h urine samples for the measurement of albumin were collected from each mouse in individual metabolic cages every week starting before treatment. Urine albumin was measured using the DC 2000+ microalbumin/creatinine reagent kit (Bayer HealthCare, Elkhart, IN).
Mice were euthanized under isoflurane anesthesia. Blood samples were obtained by cardiac puncture for the measurement of ApN plasma levels and blood urea nitrogen and creatinine levels. The kidneys were perfused through the heart with 30 ml of cold PBS, and then two pieces of cortex were either snap-frozen in 2-methylbutane at −80°C or fixed in 10% neutralized formalin for immunohistological examination. Excised pieces of cortex were stored in liquid nitrogen for Western blot analysis or treated with TRIzol reagent (Gibco BRL, Gaithersburg, MD) for RNA isolation.
Histological Analysis
Formalin-fixed renal cortex tissues were subsequently embedded in paraffin. Three-micrometer sections were cut from the tissue blocks and stained with periodic acid-Schiff (PAS) and Masson’s trichrome. The PAS-positive glomerular extracellular matrix was quantified in a blinded fashion by a computer-assisted method as previously described (19). Masson’s trichrome-stained tissue sections were viewed with bright-field illumination at ×200 magnification. Five nonoverlapping fields of renal interstitial area were scored with a semiquantitative ordinal scale (grade 0 for an interstitial fibrosis/tubular atrophy percentage of ≤5%, grade 1 for >5 to ≤25%, grade 2 for >25 to ≤50%, and grade 3 for >50%), and the mean was used as the fibrosis score.
Immunofluorescent staining quantified for fibronectin (FN), nephrin, podocin, and Wilms tumor protein-1 was performed on frozen renal sections as described previously (16, 19, 53). For the determination of macrophage infiltration into the kidney, polyclonal rat anti-mouse F4/80 IgG (Bio-Rad Laboratories, Hercules, CA) and cyanine 3-conjugated goat anti-rat IgG (Jackson ImmunoResearch Laboratories, West Grove, PA) were used. The F4/80-positive cells in renal tissue were quantified in five randomly selected areas per section under ×200 magnification by calculating the percentage of the total area of the section using ImageJ software. To determine whether the elevated circulating ApN binds to the kidney, immunofluorescent staining for ApN was also performed on sections of frozen renal tissue. The polyclonal rabbit anti-ApN was generated against the human full-length ApN protein, which was produced in our laboratory as described previously (16). The resulting antibody was purified using protein A agarose and verified by Western blot assay and histological staining. Frozen sections of renal cortex tissue were stained with this polyclonal ApN antibody followed by tetramethylrhodamine isothiocyanate (TRITC)-conjugated goat anti-rabbit IgG as secondary antibody (Jackson ImmunoResearch Laboratories). Normal rabbit serum instead of anti-ApN antibody was applied, serving as a negative control.
Western Blot Analysis
Equal amounts of renal cortex tissue (15 mg) from each mouse of each group were homogenized in lysis buffer (Cell Signaling Technology, Beverly, MA) with 1% Nonidet P-40, 1 mM PMSF, and 1 tablet per 5 ml protease inhibitor mix (Complete, Mini; Roche Diagnostics, Indianapolis, IN). An equal amount of protein sample from each mouse of each group was pooled for further examination. For Western blot analysis, protein samples (30 µg each) were subjected to SDS-PAGE in 4–12% gradient gel (Invitrogen) and immunoblotting on Immobilon-P transfer membranes (Millipore, Bedford, MA). Proteins of FN, α-smooth muscle action (α-SMA), phospho (p)-NF-κB-p65, and NAPDH oxidase 2 (Nox2) and its cofactor, p47phox, phospho(p)-ERK1/2, and total(t)-ERK1/2 were assessed on the Western blots using rabbit anti-human FN IgG, mouse monoclonal anti-α-SMA IgG2a, mouse monoclonal anti-p-NF-κB-p65 IgG2b (Cell Signaling Technology), mouse anti-gp91phox (Nox2) IgG, mouse monoclonal anti-pERK1/2 IgG and rabbit anti-total ERK1/2 IgG (Santa Cruz Biotechnology, Dallas, TX), and mouse anti-p47phox IgG (BD Biosciences, San Jose, CA). The immunostaining band was visualized and quantified as described previously (14, 51, 53). Briefly, bound antibodies were detected by developing the blot in enhanced chemiluminescence Western blotting detection reagents (Amersham Pharmacia Biotech, Little Chalfont, United Kingdom). Quantitation of the bands on autoradiograms was performed using a Bio-Rad GS-700 imaging densitometer. Each protein level was corrected for the densitometric intensity of β-actin (using mouse monoclonal anti-β-actin IgG). For comparison, this ratio was set at unity for normal control samples, and other lanes on the same gel were expressed as fold change over this value. All blots were run at least three times.
RNA Preparation and Real-Time RT-PCR
Total RNA was extracted from renal cortical tissues using TRIzol reagent according to the manufacturer’s instructions. Two micrograms of total RNA were reverse transcribed using the SuperScript III First-Strand Synthesis System (Invitrogen, Carlsbad, CA). Real-time reverse transcription-polymerase chain reaction (RT-PCR) was performed using SYBR Green Dye I (Applied Biosystems, Foster City, CA) with the ABI 7900 Sequence Detection System (Applied Biosystems) as described previously (19). Samples were run as triplicates in separate tubes to permit quantification of the target gene normalized to β-actin. Sequences of primers used for the fibrotic markers and tubular injury markers ware listed in Table 1. The specificity of the PCR products was confirmed using a 1.5% agarose gel by showing a specific single band with the expected size.
Table 1.
Primers used for real-time RT-PCR
| Gene | Primer | Sequence 5′–3′ |
|---|---|---|
| Mouse TGF-β1 | Forward | TGAGTGGCTGTCTTTTGACG |
| Reverse | TCTCTGTGGAGCTGAAGCAA | |
| Mouse FN | Forward | CCGTGGGATGTTTGAGAC |
| Reverse | GGCAAAAGAAAGCAGAGG | |
| Mouse Col Ia | Forward | CACCCTCAAGAGCCTGAGTC |
| Reverse | GCTTCTTTTCCTTGGGGTTC | |
| Mouse Col IVa | Forward | ATGCCCTTTCTCTTCTGCAA |
| Reverse | GAAGGAATAGCCGATCCACA | |
| Mouse cubilin | Forward | TGGGATCTCCTGGAAATGAG |
| Reverse | ACCGCTTGGGTAGACATTTG | |
| Mouse megalin | Forward | CAGGGACTCCTCTGACGAAG |
| Reverse | TTGGAGCAAGTGAACTGGTG | |
| Mouse KIM-1 | Forward | ACATATCGTGGAATCACAACGAC |
| Reverse | ACTGCTCTTCTGATAGGTGACA | |
| Mouse NGAL | Forward | ATGTCACCTCCATCCTGGTC |
| Reverse | ACAGCTCCTTGGTTCTTCCA | |
| Mouse β-actin | Forward | GCTCTTTTCCAGCCTTCCTT |
| Reverse | TGATCCACATCTGCTGGAAG |
Col, collagen; FN, fibronectin; KIM-1, kidney injury molecule-1; NGAL, neutrophil gelatinase-associated lipocalin; TGF-β1, transforming growth factor-β1.
Statistical Analysis
All data are expressed as means (SD). Statistical analyses of differences among the groups were performed by one-way ANOVA and subsequent Student-Newman-Keuls or Dunnett’s testing for multiple comparisons. Comparisons with P values <0.05 were considered significantly different.
RESULTS
Continuous Induction of ApN
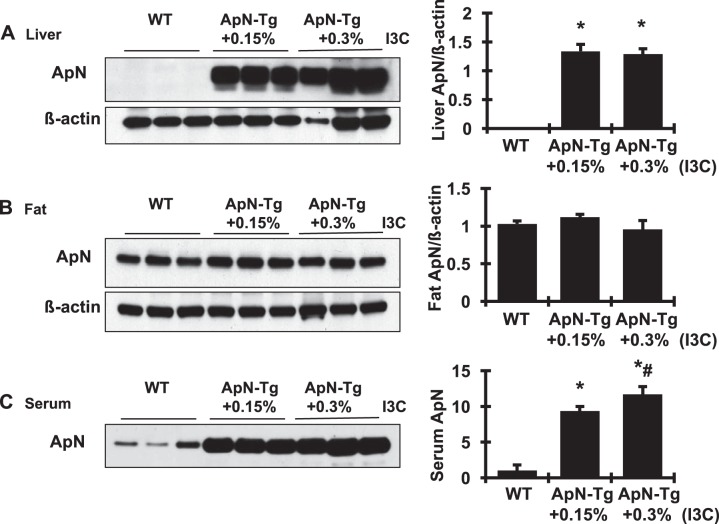
Transgenic and nontransgenic mice were induced with dietary I3C for 2 wk. The induction of ApN mRNA expression by I3C was observed in the liver tissue, not in the fat tissue or other organs, of the transgenic animals, not in the nontransgenic animals (data not shown). The induction of transgene expression by I3C at both dosages was associated with an excess of ApN protein production in liver and serum, not in fat tissue, detected by Western blot assay (Fig. 2). These increases in serum ApN were I3C dose dependent and were not observed in WT mice that received the I3C diet. These results indicate that the engineered expression of ApN from the liver of transgenic mice after I3C induction, even at a dose of 0.15%, results in exclusive release of ApN into circulation. On the basis of these results, 0.15% I3C was used in the following experiment to induce ApN gene expression and protein production.
Fig. 2.
Continuous induction of adiponectin (ApN) production in cytochrome P450 1a1 (cyp1a1)-ApN transgenic mice determined by Western blot assay. The induction of transgene expression by indole-3-carbinol (I3C) at both dosages was associated with an excess of ApN protein production in liver (A) and serum (C), but not in fat tissue (B). β-Actin served as the protein loading control in both liver and fat tissues. Graphic representation of the mean band intensity of ApN in each tissue is shown at right. WT, wild-type normal control littermates; ApN-Tg+0.15% or 0.30% I3C, cyp1a1-ApN transgenic mice were given the standard diet with 0.15% I3C or 0.3% I3C for 2 wk. *P < 0.05 vs. WT mice; #P < 0.05 vs. ApN-Tg+0.15% I3C mice.
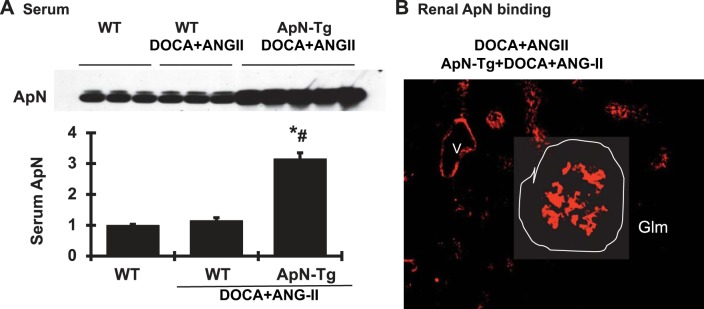
Indeed, 0.15% I3C induced 3.15-fold increases in circulating ApN levels in DOCA+ANG II-infused cyp1a1 ApN transgenic mice compared with WT mice. DOCA+ANG II infusion or I3C diet for nontransgenic mice for 3 wk had no effect on serum ApN levels (Fig. 3). Of note, the ApN was observed in the glomeruli, tubular cells, and blood vessels only in transgenic mice fed with I3C (Fig. 3B), not in the WT mice with or without DOCA+ANG II infusion (data not shown). Together with the data that no transgene expression of ApN was found in the kidney, these results indicate that the increased circulating ApN may bind to kidney cells via its receptors since there are abundant ApN receptors found in the kidney cells (7).
Fig. 3.
Elevated adiponectin (ApN) levels observed in DOCA+ANG II-infused ApN transgenic mice (ApN-Tg). A: serum ApN protein levels determined by Western blot assay and graphic representation of the mean band intensity of ApN. *P < 0.05 vs. wild-type normal mice (WT); #P < 0.05 vs. WT mice receiving DOCA+ANG II infusion. B: representative photomicrograph of glomerular immunofluorescent staining for ApN from DOCA+ANG II-infused ApN-Tg mice. No staining for ApN was found in WT mice with or without DOCA+ANG II infusion (data not included here). Magnification ×400. Glm, glomerulus; V, vessel.
Effect of ApN Overexpression on DOCA+ANG II Infusion-Induced Renal Disease
Systemic parameters.
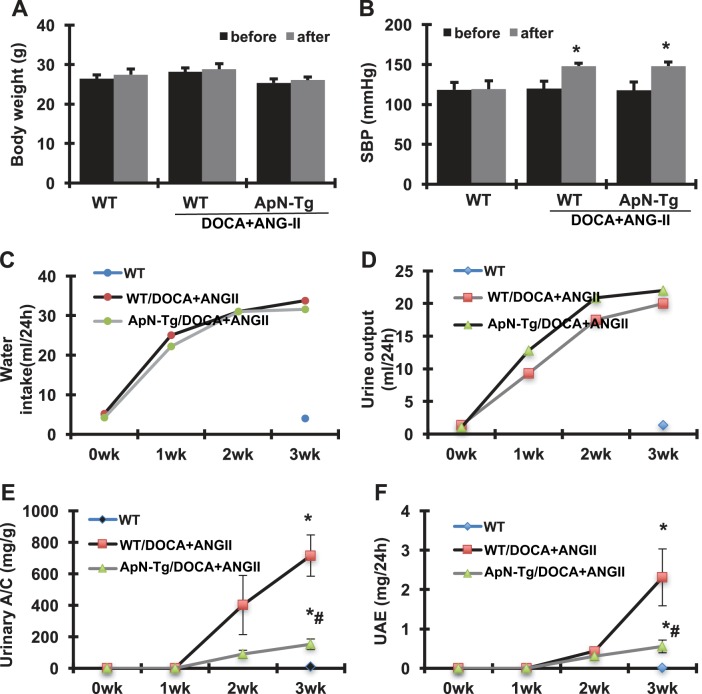
The baseline and final parameters for the three groups of mice are shown in Fig. 4. All mice survived until the time of euthanasia. Compared with the baseline levels, the WT normal control mice gained 1.08 g body wt in 3 wk, whereas the DOCA+ANG II-infused WT and ApN transgenic mice gained 0.72 and 0.78 g body wt, respectively and similarly, which was less than the WT normal control mice. There was no difference in daily food intake among these three groups (data not shown). In addition, all mice were normotensive at baseline. DOCA+ANG II infusion caused hypertension in both WT and I3C-induced ApN transgenic mice. Accordingly, daily water intake and urine output in these two groups were notably increased from the first to the third weeks after DOCA+ANG II infusion compared with WT normal controls. Apparently, ApN overexpression for 3 wk had no effect on DOCA+ANG II-induced hypertension and increased water intake and urine output in these mice. Renal function, determined as plasma blood urea nitrogen and creatinine levels, was similar among the various groups. However, the transgenic mice overexpressing ApN had much less albuminuria observed at the second and third weeks after DOCA+ANG II infusion compared with WT/DOCA+ANG II mice, determined by urinary albumin-creatinine ratio and 24-h total urinary albumin excretion levels.
Fig. 4.
Effect of adiponectin (ApN) overexpression on body weight (A), systolic blood pressure (SBP; B), water intake (C), urine output (D), urinary albumin-creatinine ratio (A/C; E), and urinary albumin excretion (UAE; F) in mice with DOCA+ANG II-induced chronic kidney disease. WT, wild-type normal mice; WT/DOCA+ANG II, wild-type mice receiving DOCA+ANG II infusion; ApN-Tg/DOCA+ANG II, ApN transgenic mice receiving DOCA+ANG II infusion. *P < 0.05 vs. WT normal mice; #P < 0.05 vs. WT mice receiving DOCA+ANG II infusion.
Effect of ApN overexpression on renal histology and fibrotic markers.
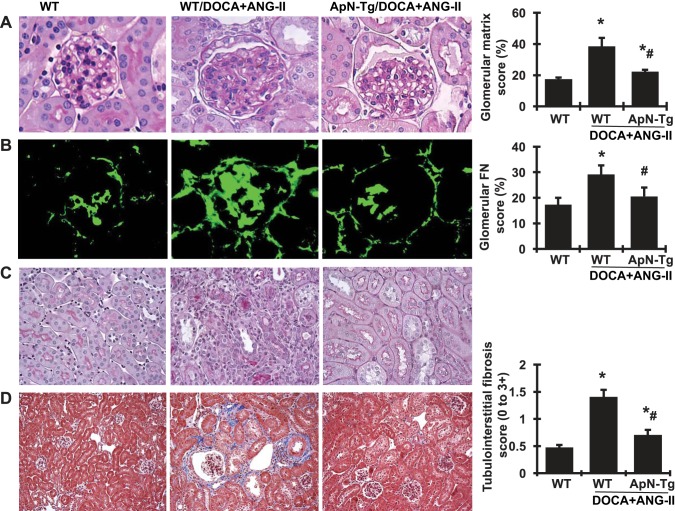
After 3-wk infusion of DOCA+ANG II, kidney weight was increased in both WT and cyp1a1 ApN transgenic mice compared with WT normal controls, indicating renal hypertrophy. However, the transgenic mice overexpressing ApN showed a reduced tendency in increased kidney weight. Representative glomeruli stained with PAS are shown in Fig. 5A. The glomeruli of DOCA+ANG II-infused WT mice demonstrated increased accumulation of extracellular matrix (ECM), appearing as PAS-positive pink material and quantified by a computer-assisted color image analyzer in the glomerular mesangium, compared with WT normal controls. We further determined the protein staining of FN in glomeruli (Fig. 5B), the major ECM component protein that contributes to glomerular sclerosis. Consistent with the accumulated ECM in glomeruli, glomerular deposition of FN detected by immunofluorescent staining was markedly increased in DOCA+ANG II-infused mice compared with normal control mice (Fig. 5, A and B). However, the I3C-induced cyp1a1 ApN transgenic mice that received DOCA+ANG II infusion showed much less glomerular ECM accumulation and FN deposition. Furthermore, DOCA+ANG II-induced kidney injury in WT mice also included tubular dilation, interstitial mononuclear cell infiltration, and increased deposition of collagen in the renal tubulointerstitial area compared with WT normal mice, as determined by PAS staining and Masson’s trichrome staining, where collagen was stained blue and quantified by a computer-assisted color image analyzer (Fig. 5, C and D). Interestingly, these DOCA+ANG II-induced phenotypes of tubular injury and tubulointerstitial fibrosis were much lighter in ApN transgenic mice with elevated ApN levels.
Fig. 5.
Effect of adiponectin (ApN) overexpression on glomerulosclerosis, tubular dilation, inflammation, and fibrosis and quantitative assessments of morphological damage in the kidneys of mice with DOCA+ANG II-induced chronic kidney disease. A and B: representative photomicrographs of glomeruli stained with periodic acid-Schiff (PAS) staining (A) and glomerular immunofluorescent staining for fibronectin (FN; B). Magnification ×400. C and D: representative photomicrographs of renal tubular dilation, inflammation, and tubulointerstitial fibrosis stained with PAS staining (C) and Masson’s trichrome (D). Magnification ×200. Graphic quantitative evaluations of glomerular matrix score and FN staining score and tubulointerstitial fibrosis are shown at right. ApN-Tg, ApN transgenic mice. *P < 0.05 vs. wild-type normal mice (WT); #P < 0.05 vs. wild-type mice receiving DOCA+ANG II infusion (WT/DOCA+ANG II).
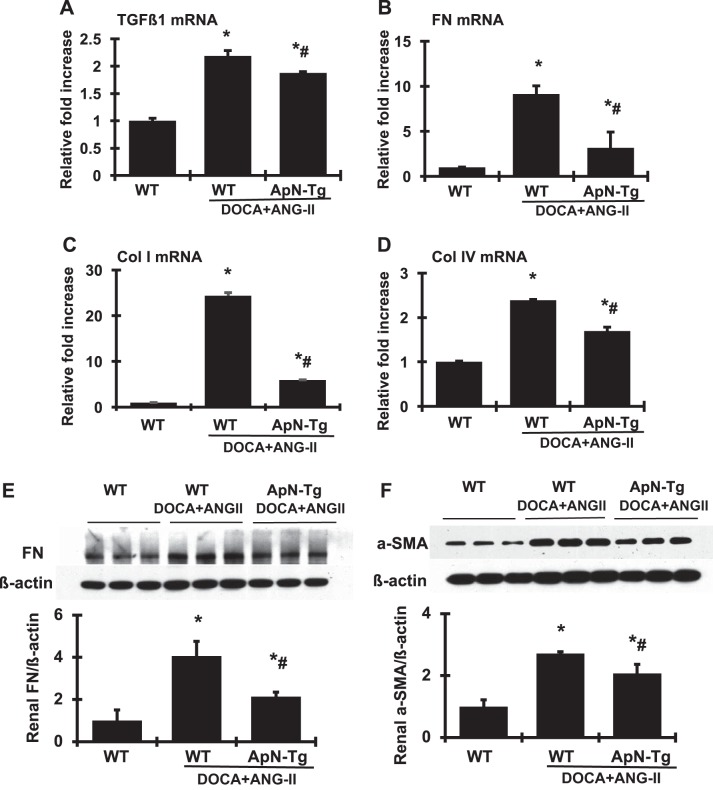
As a key modulator of matrix accumulation, TGF-β1 plays an important role in renal fibrosis. As expected (Fig. 6A), renal TGF-β1 mRNA was increased by 2.19-fold in DOCA+ANG II-infused WT mice compared with normal control littermates. Consequently, renal FN and type I and type IV collagen mRNA levels were increased in DOCA+ANG II-infused WT mice compared with normal controls (Fig. 6, B–D). In agreement with the increased mRNA expression levels, the protein levels of FN and α-SMA in renal cortex tissue further quantified by Western blot assay were markedly increased in DOCA+ANG II-infused WT mice compared with normal mice (Fig. 6, E and F). However, both the mRNA expression and the protein production levels of these fibrotic markers in renal cortex induced by DOCA+ANG II infusion seen in WT mice were decreased significantly in ApN transgenic mice.
Fig. 6.
Effect of adiponectin (ApN) overexpression on profibrotic molecules in renal cortex tissue. A–D: mRNA expression of transforming growth factor-β1 (TGF-β1; A), fibronectin (FN; B), collagen I (Col I; C), and collagen IV (Col IV; D) was determined by real-time RT-PCR. mRNA values were normalized by the levels of β-actin mRNA and then expressed relative to the mean value for the wild-type (WT) control group. E and F: representative Western blots illustrating FN (E), α-smooth muscle actin (α-SMA; F), and β-actin protein expression. Graphic representations of the mean band intensity of FN and α-SMA normalized against the band intensity of β-actin are shown below the bands. ApN-Tg, ApN transgenic mice. *P < 0.05 vs. WT normal mice; #P < 0.05 vs. WT mice receiving DOCA+ANG II infusion (WT/DOCA+ANG II).
Effect of ApN overexpression on renal podocyte injury.
From the data presented above, it is clear that ApN overexpression reduces the progression of albuminuria and the markers of renal fibrosis induced by DOCA+ANG II infusion in transgenic mice. It has been shown that podocyte injury is often responsible for proteinuria in human diseases and animal models. The protective effect of ApN overexpression on renal podocyte injury in ApN transgenic mice that received DOCA+ANG II infusion was therefore evaluated.
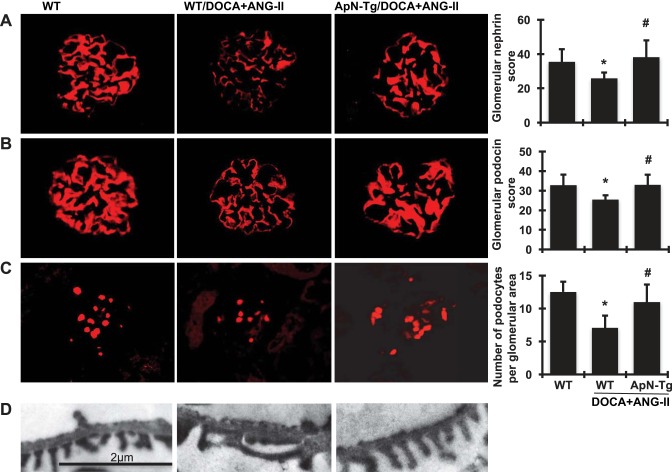
As detected by immunofluorescent staining and shown in Fig. 7, A and B, WT mice showed intense and linear staining for both nephrin and podocin in the glomeruli capillaries. In contrast, an attenuation of staining by 27.2% for nephrin and 22.6% for podocin was observed in DOCA+ANG II-infused WT mice, which was largely restored by ApN overexpression.
Fig. 7.
Effect of adiponectin (ApN) overexpression on glomerular podocyte markers. A–C: representative photomicrographs of glomerular immunofluorescent staining for nephrin (A), podocin (B), and Wilms tumor protein-1 (C) from wild-type normal mice (WT), wild-type mice receiving DOCA+ANG II infusion (WT/DOCA+ANG II), and ApN transgenic mice receiving DOCA+ANG II infusion (ApN-Tg/DOCA+ANG II). Magnification ×400. Graphic representations of glomerular nephrin and podocin staining scores and glomerular number of Wilms tumor protein-1-positive podocytes are shown at right. D: representative photomicrographs (at original magnification ×5,000) of glomerular podocyte foot process assessed by transmission electron microscope. *P < 0.05 vs. WT mice; #P < 0.05 vs. WT/DOCA+ANG II mice.
Wilms tumor protein-1 is a nuclear protein specific to podocytes and parietal glomerular epithelial cells in the adult kidney (15, 37). Wilms tumor protein-1-positive cells within the glomerular area, excluding the parietal epithelium, were counted, and the cell number per glomerulus was calculated as described in materials and methods. Consistent with the staining of podocin and nephrin, glomeruli from DOCA+ANG II-infused WT mice contained fewer podocytes than did glomeruli from WT normal control mice, as illustrated by immunofluorescence staining in Fig. 7C. However, transgenic mice with elevated ApN levels had increased podocyte numbers compared with WT mice after DOCA+ANG II infusion.
Of note, transmission electronic microscopy further revealed that the intact arrangement of podocyte foot processes and normal filtration slits observed in the podocytes of WT normal mice was nearly absent in the podocytes of DOCA+ANG II-infused WT mice. However, DOCA+ANG II-infused ApN transgenic mice had no aberrant morphological changes in the podocytes and showed podocytes indistinguishable from those of WT normal mice (Fig. 7D).
Collectively, these data suggest that elevated ApN ameliorated DOCA+ANG II-induced progressive podocyte dysfunction in the kidney by preventing podocyte loss and preserving expression of slit-diaphragm proteins, which may result in a significant decrease in proteinuria and remission of renal fibrosis.
Effect of ApN overexpression on renal tubular injury.
Importantly, long-term renal outcome is affected by the severity of tubulointerstitial involvement in most renal disease (36). Although proteinuria generally reflects glomerular damage, by reabsorbing increased amounts of protein from the tubular lumen, proinflammatory and profibrotic responses and cell apoptosis can be induced in tubular cells. This leads to inflammation and fibrosis in the tubulointerstitial area as we observed in the DOCA+ANG II-induced WT mice above (Fig. 5). Thus, to further identify the protective effect of elevated ApN in renal disease, it is important to assess the improvement of tubulointerstitial injury.
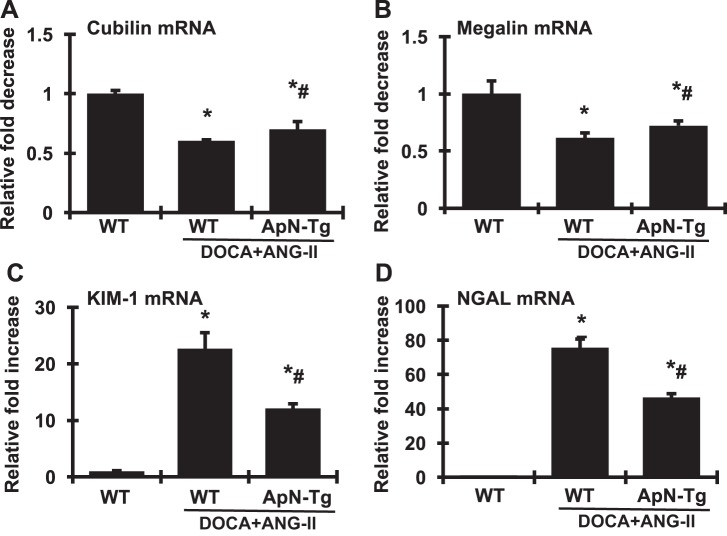
It has been shown that filtered albumin uptake is mediated by two receptors, megalin and cubilin, in proximal tubular epithelial cells (31). Megalin acts as a major endocytic receptor that is involved in proximal tubular uptake of glomerular filtered proteins for intracellular processing and degradation. Cubilin is coexpressed with megalin in the apical endocytic compartments of the proximal tubule and has been recently demonstrated to be the major albumin-binding receptor and to interact with megalin, forming a multireceptor complex with megalin driving internalization of cubilin-albumin complexes. However, the role of megalin and cubilin in protein overload-induced tubulopathy and fibrosis is not clear. As shown in Fig. 8, A and B, DOCA+ANG II infusion induced albuminuria accompanied by reduced renal mRNA expression of cubilin and megalin compared with normal controls, at least, suggesting dysfunctional tubular albumin uptake, which may further contribute to the increased albuminuria seen in these mice. Notably, increasing ApN concentration locally in transgenic mice partially reversed the DOCA+ANG II infusion-induced reduction in renal cubilin and megalin expression. However, the significance of any possible correlation between the ameliorated expression of these receptor genes and reduced albuminuria in the transgenic mice remains elusive.
Fig. 8.
Effect of adiponectin (ApN) overexpression on mRNA expression of cubilin (A), megalin (B), kidney injury molecule-1 (KIM-1; C), and neutrophil gelatinase-associated lipocalin (NGAL; D) in renal cortex determined by real-time RT-PCR. mRNA values were normalized by the levels of β-actin mRNA and then expressed relative to the mean value for the wild-type control group. ApN-Tg, ApN transgenic mice. *P < 0.05 vs. wild-type normal mice (WT); #P < 0.05 vs. wild-type mice receiving DOCA+ANG II infusion (WT/DOCA+ANG II).
Furthermore, kidney injury molecule-1 (KIM-1) is a type I transmembrane glycoprotein that is virtually undetectable in healthy kidney tissue but is abundantly expressed in injured renal tubular cells, particularly in injured proximal tubules (45). Neutrophil gelatinase-associated lipocalin (NGAL) is a member of the lipocalin superfamily of proteins that is normally expressed in the kidney. It is robustly expressed in the kidney and released from tubular cells following ischemic or nephrotoxic injury in animals and humans (8). Both KIM-1 and NGAL have been validated as early predictive markers of renal tubular injury. Indeed, renal KIM-1 and NGAL were highly expressed in DOCA+ANG II-infused WT mice compared with normal WT mice (Fig. 8, C and D). Surprisingly, both KIM-1 and NGAL in DOCA+ANG II-infused transgenic mice overexpressing ApN were much lower than those in DOCA+ANG II-infused WT mice, by 45 and 38%, respectively, although they were still higher than those in normal mice. These results indicate that tubular injury had occurred in the DOCA+ANG II-induced CKD mice but was much less in ApN-overexpressing mice.
Effect of ApN overexpression on cellular signaling pathways involved in the progression of CKD.
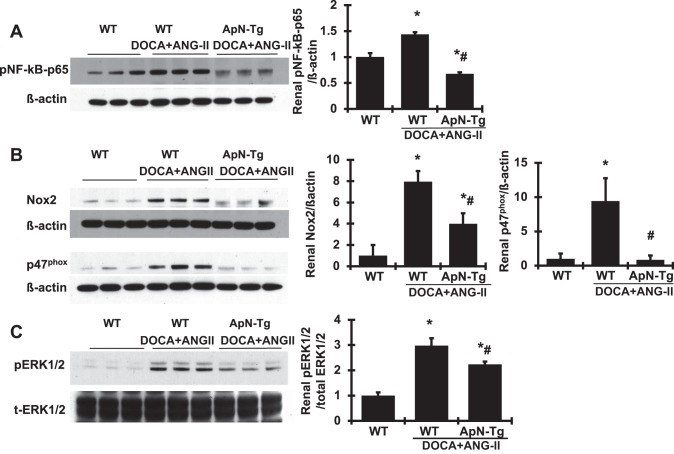
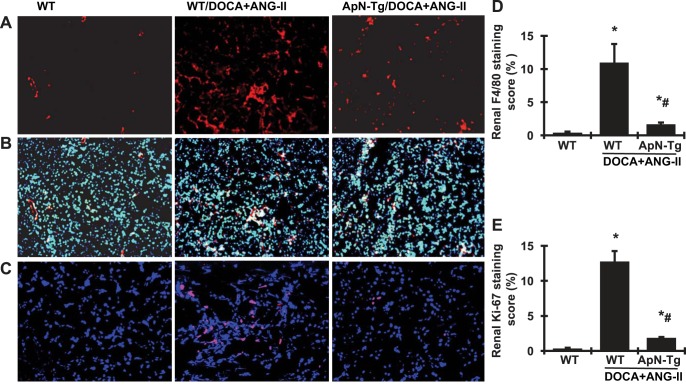
To verify the renoprotective effect of ApN on related cellular signaling pathways, we further observed that renal p-NF-κB-p65 protein production by Western blot analysis was increased markedly in DOCA+ANG II-infused WT mice compared with WT normal mice (Fig. 9). ApN overexpression significantly lowered the production of p-NF-κB-p65 in DOCA+ANG II-infused transgenic mice. Furthermore, renal protein production of renal Nox2 and p47phox, the family members of NAPDH oxidase, was much greater in DOCA+ANG II-infused WT mice compared with WT controls (Fig. 9), indicating significant activation of Nox2 in these diseased mice. However, both Nox2 and p47phox were markedly reduced or close to normal levels with ApN overexpression in DOCA+ANG II-infused transgenic mice (Fig. 9). In addition, the MAPK signaling pathways play a pivotal role in induction of cell growth and differentiation in response to extracellular stimulation (9). Among them, extracellular signal-regulated kinase (ERK) is the most extensively studied, and its function is typically associated with cell proliferative events (34). Interestingly, renal phosphorylation of ERK1/2 was increased in DOCA+ANG II-infused transgenic mice, indicating a significant activation of ERK1/2, which was reduced by 37.5% in DOCA+ANG II-infused ApN transgenic mice. Consistent with these increased protein markers of inflammation and oxidative stress in kidney tissue, the F4/80 antibody is known to label macrophages, and DOCA+ANG II-induced WT CKD mice had a substantial increase in the absolute number of F4/80-positive cells in both glomeruli and tubulointerstitial area, whereas the F4/80-positive cells were sparse in renal vessels in normal mice (Fig. 10, A, B, and D), indicating an accumulation of macrophages and inflammation in diseased kidney tissue. However, the number of F4/80-positive cells was reduced in the kidney tissue in DOCA+ANG II-infused ApN transgenic mice compared with DOCA+ANG II-infused WT mice. Moreover, Ki-67 is a nuclear protein that serves as a cellular marker of proliferation (42). Consistent with the activation of ERK1/2 in kidney tissue, the immunofluorescent staining analysis detected a dramatic increase in Ki-67-positive cell number in both renal glomeruli and tubulointerstitial area (Fig. 10, C and E) in DOCA+ANG II-infused WT mice compared with WT normal mice. In contrast, DOCA+ANG II-infused ApN transgenic mice had a much lower number and less staining intensity of Ki-67-positive cells in the kidney compared with diseased WT mice. In total, these data indicate that elevated ApN inhibits NF-κB-mediated inflammation, NAPDH-mediated oxidase generation and activation, and ERK1/2-mediated cell proliferation in the renal tissue of CKD mice.
Fig. 9.
Effect of adiponectin (ApN) overexpression on protein production of renal phosphorylated (p)-NF-κB-p65, NAPDH oxidase (Nox), and p-ERK1/2. Representative Western blots illustrate p-NF-κB-p65 (A), Nox2 and p47phox (B), p-ERK1/2 and total (t)-ERK1/2 (C), and β-actin protein expression. Graphic representations of the mean band intensity of p-NF-κB-p65, Nox2, and p47phox, normalized against the band intensity of β-actin, and of p-ERK1/2, normalized against the band intensity of t-ERK1/2, are shown at right. ApN-Tg, ApN transgenic mice. *P < 0.05 vs. wild-type normal mice (WT); #P < 0.05 vs. wild-type mice receiving DOCA+ANG II infusion (WT/DOCA+ANG II).
Fig. 10.
Effect of adiponectin (ApN) overexpression on renal immunofluorescent staining for F4/80- and Ki-67-positive cells. A–C: representative photomicrographs (at original magnification ×200) of renal sections with cells positive for F4/80 (in red; A), F4/80 merged with 4′,6-diamidino-2-phenylindole (DAPI, in blue; B), or Ki-67 (in red, DAPI in blue; C) derived from wild-type normal mice (WT), wild-type mice receiving DOCA+ANG II infusion (WT/DOCA+ANG II), and ApN transgenic mice receiving DOCA+ANG II infusion (ApN-Tg/DOCA+ANG II). D and E: graphic representation of scores of renal cells positive for F4/80 (D) or Ki-67 (E). *P < 0.05 vs. WT mice; #P < 0.05 vs. WT/DOCA+ANG II mice.
DISCUSSION
A number of clinical studies have generally identified negative correlations between plasma ApN levels and clinical disorders that had no impaired kidney function and established low plasma ApN level as an independent risk factor for these disorders including progression of proteinuria (11, 20, 39). In patients with impaired kidney function, high, rather than low, circulating levels of ApN are observed. An inverse relationship between circulating ApN and renal function assessed by glomerular filtration rate was found in the CKD population (7, 21, 40). The reason(s) for the high ApN levels in CKD are not fully understood. However, potential explanations include the loss of balance between the ligand and receptor reactivity, reduced ApN clearance by the kidneys leading to impaired biodegradation and elimination, and metabolic derangements in uremia. Moreover, the role of elevated ApN in CKD has been debated (17).
In the present study, we have shown that DOCA-salt and angiotensin II-treated mice (DOCA+ANG II-infused mice) with a modified protocol still exhibit marked hypertension with kidney damage in 3 wk, including polyuria, proteinuria, visible damage of podocytes as seen by electron microscopy and immunofluorescent staining, renal hypertrophy, glomerulosclerosis, and tubulointerstitial fibrosis, which is related to increased infiltration of inflammatory cells, cell proliferation, and expression of proinflammatory, oxidative stress-related, and profibrotic molecules. All these changes observed in DOCA+ANG II-infused mice reflect the important functional and structural changes that occur in progressive CKD (18). However, these mice in 3 wk were not able to show elevated circulating ApN levels as found in patients with CKD, particularly with end-stage renal disease. This may be because these mice had neither had the longer term of disease course nor reached the stages of CKD that patients did. Nonetheless, when these mice had a substantial increase in plasma levels of ApN using genetic manipulation (DOCA+ANG II-infused ApN transgenic mice), the damaged kidneys were exposed to the elevated ApN, similar to those in patients with CKD. Importantly, these mice with elevated ApN levels showed decreased susceptibility to chronic fibrotic renal disease induced by DOCA+ANG II infusion, without blood pressure reduction, as evidenced by reduction in all renal functional impairments and structural changes that were seen in WT mice induced by DOCA+ANG II infusion described above. Our study confirms the profound renal protective effect of ApN in the CKD mouse model. It is noteworthy that elevated ApN levels yet had no impact on blood pressure, suggesting a direct therapeutic effect of ApN for the kidney tissue independent of blood pressure reduction. Moreover, the capabilities of anti-inflammation, anti-NAPDH-mediated oxidative stress, and anti-MAPK/ERK-mediated cell proliferation of ApN may protect the kidney against the progression of CKD. DOCA+ANG II infusion also induces cardiac hypertrophy, fibrosis, and scarring, which were observed in the present study as well. The effect of ApN on cardiac injury in this model needs to be further determined separately. Our data, at least, suggest that increasing ApN levels under CKD are not harmful but may be an effective therapeutic strategy to inhibit renal inflammation and progression of renal fibrosis associated with renin-angiotensin system activation in CKD.
Both ANG II and aldosterone are pleiotropic peptides that play a critical role in the pathogenesis of organ damage through stimulating the oxidative/inflammatory insults alongside the corresponding activation of multicellular profibrotic signaling pathways (29, 43). These pathways can be related to high blood pressure per se and/or directly receptor-mediated actions of ANG II and aldosterone. It appears that both ANG II and aldosterone actively induce these events leading to target organ damage such as renal hypertrophy and fibrosis in the DOCA+ANG II-infused mice. Thus, the beneficial effects of any blood pressure-lowering agents on kidney inflammation and fibrosis in DOCA+ANG II-infused hypertensive mice are easy to interpret. It has been shown in vitro that ApN, through binding to its receptor, is able to phosphorylate endothelial nitric oxide (NO) synthase (eNOS) in endothelin cells leading to the formation of an eNOS-heat shock protein-90 complex and generation of NO, which may mediate endothelium-dependent vasodilation (5). However, it is unknown yet whether the effect of ApN-evoked endothelial NO production observed in vitro is also applicable in vivo, thereby being attributed to lowering blood pressure. The limitations of the present study are that we did not use telemetric blood pressure recordings and we did not measure NO production. We cannot definitely exclude a small effect of ApN on blood pressure on the basis of the observation of unchanged blood pressure in DOCA+ANG II-infused ApN transgenic mice by weekly tail cuff measurements. However, ApN had no effect on high blood pressure-related polyuria in DOCA+ANG II-infused ApN transgenic mice compared with DOCA+ANG II-infused WT mice, supporting the idea that the protective effect of ApN on the kidney could not be related to decreased systemic blood pressure. This finding on blood pressure is also consistent with the finding in a different hypertensive and accelerated atherosclerosis model that increasing plasma ApN levels are atheroprotective but independent of blood pressure reduction (46). Whether higher levels or a longer time course of ApN will impact blood pressure remains to be revealed.
Several in vitro studies have investigated the relationship between ANG II and ApN. We and others have shown that ApN has the ability to protect against ANG II-induced oxidative stress, NF-κB activation, and FN protein expression in cultured renal tubular cells and glomerular mesangial cells (10, 16). A similar effect of ApN against ANG II-induced cellular damage has been also observed in other varied cells including vascular endothelial cells, atrial myocytes and fibroblasts, vascular smooth muscle cells, macrophages, and so on (4, 32, 35, 52). Additionally, it has been shown that ANG II also induces renal tubular dysfunction by downregulation of tubular megalin or cubilin expression. In accordance with these in vitro findings, our data further clarified the inhibitory effect of ApN on ANG II-induced kidney disease in vivo via the similar signal transduction pathways identified in vitro. Moreover, they strengthen the view that preserving tubular function may represent an important contributing mechanism underlying the protective effect of ApN in CKD. Together, these data support the idea that ApN may reduce progression of CKD by limiting ANG II-induced oxidative stress, inflammation, tubular injury, and fibrosis in the kidney. On the other hand, although several studies have demonstrated a clear inverse relationship between the level of plasma aldosterone and the level of plasma ApN in obesity-associated diseases (1, 12), there is no report yet on the direct aldosterone-antagonistic effect of ApN. Any potential cross talk between aldosterone and ApN will be interesting and needs to be investigated. In addition, it is of interest that treatment with ANG II blockade, with an angiotensin-converting enzyme inhibitor or angiotensin receptor blocker, has been reported to increase serum ApN levels in the majority of the related studies (7). Further research is needed to determine whether “pharmacological” levels of ApN achieved by exogenous administration are beneficial for further reducing the progression of CKD when an angiotensin-converting enzyme inhibitor or angiotensin receptor blocker is being used and endogenous ApN is being increased.
Inconsistent with the effect of ApN observed in CKD due to glomerular disorders is that of ApN in renal interstitial fibrosis, particularly in animal models. ApN was first shown to be antifibrotic since ApN treatment attenuated the ischemia-reperfusion-induced kidney dysfunction, inflammation, and apoptotic responses in renal tubulointerstitium in mice (2). In contrast, it has been shown that ApN deficiency led to a reduction in the expression of profibrotic chemokines and cytokines and monocyte-to-fibroblast transition in injured kidneys induced by unilateral ureteral obstruction or unilateral ischemia-reperfusion in mice (49), which indicates that ApN is not protective in these models but, conversely, promotes interstitial fibrosis. We consider that there are at least two possible reasons for these inconsistencies. The first is that ApN-mediated monocyte-to-fibroblast transition in unilateral ureteral obstruction or ischemia-reperfusion injury is not a feature of DOCA+ANG II-induced kidney diseases or kidney diseases induced by other factors. Another possibility is that ApN deficiency may stimulate backup mechanisms to operate.
In conclusion, CKD contributes to the increasing morbidity and mortality in the whole world, and cardiovascular abnormalities are often exacerbated by uremia under CKD. ApN is a unique adipokine given its high concentration in the plasma and its beneficial effects in multiorgan protection. The present study has further demonstrated that mice with ApN overexpression have reduced progression of proteinuria, glomerulosclerosis, and tubulointerstitial fibrosis in a DOCA+ANG II-induced CKD mouse model by limiting renin-angiotensin system-activated oxidative stress, inflammatory, and fibrotic pathways. Our results suggest that treatment with ApN may hold promise as a novel intervention for CKD. However, further research investigating the use of ANG II blockade and/or an aldosterone antagonist along with a further increase in ApN levels in treating the progression of CKD or even cardiovascular disease is needed.
GRANTS
L. Tang was the recipient of a postdoctoral fellowship grant from the Center of Kidney Transplantation, Ningbo Urology and Nephrology Hospital, Ningbo, China.
DISCLOSURES
No conflicts of interest, financial or otherwise, are declared by the authors.
AUTHOR CONTRIBUTIONS
L.T., Y.W., S.B., and Y.H. conceived and designed research; L.T., Y.W., and Y.H. performed experiments; M.T., L.T., Y.W., and Y.H. analyzed data; M.T., L.T., Y.W., S.B., and Y.H. interpreted results of experiments; M.T., L.T., Y.W., and Y.H. prepared figures; Y.H. drafted manuscript; S.B. and Y.H. edited and revised manuscript; M.T., L.T., Y.W., S.B., and Y.H. approved final version of manuscript.
ACKNOWLEDGMENTS
We deeply thank Dr. John J. Mullins at University of Edinburgh for generousness in kindly providing the transgene vector for this study, Josselin Nespoux for excellent assistance with the measurement of immunofluorescent staining and Western blot analysis, and Dr. Zhenghao Deng for kind help with electron microscopy measurement on podocyte effacement.
REFERENCES
- 1.Anagnostis P, Katsiki N, Athyros VG, Karagiannis A. Adiponectin and aldosterone in left ventricular hypertrophy: an intriguing interplay. Angiology 1–4, 2014. doi: 10.1177/0003319714527785. [DOI] [PubMed] [Google Scholar]
- 2.Becker B, Kronenberg F, Kielstein JT, Haller H, Morath C, Ritz E, Fliser D; MMKD Study Group . Renal insulin resistance syndrome, adiponectin and cardiovascular events in patients with kidney disease: the mild and moderate kidney disease study. J Am Soc Nephrol 16: 1091–1098, 2005. doi: 10.1681/ASN.2004090742. [DOI] [PubMed] [Google Scholar]
- 3.Campbell SJ, Carlotti F, Hall PA, Clark AJ, Wolf CR. Regulation of the CYP1A1 promoter in transgenic mice: an exquisitely sensitive on-off system for cell specific gene regulation. J Cell Sci 109: 2619–2625, 1996. [DOI] [PubMed] [Google Scholar]
- 4.Cao T, Gao Z, Gu L, Chen M, Yang B, Cao K, Huang H, Li M. AdipoR1/APPL1 potentiates the protective effects of globular adiponectin on angiotensin II-induced cardiac hypertrophy and fibrosis in neonatal rat atrial myocytes and fibroblasts. PLoS One 9: e103793, 2014. doi: 10.1371/journal.pone.0103793. [DOI] [PMC free article] [PubMed] [Google Scholar]
- 5.Cheng KK, Lam KS, Wang Y, Huang Y, Carling D, Wu D, Wong C, Xu A. Adiponectin-induced endothelial nitric oxide synthase activation and nitric oxide production are mediated by APPL1 in endothelial cells. Diabetes 56: 1387–1394, 2007. doi: 10.2337/db06-1580. [DOI] [PubMed] [Google Scholar]
- 6.Choi KM, Lee J, Lee KW, Seo JA, Oh JH, Kim SG, Kim NH, Choi DS, Baik SH. Serum adiponectin concentrations predict the developments of type 2 diabetes and the metabolic syndrome in elderly Koreans. Clin Endocrinol (Oxf) 61: 75–80, 2004. doi: 10.1111/j.1365-2265.2004.02063.x. [DOI] [PubMed] [Google Scholar]
- 7.Christou GA, Kiortsis DN. The role of adiponectin in renal physiology and development of albuminuria. J Endocrinol 221: R49–R61, 2014. doi: 10.1530/JOE-13-0578. [DOI] [PubMed] [Google Scholar]
- 8.Clerico A, Galli C, Fortunato A, Ronco C. Neutrophil gelatinase-associated lipocalin (NGAL) as biomarker of acute kidney injury: a review of the laboratory characteristics and clinical evidences. Clin Chem Lab Med 50: 1505–1517, 2012. doi: 10.1515/cclm-2011-0814. [DOI] [PubMed] [Google Scholar]
- 9.Cobb MH, Goldsmith EJ. How MAP kinases are regulated. J Biol Chem 270: 14843–14846, 1995. doi: 10.1074/jbc.270.25.14843. [DOI] [PubMed] [Google Scholar]
- 10.Fang F, Liu GC, Kim C, Yassa R, Zhou J, Scholey JW. Adiponectin attenuates angiotensin II-induced oxidative stress in renal tubular cells through AMPK and cAMP-Epac signal transduction pathways. Am J Physiol Renal Physiol 304: F1366–F1374, 2013. doi: 10.1152/ajprenal.00137.2012. [DOI] [PubMed] [Google Scholar]
- 11.Fantuzzi G. Adiponectin in inflammatory and immune-mediated diseases. Cytokine 64: 1–10, 2013. doi: 10.1016/j.cyto.2013.06.317. [DOI] [PMC free article] [PubMed] [Google Scholar]
- 12.Flynn C, Bakris GL. Interaction between adiponectin and aldosterone. Cardiorenal Med 1: 96–101, 2011. doi: 10.1159/000327023. [DOI] [PMC free article] [PubMed] [Google Scholar]
- 13.Graciano ML, Mouton CR, Patterson ME, Seth DM, Mullins JJ, Mitchell KD. Renal vascular and tubulointerstitial inflammation and proliferation in Cyp1a1-Ren2 transgenic rats with inducible ANG II-dependent malignant hypertension. Am J Physiol Renal Physiol 292: F1858–F1866, 2007. doi: 10.1152/ajprenal.00469.2006. [DOI] [PubMed] [Google Scholar]
- 14.Gu C, Zhou G, Noble NA, Border WA, Cheung AK, Huang Y. Targeting reduction of proteinuria in glomerulonephritis: maximizing the antifibrotic effect of valsartan by protecting podocytes. J Renin Angiotensin Aldosterone Syst 15: 177–189, 2014. doi: 10.1177/1470320312466127. [DOI] [PubMed] [Google Scholar]
- 15.Guo JK, Menke AL, Gubler MC, Clarke AR, Harrison D, Hammes A, Hastie ND, Schedl A. WT1 is a key regulator of podocyte function: reduced expression levels cause crescentic glomerulonephritis and mesangial sclerosis. Hum Mol Genet 11: 651–659, 2002. doi: 10.1093/hmg/11.6.651. [DOI] [PubMed] [Google Scholar]
- 16.Guo X, Zhou G, Guo M, Cheung AK, Huang Y, Beddhu S. Adiponectin retards the progression of diabetic nephropathy in db/db mice by counteracting angiotensin II. Physiol Rep 2: e00230, 2014. doi: 10.1002/phy2.230. [DOI] [PMC free article] [PubMed] [Google Scholar]
- 17.Heidari M, Nasri P, Nasri H. Adiponectin and chronic kidney disease; a review on recent findings. J Nephropharmacol 4: 63–68, 2015. [PMC free article] [PubMed] [Google Scholar]
- 18.Hostetter TH. Hyperfiltration and glomerulosclerosis. Semin Nephrol 23: 194–199, 2003. doi: 10.1053/anep.2003.50017. [DOI] [PubMed] [Google Scholar]
- 19.Huang Y, Border WA, Yu L, Zhang J, Lawrence DA, Noble NA. A PAI-1 mutant, PAI-1R, slows progression of diabetic nephropathy. J Am Soc Nephrol 19: 329–338, 2008. doi: 10.1681/ASN.2007040510. [DOI] [PMC free article] [PubMed] [Google Scholar]
- 20.Hui X, Lam KS, Vanhoutte PM, Xu A. Adiponectin and cardiovascular health: an update. Br J Pharmacol 165: 574–590, 2012. doi: 10.1111/j.1476-5381.2011.01395.x. [DOI] [PMC free article] [PubMed] [Google Scholar]
- 21.Jia T, Carrero JJ, Lindholm B, Stenvinkel P. The complex role of adiponectin in chronic kidney disease. Biochimie 94: 2150–2156, 2012. doi: 10.1016/j.biochi.2012.02.024. [DOI] [PubMed] [Google Scholar]
- 22.Kantachuvesiri S, Fleming S, Peters J, Peters B, Brooker G, Lammie AG, McGrath I, Kotelevtsev Y, Mullins JJ. Controlled hypertension, a transgenic toggle switch reveals differential mechanisms underlying vascular disease. J Biol Chem 276: 36727–36733, 2001. doi: 10.1074/jbc.M103296200. [DOI] [PubMed] [Google Scholar]
- 23.Kirchhoff F, Krebs C, Abdulhag UN, Meyer-Schwesinger C, Maas R, Helmchen U, Hilgers KF, Wolf G, Stahl RA, Wenzel U. Rapid development of severe end-organ damage in C57BL/6 mice by combining DOCA salt and angiotensin II. Kidney Int 73: 643–650, 2008. doi: 10.1038/sj.ki.5002689. [DOI] [PubMed] [Google Scholar]
- 24.Kollerits B, Fliser D, Heid IM, Ritz E, Kronenberg F; MMKD Study Group . Gender-specific association of adiponectin as a predictor of progression of chronic kidney disease: the Mild to Moderate Kidney Disease Study. Kidney Int 71: 1279–1286, 2007. doi: 10.1038/sj.ki.5002191. [DOI] [PubMed] [Google Scholar]
- 25.Kubota N, Terauchi Y, Yamauchi T, Kubota T, Moroi M, Matsui J, Eto K, Yamashita T, Kamon J, Satoh H, Yano W, Froguel P, Nagai R, Kimura S, Kadowaki T, Noda T. Disruption of adiponectin causes insulin resistance and neointimal formation. J Biol Chem 277: 25863–25866, 2002. doi: 10.1074/jbc.C200251200. [DOI] [PubMed] [Google Scholar]
- 26.Looker HC, Krakoff J, Funahashi T, Matsuzawa Y, Tanaka S, Nelson RG, Knowler WC, Lindsay RS, Hanson RL. Adiponectin concentrations are influenced by renal function and diabetes duration in Pima Indians with type 2 diabetes. J Clin Endocrinol Metab 89: 4010–4017, 2004. doi: 10.1210/jc.2003-031916. [DOI] [PubMed] [Google Scholar]
- 27.McClain DA, Hazel M, Parker G, Cooksey RC. Adipocytes with increased hexosamine flux exhibit insulin resistance, increased glucose uptake, and increased synthesis and storage of lipid. Am J Physiol Endocrinol Metab 288: E973–E979, 2005. doi: 10.1152/ajpendo.00549.2004. [DOI] [PubMed] [Google Scholar]
- 28.Menon V, Li L, Wang X, Greene T, Balakrishnan V, Madero M, Pereira AA, Beck GJ, Kusek JW, Collins AJ, Levey AS, Sarnak MJ. Adiponectin and mortality in patients with chronic kidney disease. J Am Soc Nephrol 17: 2599–2606, 2006. doi: 10.1681/ASN.2006040331. [DOI] [PubMed] [Google Scholar]
- 29.Mezzano SA, Ruiz-Ortega M, Egido J. Angiotensin II and renal fibrosis. Hypertension 38: 635–638, 2001. doi: 10.1161/hy09t1.094234. [DOI] [PubMed] [Google Scholar]
- 30.Miyamoto S, Sharma K. Adipokines protecting CKD. Nephrol Dial Transplant 28, Suppl 4: iv15–iv22, 2013. doi: 10.1093/ndt/gft261. [DOI] [PMC free article] [PubMed] [Google Scholar]
- 31.Nielsen R, Christensen EI, Birn H. Megalin and cubilin in proximal tubule protein reabsorption: from experimental models to human disease. Kidney Int 89: 58–67, 2016. doi: 10.1016/j.kint.2015.11.007. [DOI] [PubMed] [Google Scholar]
- 32.Nour-Eldine W, Ghantous CM, Zibara K, Dib L, Issaa H, Itani HA, El-Zein N, Zeidan A. Adiponectin attenuates angiotensin II-induced vascular smooth muscle cell remodeling through nitric oxide and the RhoA/ROCK pathway. Front Pharmacol 7: 86, 2016. doi: 10.3389/fphar.2016.00086. [DOI] [PMC free article] [PubMed] [Google Scholar]
- 33.Ohashi K, Iwatani H, Kihara S, Nakagawa Y, Komura N, Fujita K, Maeda N, Nishida M, Katsube F, Shimomura I, Ito T, Funahashi T. Exacerbation of albuminuria and renal fibrosis in subtotal renal ablation model of adiponectin-knockout mice. Arterioscler Thromb Vasc Biol 27: 1910–1917, 2007. doi: 10.1161/ATVBAHA.107.147645. [DOI] [PubMed] [Google Scholar]
- 34.Ohren JF, Chen H, Pavlovsky A, Whitehead C, Zhang E, Kuffa P, Yan C, McConnell P, Spessard C, Banotai C, Mueller WT, Delaney A, Omer C, Sebolt-Leopold J, Dudley DT, Leung IK, Flamme C, Warmus J, Kaufman M, Barrett S, Tecle H, Hasemann CA. Structures of human MAP kinase kinase 1 (MEK1) and MEK2 describe novel noncompetitive kinase inhibition. Nat Struct Mol Biol 11: 1192–1197, 2004. [Erratum in Nat Struct Mol Biol 12: 278, 2005.] doi: 10.1038/nsmb859. [DOI] [PubMed] [Google Scholar]
- 35.Qi GM, Jia LX, Li YL, Li HH, Du J. Adiponectin suppresses angiotensin II-induced inflammation and cardiac fibrosis through activation of macrophage autophagy. Endocrinology 155: 2254–2265, 2014. doi: 10.1210/en.2013-2011. [DOI] [PubMed] [Google Scholar]
- 36.Rodríguez-Iturbe B, Johnson RJ, Herrera-Acosta J. Tubulointerstitial damage and progression of renal failure. Kidney Int Suppl 68: S82–S86, 2005. doi: 10.1111/j.1523-1755.2005.09915.x. [DOI] [PubMed] [Google Scholar]
- 37.Sanden SK, Wiggins JE, Goyal M, Riggs LK, Wiggins RC. Evaluation of a thick and thin section method for estimation of podocyte number, glomerular volume, and glomerular volume per podocyte in rat kidney with Wilms’ tumor-1 protein used as a podocyte nuclear marker. J Am Soc Nephrol 14: 2484–2493, 2003. doi: 10.1097/01.ASN.0000089829.45296.7C. [DOI] [PubMed] [Google Scholar]
- 38.Sharma K, Ramachandrarao S, Qiu G, Usui HK, Zhu Y, Dunn SR, Ouedraogo R, Hough K, McCue P, Chan L, Falkner B, Goldstein BJ. Adiponectin regulates albuminuria and podocyte function in mice. J Clin Invest 118: 1645–1656, 2008. doi: 10.1172/JCI32691. [DOI] [PMC free article] [PubMed] [Google Scholar]
- 39.Shehzad A, Iqbal W, Shehzad O, Lee YS. Adiponectin: regulation of its production and its role in human diseases. Hormones (Athens) 11: 8–20, 2012. [DOI] [PubMed] [Google Scholar]
- 40.Shen YY, Peake PW, Charlesworth JA. Review article: Adiponectin: its role in kidney disease. Nephrology (Carlton) 13: 528–534, 2008. doi: 10.1111/j.1440-1797.2008.01018.x. [DOI] [PubMed] [Google Scholar]
- 41.Smith JD, Wong E, Ginsberg M. Cytochrome P450 1A1 promoter as a genetic switch for the regulatable and physiological expression of a plasma protein in transgenic mice. Proc Natl Acad Sci USA 92: 11926–11930, 1995. doi: 10.1073/pnas.92.25.11926. [DOI] [PMC free article] [PubMed] [Google Scholar]
- 42.Starborg M, Gell K, Brundell E, Höög C. The murine Ki-67 cell proliferation antigen accumulates in the nucleolar and heterochromatic regions of interphase cells and at the periphery of the mitotic chromosomes in a process essential for cell cycle progression. J Cell Sci 109: 143–153, 1996. [DOI] [PubMed] [Google Scholar]
- 43.Takimoto E, Kass DA. Role of oxidative stress in cardiac hypertrophy and remodeling. Hypertension 49: 241–248, 2007. doi: 10.1161/01.HYP.0000254415.31362.a7. [DOI] [PubMed] [Google Scholar]
- 44.Tsioufis C, Dimitriadis K, Chatzis D, Vasiliadou C, Tousoulis D, Papademetriou V, Toutouzas P, Stefanadis C, Kallikazaros I. Relation of microalbuminuria to adiponectin and augmented C-reactive protein levels in men with essential hypertension. Am J Cardiol 96: 946–951, 2005. doi: 10.1016/j.amjcard.2005.05.052. [DOI] [PubMed] [Google Scholar]
- 45.Vaidya VS, Ramirez V, Ichimura T, Bobadilla NA, Bonventre JV. Urinary kidney injury molecule-1: a sensitive quantitative biomarker for early detection of kidney tubular injury. Am J Physiol Renal Physiol 290: F517–F529, 2006. doi: 10.1152/ajprenal.00291.2005. [DOI] [PubMed] [Google Scholar]
- 46.van Stijn CM, Kim J, Barish GD, Tietge UJ, Tangirala RK. Adiponectin expression protects against angiotensin II-mediated inflammation and accelerated atherosclerosis. PLoS One 9: e86404, 2014. doi: 10.1371/journal.pone.0086404. [DOI] [PMC free article] [PubMed] [Google Scholar]
- 47.van Walraven C, Manuel DG, Knoll G. Survival trends in ESRD patients compared with the general population in the United States. Am J Kidney Dis 63: 491–499, 2014. doi: 10.1053/j.ajkd.2013.09.011. [DOI] [PubMed] [Google Scholar]
- 48.Yamauchi T, Kamon J, Waki H, Terauchi Y, Kubota N, Hara K, Mori Y, Ide T, Murakami K, Tsuboyama-Kasaoka N, Ezaki O, Akanuma Y, Gavrilova O, Vinson C, Reitman ML, Kagechika H, Shudo K, Yoda M, Nakano Y, Tobe K, Nagai R, Kimura S, Tomita M, Froguel P, Kadowaki T. The fat-derived hormone adiponectin reverses insulin resistance associated with both lipoatrophy and obesity. Nat Med 7: 941–946, 2001. doi: 10.1038/90984. [DOI] [PubMed] [Google Scholar]
- 49.Yang J, Lin SC, Chen G, He L, Hu Z, Chan L, Trial J, Entman ML, Wang Y. Adiponectin promotes monocyte-to-fibroblast transition in renal fibrosis. J Am Soc Nephrol 24: 1644–1659, 2013. doi: 10.1681/ASN.2013030217. [DOI] [PMC free article] [PubMed] [Google Scholar]
- 50.Yano Y, Hoshide S, Ishikawa J, Hashimoto T, Eguchi K, Shimada K, Kario K. Differential impacts of adiponectin on low-grade albuminuria between obese and nonobese persons without diabetes. J Clin Hypertens (Greenwich) 9: 775–782, 2007. doi: 10.1111/j.1524-6175.2007.07321.x. [DOI] [PMC free article] [PubMed] [Google Scholar]
- 51.Zhang J, Gu C, Lawrence DA, Cheung AK, Huang Y. A plasminogen activator inhibitor type 1 mutant retards diabetic nephropathy in db/db mice through protecting podocytes. Exp Physiol 99: 802–815, 2014. doi: 10.1113/expphysiol.2013.077610. [DOI] [PMC free article] [PubMed] [Google Scholar]
- 52.Zhi Z, Pengfei Z, Xiaoyi T, Genshan M. Adiponectin ameliorates angiotensin II-induced vascular endothelial damage. Cell Stress Chaperones 19: 705–713, 2014. doi: 10.1007/s12192-014-0498-3. [DOI] [PMC free article] [PubMed] [Google Scholar]
- 53.Zhou G, Cheung AK, Liu X, Huang Y. Valsartan slows the progression of diabetic nephropathy in db/db mice via a reduction in podocyte injury, and renal oxidative stress and inflammation. Clin Sci (Lond) 126: 707–720, 2014. doi: 10.1042/CS20130223. [DOI] [PubMed] [Google Scholar]


