Abstract
Recent progress in the development of microfluidic microphysiological systems such as ‘organs-on-chips’ and microfabricated cell culture is geared to simulate organ-level physiology. These tissue models leverage microengineering technologies that provide capabilities of presenting cultured cells with input signals in a more physiologically relevant context such as perfused flow. Proteins that are secreted from cells have important information about the health of the cells. Techniques to quantify cellular proteins include mass spectrometry to ELISA (enzyme-linked immunosorbent assay). Although our capability to perturb the cells in the microphysiological systems with varying inputs is well established, we lack the tools to monitor in-line the cellular responses. User intervention for sample collection and off-site is cumbersome, causes delays in obtaining results, and is especially expensive because of collection, storage, and offline processing of the samples, and in many case, technically impractical to carry out because of limitations in sample volume. To address these shortcomings, we report the development of an ELISA that is carried out in-line under perfusion within a microfluidic device. Using this assay, we measured the albumin secreted from perfused hepatocytes without and under stimulation by IL-6. Since the method is based on a sandwich ELISA, we envision broad application of this technology to not just organs-on-chips but also to characterizing the temporal release and measurement of soluble factors and response to drugs.
Introduction
Cellular secretions are strong indicators of cell health and function and are used as a marker for quality control, efficacy, and toxicity. For instance, as the use of tissue culture systems such as the microfluidic-based systems, which aim to simulate organ-level physiology, becomes widespread, there is a greater need to measure cell function with ever decreasing sample sizes (Sackmann, 2014). One of the primary attractive attributes of microfluidic-based cell culture is the ability to subject the cells to physiological environment such as perfused flow (Folch, 2000, Whitesides, 2001, El-Ali, 2006, Khademhosseini, 2006, Huh, 2011, Inamdar, 2011, Bhushan, 2013, Bhatia, 2014, Hegde, 2014) and patterns of inputs such as nutrients, hormones, cytokines, and drugs and measuring the response over a period of time (Zhang, 2009, Zhang, 2010, Yi, 2015).
Although stand-along assays for sensitive measurements of cellular secretions exist, we lack the tools to monitor simultaneously different secretory cellular responses in-line as these techniques are cumbersome and involve a time-lag between sample acquisition and measurement (Kingsmore 2006, Pan, 2009, Darmanis, 2016, Genshaft, 2016, Prakadan, 2017, Lin, 2018). This is in part attributable to the technical challenge of integrating hardware with microfluidics and the lack of sensitivity of the assays, especially, for the small volumes associated with microfluidics. Several analytical techniques including mass spectrometry, ion mobility spectrometry, electrochemical detection, capillary electrophoresis, and surface plasmon resonance have been used to detect cellular secretions (Chen, 2012, Wang, 2016, Wang, 2016). For example, cellular proteins have been measured using microfluidic capillary electrophoresis and mass spectrometry (Lomasney, 2013, Dugan, 2014, Wang, 2016) however, there are several general limitations. Although these methods are quite sensitive, sample introduction, integration and analysis are complex (Schultz, 1993, Tao, 1998, Lin, 2018) and except for the microfluidic electrophoresis, these analytical techniques lack the desired sensitivity for continuous analysis of cellular secretions in microfluidics. Microfluidic platforms exacerbate the problem due to the low number of cells and the low volumes of perfused solutes. In other words, typical microfluidic volumes of tens of microliters are just not sufficient to carry out off-line measurements, which themselves may require tens of microliters each time. For example, a drop of blood that would be used for testing blood glucose levels is approximately 300 μl. In contrast, the typical volume of our hepatocyte microfluidic cultures is ~1 μl; the perfusion rates are low and we typically collect 2–10 μl of sample per hour. We have in the past, analyzed hepatic health by collecting media over a period of time and analyzing the albumin content through an off-line ELISA (Hegde, 2014).
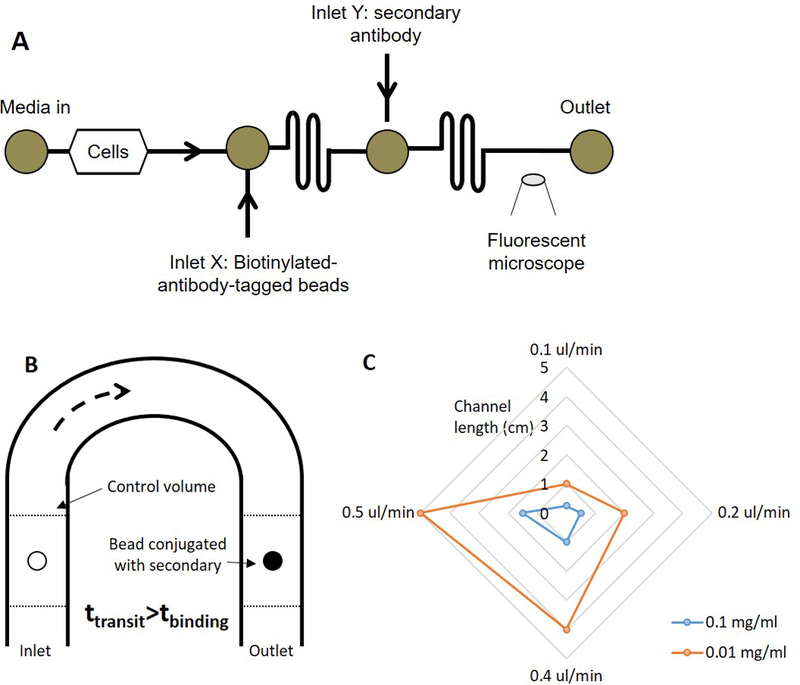
To address this shortcoming, we report the development of a microfluidic bead-based ELISA that measures in-line the albumin secreted by hepatocytes under perfused flow. We picked albumin as it is a marker of hepatic health and its monitoring is important to assess the function of the cells (Kang, 2002). We followed the basic strategy of a sandwich ELISA (Nielsen, 2004), which was carried out on a polymer bead as the bead was flowing in a microfluidic channel. The device consisted of a chamber for cells and two mixing channels (Figure 1A). Prior to conducting the assay, biotinylated-albumin-antibody was conjugated to 5-um avidin coated polystyrene beads. The antibody-tagged beads were introduced into the device at inlet X and the secondary antibody was introduced into the device at inlet Y. In the first mixing channel, the antigen (albumin) in the cellular perfusate conjugated with the biotinylated-albumin-antibody on the beads. In the second mixing channel, the fluorescently labeled secondary antibody conjugated with the antigen on the bead. The fluorescently labeled-beads were detected under a microscope placed at the device outlet.
Figure 1.

(A) Schematic of the device to carry out the continuous-flow ELISA. Cell perfusate is carried the first mixing channel where it conjugates with the biotinylated beads. The antigen-tagged beads and the secondary antibody conjugate in the second mixing channel. The fluorescently labeled beads are detected under a fluorescence microscope at the outlet, (B) Schematic of the analytical model, and (C) Plot representing the relationship between the channel dimensions, flow rate, and the concentration of the antibody.
We have developed a mathematical model to describe the assay In the model, we considered an antibody-tagged bead flowing through a device with channel length L at a velocity u (Figure 1B); the binding capacity of the bead was known from the manufacturer. As the bead flowed through the channel, consider it surrounded by a control volume V that contains the antigen; the amount of antigen in the control volume, Mantigen in terms of the concentration of the antigen, Cantigen, can be written as
| (Equation 1) |
Assuming diffusive transport inside the control volume, the time the antigen would take to diffuse and bind to the bead would be given in terms of the diffusivity, D, and characteristic length, <x>, as
| (Equation 2) |
The time that the bead will take to reach the end of the channel, tt, will be
| (Equation 3) |
For simplicity, we assumed negligible transport of analytes through the control volume in time tt. The bead should be able to reach the end of the channel before it is saturated with the antigen or,
| (Equation 4) |
In other words, the limit condition when the two times are equal should occur when the bead is saturated. For different channel dimensions, flow rates, and antigen concentrations, we calculated the parameters which satisfy these equations. Undertaking a similar design exercise for the binding between the antigen-bound bead and the secondary antibody, we obtain a radar plot charts the minimum channel length (radial) against the flow rate for different concentrations of the antibody that satisfy equation 4 (Figure 1C). The model indicates that a longer channel will allow a higher flow rate or a dilute concentration of the antibody (or antigen) to saturate the bead. It also suggests that a higher concentration of the antibody (or antigen) will saturate the bead faster than a lower concentration.
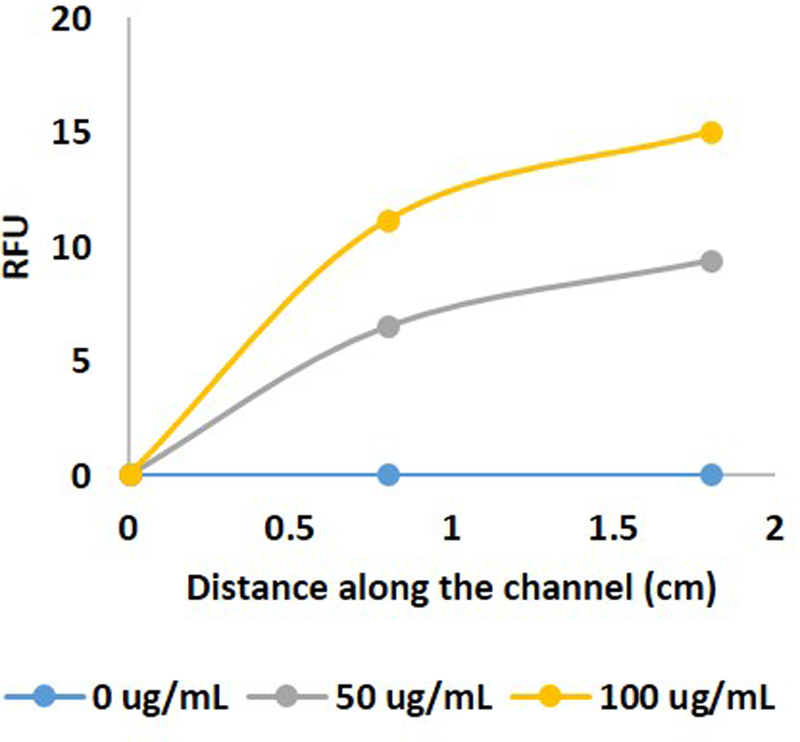
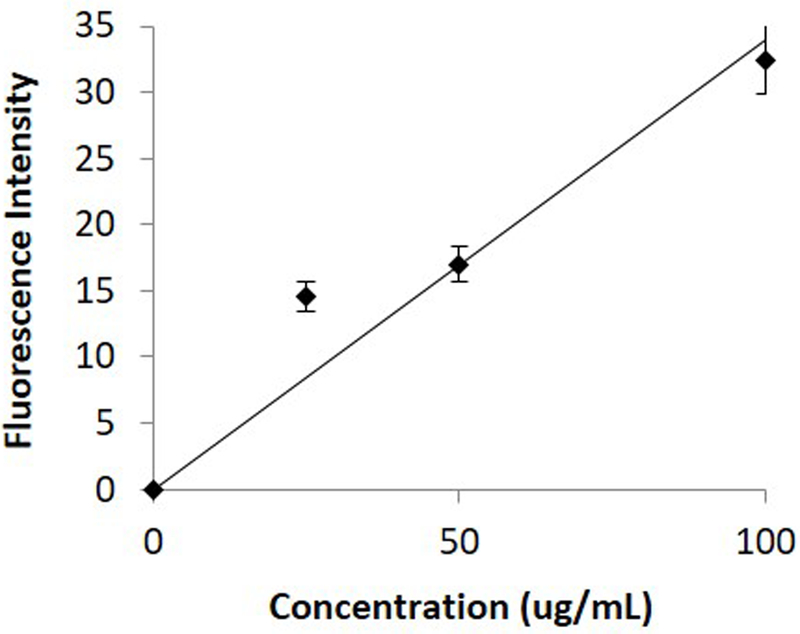
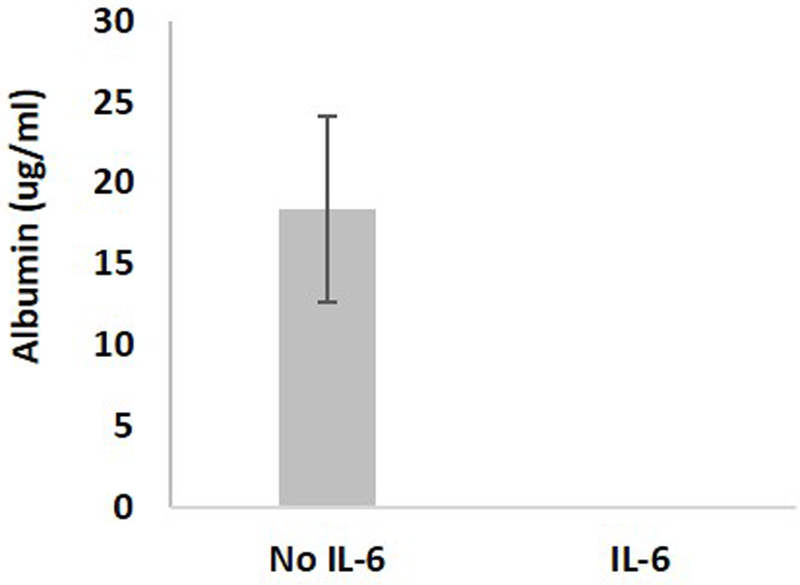
Using the results of the model as a starting point, we carried out a series of experiments to characterize the binding of FITC-biotin to the avidin coated beads. Different FITC-biotin concentrations, flow rates, and channel lengths were tested. We found that a channel of approximately 2 cm long at a flow rate of 0.1 μl/min was sufficient to carry out the conjugation with a concentration-response curve (Figure 2). Based upon these studies, we fabricated devices with channels 50 μm tall by 40 μm wide by 3 cm long (Supplementary Figure 1). We then constructed a concentration curve of rat albumin under perfusion in the device (Figure 3). Rat hepatocytes were then cultured in the devices and cultured under perfusion. Bead-based ELISA was carried out to measure the albumin secreted by the cells. To confirm that we were measuring cellular response, we treated the cells with IL-6, which caused a decrease in hepatocyte function and consequently lowered the amount of albumin secreted from the cells (Kang, 2002) (Supplementary Figure 2). Our experiment faithfully captured the decrease in albumin secretion (Figure 4).
Figure 2.

Conjugation of FITC-labeled biotin in relative fluorescence units (RFU) with the streptavidin coated beads along different locations in the channel.
Figure 3.

Standard curve of albumin under perfusion in the device.
Figure 4.

Albumin secreted from the hepatocytes in the device under perfusion without and with IL-6 stimulation.
Conclusions
We present a novel implementation of a sandwich ELISA by performing the assay in-line, under perfusion. Using this assay, we successfully measured the albumin secreted from rat hepatocytes under different conditions. We also developed a simple mathematical model that characterized the parameter space for microfluidic device design and operation. The generalized model links substrate binding capacity under perfusion to the microfluidic channel design, which can be used to design devices for specific proteins. Since the basic components of the assay are based on an ELISA, any antigen for which antibodies are available can be measured, rendering this approach to be broadly applicable. With a real-time fluorescence tracking algorithm, one can quickly measure the amount of antigen secreted by cells. More importantly, in-line measurements can be carried out in microfluidic cultures, thus opening the doors for monitoring cellular health as well as the toxic or metabolic response to a perturbation of drug, cytokine, or nutrient. We envision broad application of this technology beyond organs on chips towards characterizing the temporal release and measurement of soluble factors (Zhang, 2009, Zhang, 2010, Shackman, 2012, Yi, 2015) and response to drugs (Keppeke, 2014, Carlin, 2015).
Materials and methods
Preparation of beads.
Avidin coated polystyrene micro-beads were purchased from Spherotech (Lake Forest, IL). All antibodies and the albumin standard were purchased from Abcam (Cambridge, MA). The beads were washed thrice in 0.05% Tween (Thermo Fisher) before use. Beads were counted and conjugated with sufficient quantity of biotinylated-albumin-antibody to saturate the binding capacity, which was followed by an overnight incubation in Blockaid (Thermo Fisher) at 4C to reduce any non-specific adsorption.
Cell culture in microfluidic devices
Standard soft lithography protocols were used to fabricate the microfluidic devices. PDMS (polydimethylsiloxane) was purchased from Dow Chemical (Midland, MI). Rat hepatocytes were cultured in William’s E medium with 1% Penn-Strep. The devices were sterilized under UV light for 15 minutes after which the channels were coated with 50 µg/ml of bovine fibronectin (Sigma) and incubated for 1 hour at 37C. The cells were then seeded into the device and allowed to attach for 24 hours before changing media. Media was replaced every 24 hours and the cells were used in the experiment within 72 hours of plating into the device. Separate devices were used to stain the cells with a nuclear dye (Hoechst, Thermo Fisher) and count them using ImageJ (Bethesda, MD). For the IL-6 (R&D Systems) experiments, the cells were exposed to 2.5 ng/ml of IL-6 for 1 hour. Tygon tubing was connected to the devices. The media was perfused by using syringe pumps (Harvard Apparatus). All solutions including the beads were prepared fresh for each experiment.
Image analysis
The flowing beads were imaged using a Nikon Ti microscope equipped with a Hamamatsu CMOS camera. Images were captured at up to 100 Hz, which was several times faster than the frequency of beads ensuring that each bead was captured. The fluorescent intensity of the captured beads was measured using ImageJ (Bethesda, MD).
Supplementary Material
Image of microfluidic device.
Albumin secreted from hepatocytes in a tissue culture plate without and with IL-6 stimulation.
Acknowledgements
This work was supported by NIH grant (DK095984). We thank Dr. Sonali Karnik and Alice Chen for helping facilitate some of the experiments. The authors have no professional or financial conflicts, or interest to disclose.
References
- Bhatia SN & Ingber DE Nat Biotechnol 32, 760–772 (2014).10.1038/nbt.2989 [DOI] [PubMed] [Google Scholar]
- Bhushan A, Senutovitch N, Bale SS, McCarty WJ, Hegde M, Jindal R, … Lansing Taylor D. Stem Cell Res Ther 4 Suppl 1, S16 (2013).10.1186/scrt377 [DOI] [PMC free article] [PubMed] [Google Scholar]
- Carlin AF, Aristizabal P, Song Q, Wang H, Paulson MS, Stamm LM, … Wyles DL Hepatology 62, 1047–1058 (2015).10.1002/hep.27971 [DOI] [PMC free article] [PubMed] [Google Scholar]
- Chen Q, Wu J, Zhang Y & Lin JM Anal Chem 84, 1695–1701 (2012).10.1021/ac300003k [DOI] [PubMed] [Google Scholar]
- Darmanis S, Gallant CJ, Marinescu VD, Niklasson M, Segerman A, Flamourakis G, … Landegren U Cell Rep 14, 380–389 (2016).10.1016/j.celrep.2015.12.021 [DOI] [PMC free article] [PubMed] [Google Scholar]
- Dugan CE, Cawthorn WP, MacDougald OA & Kennedy RT Anal Bioanal Chem 406, 4851–4859 (2014).10.1007/s00216–014-7894–5 [DOI] [PMC free article] [PubMed] [Google Scholar]
- El-Ali J, Sorger PK & Jensen KF Nature 442, 403–411 (2006).10.1038/nature05063 [DOI] [PubMed] [Google Scholar]
- Folch A & Toner M Annu Rev Biomed Eng 2, 227–256 (2000).10.1146/annurev.bioeng.2.1.227 [DOI] [PubMed] [Google Scholar]
- Genshaft AS, Li S, Gallant CJ, Darmanis S, Prakadan SM, Ziegler CG, … Shalek AK Genome Biol 17, 188 (2016).10.1186/s13059–016-1045–6 [DOI] [PMC free article] [PubMed] [Google Scholar]
- Hegde M, Jindal R, Bhushan A, Bale SS, McCarty WJ, Golberg I, … Yarmush ML Lab Chip 14, 2033–2039 (2014).10.1039/c4lc00071d [DOI] [PMC free article] [PubMed] [Google Scholar]
- Huh D, Hamilton GA & Ingber DE Trends Cell Biol 21, 745–754 (2011).10.1016/j.tcb.2011.09.005 [DOI] [PMC free article] [PubMed] [Google Scholar]
- Inamdar NK & Borenstein JT Curr Opin Biotechnol 22, 681–689 (2011).10.1016/j.copbio.2011.05.512 [DOI] [PubMed] [Google Scholar]
- Kang YH, Berthiaume F & Yarmush ML Tissue Eng 8, 681–693 (2002) [DOI] [PubMed] [Google Scholar]
- Keppeke GD, Satoh M, Ferraz ML, Chan EK & Andrade LE Immunol Res 60, 38–49 (2014).10.1007/s12026–014-8515–2 [DOI] [PubMed] [Google Scholar]
- Khademhosseini A, Langer R, Borenstein J & Vacanti JP Proc Natl Acad Sci U S A 103, 2480–2487 (2006).10.1073/pnas.0507681102 [DOI] [PMC free article] [PubMed] [Google Scholar]
- Kingsmore SF Nat Rev Drug Discov 5, 310–320 (2006).10.1038/nrd2006 [DOI] [PMC free article] [PubMed] [Google Scholar]
- Lin L & Lin J-M Microfluidics-Mass Spectrometry for Cell Analysis. in Cell Analysis on Microfluidics (ed. Lin J-M) 291–311 (Springer Singapore, Singapore, 2018). [Google Scholar]
- Lin X & Lin J-M Cell Metabolite Analysis on Microfluidic Platform. in Cell Analysis on Microfluidics (ed. Lin J-M) 371–396 (Springer Singapore, Singapore, 2018). [Google Scholar]
- Lomasney AR, Yi L & Roper MG Anal Chem 85, 7919–7925 (2013).10.1021/ac401625g [DOI] [PMC free article] [PubMed] [Google Scholar]
- Nielsen UB & Geierstanger BH J Immunol Methods 290, 107–120 (2004).10.1016/j.jim.2004.04.012 [DOI] [PubMed] [Google Scholar]
- Pan S, Aebersold R, Chen R, Rush J, Goodlett DR, McIntosh MW, … Brentnall TA J Proteome Res 8, 787–797 (2009).10.1021/pr800538n [DOI] [PMC free article] [PubMed] [Google Scholar]
- Prakadan SM, Shalek AK & Weitz DA Nat Rev Genet 18, 345–361 (2017).10.1038/nrg.2017.15 [DOI] [PMC free article] [PubMed] [Google Scholar]
- Sackmann EK, Fulton AL & Beebe DJ Nature 507, 181–189 (2014).10.1038/nature13118 [DOI] [PubMed] [Google Scholar]
- Schultz NM & Kennedy RT Analytical Chemistry 65, 3161–3165 (1993).Doi 10.1021/Ac00069a035 [DOI] [Google Scholar]
- Shackman JG, Reid KR, Dugan CE & Kennedy RT Anal Bioanal Chem 402, 2797–2803 (2012).10.1007/s00216–012-5755–7 [DOI] [PMC free article] [PubMed] [Google Scholar]
- Tao L, Aspinwall CA & Kennedy RT Electrophoresis 19, 403–408 (1998).10.1002/elps.1150190307 [DOI] [PubMed] [Google Scholar]
- Wang DS & Fan SK Sensors (Basel) 16(2016).10.3390/s16081175 [DOI] [PMC free article] [PubMed] [Google Scholar]
- Wang X, Yi L & Roper MG Anal Chem 88, 3369–3375 (2016).10.1021/acs.analchem.6b00071 [DOI] [PubMed] [Google Scholar]
- Whitesides GM, Ostuni E, Takayama S, Jiang X & Ingber DE Annu Rev Biomed Eng 3, 335–373 (2001).10.1146/annurev.bioeng.3.1.335 [DOI] [PubMed] [Google Scholar]
- Yi L, Wang X, Dhumpa R, Schrell AM, Mukhitov N & Roper MG Lab on a Chip 15, 823–832 (2015).10.1039/C4LC01360C [DOI] [PMC free article] [PubMed] [Google Scholar]
- Zhang X, Grimley A, Bertram R & Roper MG Analytical Chemistry (2010) [DOI] [PMC free article] [PubMed]
- Zhang X & Roper MG Analytical Chemistry 81, 1162–1168 (2009) [DOI] [PMC free article] [PubMed] [Google Scholar]
Associated Data
This section collects any data citations, data availability statements, or supplementary materials included in this article.
Supplementary Materials
Image of microfluidic device.
Albumin secreted from hepatocytes in a tissue culture plate without and with IL-6 stimulation.


