

Abstract
IgM transcripts from different mucosal and systemic tissues from a single adult channel catfish have been evaluated. Arrayed heavy chain cDNA libraries from each of these different mucosal and systemic tissues were separately constructed, hybridized with VH family specific probes and a variety of approaches were used to define their structural relationships. Baseline hybridization studies indicated that the tissue libraries had different VH expression patterns, and sequencing studies indicated this was not simply due to varying proportions of the same B cell population. In the systemic tissues of PBL, spleen, and anterior kidney >95% of the sequenced clones in the arrayed libraries represented different heavy chain rearrangements. Diversity was also found in the mucosal libraries of skin, gill lamellae, and two non-adjoining regions of the intestine, but additional populations were identified which indicated localized clonal expansion. Various clonal sets were characterized in detail, and their genealogies indicated somatic mutation accompanied localized clonal expansion with some members undergoing additional mutations and expansion after migration to different mucosal sites. PCR analyses indicated these mucosal clonal sets were more abundant within different mucosal tissues rather than in the systemic tissues. These studies indicate that the mucosal immune system in fish can express B cell transcripts differently from those found systemically. These studies further indicate that the immune mucosal system is interconnected with clonal B cells migrating between different mucosal tissues, results which yield new insight into immune diversity in early vertebrate phylogeny.
Keywords: channel catfish, B cell, IgM, repertoire, mucosal
1. Introduction
Understanding the phylogenetic evolution of mucosal immune systems is important to derive insights into mechanisms responsible for the induction of protective immunity [1–3]. Few other classes of vertebrates are likely to be more dependent upon mucosal immunity than are the bony fish. The body of fish is completely covered in a mucosal surface which surrounds the gills, the skin, and the buccal/intestinal surface and provides protection under varying environmental conditions. Early studies to define mucosal immunity in fish determined that immunoglobulins were present in the mucus on the skin and internally in the bile [4, 5]. Furthermore, these immunoglobulins were present not as a product of serum transudation or active transport of serum immunoglobulins but were the result of local synthesis [6, 7]. As work has advanced, vaccination studies showed that the mucosal system of fish could be stimulated to produce antibodies, and these mucosal antibodies could be produced in the absence of a systemic response [8–10]. In addition, lymphocytes were identified within various mucosal locations in multiple species [9, 11–16].
But deeper understanding of the mucosal system of fish required a basic understanding of the genetic diversity of the genes of their immune systems to establish the necessary comparative information. As basic knowledge of mucosal immunity in fish has progressed, greater understanding of the genetic diversity of the Ig genes of fish has been made. Earlier studies in the channel catfish have defined 13 different VH families representing ~200 VH segments that are used in the heavy chain cDNA repertoire, and germline segments representing each family have been identified [17–20]. The DH locus, identified through approaches that examined the excision productions of DH-JH recombination events, comprises at least three DH segments and is located 9 kb upstream of the nine segments that compose the JH locus [21, 22].
These germline IgM VDJ heavy chain segments undergo a variety of modifications during and following recombination events including combinatorial and junctional diversity [23], somatic mutation [24], and revision [25, 26]. These events provide footprints for understanding clonal expansion patterns and serve as a foundation to understand the relationships of B cells in the mucosal and systemic tissues. These analyses have led to this report.
2. Materials and Methods
2.1. Construction of heavy chain cDNA libraries, hybridization, and sequence analysis
An individual adult outbred channel catfish (Ictalurus punctatus) was exsanguinated, and the following tissues excised: anterior kidney (AK), gill lamellae (GL) from a single gill arch, spleen (SP), skin (SK, ~2 cm2 from the dorsolateral surface), and intestine (~30 cm). The mesenteries and blood vessels were removed from the intestine, and the organ was thoroughly washed in 90% RPMI-1640. The intestine was cut into 3 equal (~10 cm) segments, and a 2 cm section from the middle of each segment was used for analysis. These widely separated and thus non-adjoining sections were designated intestine-1 (I1, from the proximal 1/3), intestine-2 (I2, from the middle 1/3), and intestine-3 (I3, from the distal 1/3). PBL were isolated from blood collected from the caudal artery/vein as described [27]. These experiments were conducted under an approved animal protocol from the Institutional Animal Care and Use Committee of the University of Mississippi Medical Center.
The procedures used to extract total RNA and synthesize cDNA from these tissues were described previously [20]. Briefly, first-strand cDNA synthesis was initiated with a Cμ2 domain primer, the products were tailed with poly-C at the 5’-end, and the products were amplified using a reverse Cμ1 domain primer and an abridged 5’-RACE adapter primer. PCR products between 450–550 bp in length were gel-excised and cloned. Heavy chain cDNA colonies derived from each of the tissues (except for I1) were arrayed onto LB agar plates, and replicate colony lifts of these cDNA libraries were hybridized with radiolabeled probes specific for the VH1, VH2, VH6 or VH7 families. Under the high stringency conditions used, the probes do not cross hybridize [20]. The heavy chain cDNA libraries were also hybridized with [γ32P]-end-labeled oligonucleotides designed to be specific for the CDR3-encoded region in members of various clonal sets (CS) or other cDNA clones. The hybridization media and the sequences of some of the CDR3-specific oligonucleotides were reported earlier [25]. All CDR3 probes and their respective hybridization and final wash temperatures are shown in Table 1.
Table 1.
Primer sequence of VH-, CH-regions and CS-specific pairs utilized for cDNA library hybridization and PCR assays for clonal rearrangements.
| Primera | Sequence | Reference Sequence (Accession Number)b, c |
Hybridization and (Wash) Temperatures Used to Screen cDNA Librariesd |
Annealing Temperaturee |
|---|---|---|---|---|
| VH-region | ||||
| VH1 | 5’-TGGGTGAAGCAGAACTCA-3’ | NG70 (M27230) |
N.A.f | N.A.f |
| VH2 | 5’-GTTGCTTCCTATGTGCAT-3’ | NG41 (M58671) |
N.A.f | N.A.f |
| VH6 | 5’-ATCCACACTCATAACCCCTG-3’ | VH6.1 (U09724) |
N.A.f | N.A.f |
| VH7 | 5’-TTTGCAGTGCTGAGATCAG-3’ | VH7E (AY238375) |
N.A.f | N.A.f |
| C-region | ||||
| Cμ1 | 5’-GATTTCGGGGCGCTTTGCACAG-3’ | NG70 (M27230) |
N.A.f | N.A.f |
| VH1-CS1 | ||||
| CDR1 | 5’-CTCAATGGGCAGCTACTG-3’ | 18C11VH1SK_CS1 (EU492763) |
||
| CDR3 | 5’-GGCCCCAGCTGCTATAATC-3’ | (54° C) | ||
| VH1-CS2 | ||||
| CDR1 | 5’-CTCAATGGGCAGCTACTACA-3’ | 19C10VH1I3_CS2 (EU492834) |
||
| CDR3 | 5’-GTAGCTGAAGCTGCTATCTC-3’ | (54° C) | ||
| VH2-CS1 | ||||
| FR2/CDR2 | 5’-GTGGATTGGACACATTAATAGTG-3’ | 16H03VH2I3_CS1 (EU492821) |
||
| CDR3 | 5’- TAAGCCACCCCGCCATATT-3’ | (54° C) | ||
| VH2-CS2 | ||||
| FR2/CDR2 | 5’-GT GGAGT GGATT GGACACATCT-3’ | 16C12VH2AK_CS2 (EU492599) |
||
| CDR3 | 5’-AAAGCCCGCTAGATCCTTA-3’ | (50° C) | ||
| VH7-CS1 | ||||
| FR1 | 5’-CTGGACCAGTCTCCTACTGTA-3’ | 18C05VH7I2_CS1 (EU492792) |
||
| CDR3 | 5’-GTAGGGCCCCATAAC-3’ | (42° C) | ||
| VH7-CS2 | ||||
| CDR1 | 5’-TCTGGAATGGATTGGTATTA-3’ | 18A02VH7GL_CS2 (EU492727) |
||
| CDR3 | 5’-AAACGCCACCCCAGTATA-3’ | |||
| 15E09VH1SP | ||||
| CDR1 | 5’-CTCAATGGGCAGCTACTACA-3’ | |||
| CDR3 | 5’-TCCCCTACCCCAGCTGGA-3’ | (EU492643) | (54° C) | |
| 18G10VH6SP | ||||
| FR2 | 5’-CTCTGGAGTGGATAGGACATAT-3’ | |||
| CDR3 | 5’-GCAAAGGGCGTAGTTATACC-3’ | (EU492688) | (54° C) | |
The VH region, CS-specific CDR1 and FR / CDR2 are sense primers; constant region and CS specific CDR3 are antisense primers.
The VH- and C-region primers were described by Yang et al. (2003).
The clonal set specific probes (VH1-CS2 CDR3, VH2-CS1 CDR3 and VH7-CS1 CDR3 were previously described by Lange et al. (2009).
The different hybridization and wash temperatures used for each CDR3 oligonucleotide except for VH7-CS2.
The annealing temperature used during the PCR cycling experiments for each individual CS specific primer pair. The annealing temperatures were optimized with the plasmid DNA of the reference clones.
Not applicable.
Plasmids from positive clones were sequenced as described [20] with heavy chain FR and CDR regions assigned using the nomenclature of IMGT, the international ImMunoGenetics information system [28]. Nucleotide substitutions were designated using IMGT nomenclature e.g. A322>G denotes that ‘A’ at position 322 is substituted by a ‘G’. Negative numbers indicate substitutions with the leader and 5’-untranslated region. A total of 383 clones were sequenced from the cDNA libraries: 310 clones were selected from those that were positive with VH family-specific probes, and 73 additional clones were positive with CDR3-specific probes. The sequences of 308 clones representing single rearrangements as well as representative members of clonal sets have been submitted to GenBank under the accession numbers EU492547-EU492853, and EU492867. Fifteen of these sequences were the products of receptor revision events and were characterized in a preceding study [25]; for clarity these 15 clones have been eliminated from the data shown in the figures and tables in the present study. The nomenclature for catfish germline DH and JH segments is from earlier studies [21, 22].
2.2. PCR assays for clonal rearrangements
PCR assays were used to evaluate the expression of specific clonal rearrangements within the tissues. The basic approach was to prepare VH family specific templates from each of the eight tissues, and then using equivalent amounts of these templates conduct PCR studies using clonal specific primers to determine the number of cycles needed to visualize the clonal product. First-strand cDNA synthesis reactions using a Cμ2 primer were done as described above using the RNA derived from the eight tissues (including I1). These eight first-strand products were amplified with a VH family-specific forward primer (VH1, VH2, VH6 or VH7) and a Cμ1 reverse primer [20]. The products were gel-excised and column purified thus deriving four VH family-specific cDNA pools from each tissue. Each cDNA pool was diluted 1:100, and subdilutions amplified for 15 cycles using the corresponding VH family-specific forward primer and the Cμ1 reverse primer (Table 1). Using equivalent amounts of the family specific cDNA from these reactions (e.g. VH1 cDNA from the eight organs would be used for analysis of rearrangements that used a member of the VH1 family), PCR reactions using primers specific to a clonal set were done by varying the number of cycles used for amplification. A master solution of sufficient volume to conduct the various cycling reactions was aliquoted to effect final amplification conditions of 0.2 mM dNTPs, 20mM Tris-HCl (pH 8.4), 1 mM MgCl2, 10 pmol of each primer and 1 U of Taq polymerase in a volume of 50 μl. The amplification parameters used an initial 5 min denaturation step at 94°C, followed by 15 to 40 cycles of 30 s at 94°C, 30 s at an annealing temperature dependent on the Tm of the primer pair, 30 s at 72°C, and a final extension of 7 min at 72°C. The primer pairs used were the CDR3 clonal-specific reverse primer (described above) paired with a VH member-restricted forward primer (Table 1). The products at the different amplification cycles were photographed following gel electrophoresis to assess their expression levels within the tissues. All experiments were done at least twice. To confirm these experiments targeted the correct rearrangement, various products were gel-excised, cloned and sequenced.
3. Results
3.1. Expression of different VH families in heavy chain cDNA libraries derived from different systemic and mucosal-associated tissues
To determine if VDJ rearrangements expressed in mucosal tissues were similar or different from those expressed systemically, RNA was isolated from eight different tissues from an individual adult channel catfish. Three represented systemic tissues [PBL, anterior kidney (AK, the major hematopoietic organ in bony fish), and spleen (SP)], the other five represented the mucosal-associated tissues, as each contains goblet cells [gill lamellae (GL), skin (SK), and three widely separated regions of the intestine designated I1, I2, and I3, see Materials and Methods]. The RNA derived from each tissue except I1 was used to construct a separate heavy chain cDNA library. These arrayed libraries, each composed of >500 clones, were sequentially hybridized with four probes each specific for a different VH family [20]. Three of these VH families were large to medium-sized (VH1, 22–28 genomic members; VH2, 20–24 genomic members; and VH6, 17–20 genomic members), the fourth represented a relatively small family (VH7, 8–10 genomic members) [17, 18].
The VH hybridization pattern of the PBL library provided a baseline to compare the relative expression of these families in the other libraries (Table 2). In PBL the percentages of VH1, VH2, and VH6 positive clones were similar ranging from 9% to 12% while VH7 clones represented less than 1% of the library. In contrast, the expression patterns of these families in the other libraries appeared different from PBL and from each other (Table 2). The libraries derived from the separate regions of the intestine (I2 and I3) were also different in the expression of VH1, VH6, and VH7.
Table 2.
Number and percentage of H chain clones expressing different VH families in heavy chain cDNA libraries derived from systemic or mucosal tissues.
| cDNA Librarya |
VH Familyb | ||||
|---|---|---|---|---|---|
| VH1 | VH2 | VH6 | VH7 | Total | |
| PBL | 53 (9.9%) |
48 (9.0%) |
63 (11.8%) |
2 (0.4%) |
166 (31.1%) |
| AK | 23 (4.3%) |
63 (11.8%) |
115 (21.6%) |
3 (0.6%) |
204 (38.3%) |
| SP | 9 (1.7%) |
90 (16.9%) |
157 (29.6%) |
2 (0.4%) |
258 (48.6%) |
| GL | 40 (7.5%) |
38 (7.1%) |
72 (13.5%) |
6 (1.1%) |
156 (29.3%) |
| SK | 32 (6.2%) |
3 (0.6%) |
16 (3.1%) |
0 (0.0%) |
51 (9.9%) |
| I2 | 57 (10.8%) |
28 (5.3%) |
60 (11.3%) |
41 (7.8%) |
186 (35.2%) |
| I3 | 353 (66.4%) |
18 (3.4%) |
13 (2.4%) |
0 (0.0%) |
384 (72.2%) |
Heavy chain cDNA libraries were separately constructed from the RNA derived from different tissues from an individual adult channel catfish: PBL, anterior kidney (AK), spleen (SP), gill lamellae (GL), skin (SK), and two widely separated regions of the intestine designated intestine-2 (I2) and intestine-3 (I3).
The number of clones in the libraries were: PBL, 533; AK, 532; SP, 531; GL, 533; SK, 513; I2, 529 and I3, 532. Each library was sequentially hybridized with one of four probes each probe specific for a different VH family. The number of hybridization positive clones and their percentage in the library is indicated.
3.2. Sequence analysis of clones from heavy chain cDNA libraries
The results suggested that different B cell populations may be present in different tissues. These results, however, would also be consistent with the interpretation that there were simply varying proportions of the same B cell population within these different tissues. To resolve this central question, 301 of the clones that hybridized with the VH probes were sequenced and alignments constructed to determine if different VDJ rearrangements were expressed. These sequences extended from the 5’-untranslated region downstream thru the Cμ1 domain.
During these analyses members of clonal sets (CS) were identified. These related sequences; some located in different libraries, expressed the same VDJ and exhibited a characteristic CDR3 junctional pattern likely restricted to that specific rearrangement. In addition, point mutations were observed. Our earlier studies had shown that it was unlikely that any one sequence had a mutation resulting from amplification error which indicated that somatic mutation occurred during clonal expansion [24]. These mutational patterns distinguished different clonal members and as will be shown later provided insight into their genealogies.
A summary of the sequenced clones and the rearrangements identified are shown in Table 3. The VH1 rearrangements from PBL, AK and SP were diverse. Of the 28 VH1 clones from these three libraries, 27 represented independent rearrangements and none of these were identified in any other library. The libraries derived from GL, SK and I2, however, each had members of the same CS designated VH1-CS1. This CS composed 50%, 93%, and 65% of the sequenced VH1 clones from these libraries, respectively, and mutational patterns indicated that clonal expansion occurred. VH1-CS1 members, however, were not among the 20 VH1 clones sequenced from the I3 library. Instead the I3 VH1 population was principally composed of members of VH1-CS2 (55% of the VH1 sequences). Clonal members of VH1-CS6 were also identified in I3, but the remaining VH1 rearrangements were different and not found in other libraries.
Table 3.
Summary of VDJ rearrangements and clonal sets identified in randomly sequenced clones expressing members of four VH families in heavy chain cDNA libraries derived from different tissues.
| VH1 | VH2 | |||||||
| VH1 Clonal Setsc | VH2 Clonal Setsc | |||||||
| cDNA Librarya |
Number of VH1 Clones Sequenced (% of VH1 Populationb) |
Number of Different VDJ Rearrangements |
Clonal Set Name |
Number of Clones Sequenced (Number Different) |
Number of VH2 Clones Sequenced (% of VH2 Populationb) |
Number of Different VDJ Rearrangements |
Clonal Set Name |
Number of Clones Sequenced (Number Different) |
| PBL | 12 (23%) |
12 | N.A. | N.A. | 12 (25%) |
12 | N.A. | N.A. |
| AK | 9 (39%) |
8d | N.A. | N.A. | 10 (16%) |
9 | VH2-CS2 VH2-CS5 VH2-CS6 |
2 (2 dif) 1 1 |
| SP | 7 (78%) |
7 | N.A. | N.A. | 17 (19%) |
17 | N.A. | N.A. |
| GL | 16 (40%) |
8d | VH1-CS1 VH1-CS3 |
8 (3 dif) 2 (2 dif) |
11 (29%) |
11 | N.A. | N.A. |
| SK | 14 (44%) |
2d | VH1-CS1 | 13 (4 dif) | 3 (100%) |
3 | N.A. | N.A. |
| I2 | 17 (30%) |
7d | VH1-CS1 | 11 (8 dif) | 9 (32%) |
7 | VH2-CS7 | 3 (3 dif) |
| I3 | 20 (6%) |
9d | VH1-CS2 VH1-CS6 |
11 (6 dif) 2 (2 dif) |
10 (56%) |
6d | VH2-CS1 VH2-CS5 VH2-CS6 |
4 (3 dif) 1 2 (0 dif) |
| VH6 | VH7 | |||||||
| VH6 Clonal Setsc | VH7 Clonal Setsc | |||||||
| cDNA Librarya |
Number of VH6 Clones Sequenced (% of VH6 Populationb) |
Number of Different VDJ Rearrangements |
Clonal Set Name |
Number of Clones Sequenced (Number Different) |
Number of VH7 Clones Sequenced (% of VH7 Populationb) |
Number of Different VDJ Rearrangements |
Clonal Set Name |
Number of Clones Sequenced (Number Different) |
| PBL | 15 (24%) |
14 | VH6-CS1 VH6-CS7 |
1 2 (2 dif) |
1 (50%) |
1 | VH7-CS1 | 1 |
| AK | 24 (21%) |
23 | VH6-CS1 VH6-CS3 VH6-CS5 |
1 2 (2 dif) 1 |
2 (67%) |
2 | N.A. | N.A. |
| SP | 28 (18%) |
27 | VH6-CS2 VH6-CS5 |
2 (2 dif) 1 |
2 (100%) |
2 | N.A. | N.A. |
| GL | 13 (18%) |
13 | VH6-CS4 | 1 | 6 (100%) |
4 | VH7-CS2 VH7-CS3 |
2 (2 dif) 2 (2 dif) |
| SK | 9 (56%) |
7 | VH6-CS4 | 3 (3 dif) | 0 (N.A.) |
N.A. | N.A. | N.A. |
| I2 | 12 (20%) |
10d | N.A. | N.A. | 13 (32%) |
2d | VH7-CS1 | 12 (4 dif) |
| I3 | 9 (69%) |
9 | N.A. | N.A. | 0 (N.A.) |
N.A. | N.A. | N.A. |
The tissues used for RNA isolation and library construction were from an individual catfish as described in Table I.
Determined by dividing the number of clones sequenced by the number of clones that hybridized with the VH probe (see Table I).
Sequences which had the same VDJ rearrangement were grouped into clonal sets (CS) and named by the VH family expressed in the rearrangement followed by an arbitrary numerical designation. Clonal members in different libraries were assigned the same CS name. N.A., not applicable.
Some clones from a library had the identical sequence: VH1 (AK, 2 clones; GL, 6 clones in VH1-CS1; SK, 10 clones in VH1-CS1; I2, 4 clones in VH1-CS1; and I3, 6 clones in VH1-CS2); VH2 (I3, 2 clones in VH2-CS1 and 2 clones in VH2-CS6); VH6 (I2, 3 clones); and VH7 (I2, 9 clones in VH7-CS1).
The VH2 clones from PBL, AK, and SP were also diverse as 38 of the 39 sequences represented different rearrangements. Likewise the VH2 clones from the GL and SK libraries represented different rearrangements not identified in other libraries. Five VH2 clonal populations were identified, three in one library (VH2-CS1 in I3, VH2-CS2 in AK, and VH2-CS7 in I2) and two in different libraries (VH2-CS5 and VH2-CS6 in AK and I3). The other nine I2 and I3 clones were different rearrangements.
A total of 110 VH6 clones were sequenced from the seven libraries and 96 of these (87%) represented rearrangements not found in other libraries. Six CS (comprising a total of 14 clones) were represented by limited clonal members: three in one library (VH6-CS2 in SP, VH6-CS3 in AK, and VH6-CS7 in PBL) and three in different libraries (VH6-CS1 in PBL and AK; VH6-CS5 AK and SP; and, VH6-CS4 in SK and GL). The limited number of VH7 clones restricted the assessment of VH7 diversity except in I2 where 12 of the 13 sequenced members of VH7-CS1 represented 4 different clonal members. The single VH7 clone from the PBL library was identical to one of these I2 members.
These combined results indicate that there is B-cell diversity within the systemic and mucosal-associated tissues. In the PBL library 39 of 40 clones represented different VDJ rearrangements. In the AK library 44 of 45 clones represented different sequences with 42 different rearrangements identified. In the SP library 53 of the 54 clones represented different rearrangements. The GL library had the highest proportion of members assigned to various CS, nonetheless 41 of the 46 clones represented different sequences comprising 36 different rearrangements. In the SK library 17 of the 26 clones represented 12 different rearrangements. Lastly, these results showed a distinction between heavy chain populations in the non-adjoining I2 and I3 regions of the intestine. A total of 51 clones from I2 and 39 clones from I3 were sequenced and none of the 50 different rearrangements were identified in both libraries.
3.3. Clonal expansion in systemic and mucosal-associated tissues
A total of 224 different VDJ rearrangements and 18 different CS were identified among the randomly sequenced clones from these libraries. The number and location of these CS members are summarized in Table 4. Sequence differences between clonal members within the same library coupled with the results that clonal members were present in libraries from different tissues showed that localized clonal expansion and migration to other tissues occurred.
Table 4.
Distribution and number of clones in clonal sets in heavy chain cDNA libraries derived from different tissues.
| VH Family |
Clonal Set Namea |
cDNA Libraryb |
Number of Clones Randomly Sequencedc |
Number of CDR3 Positive Clones in Library (% of VH Family)c |
Total Number of CS Members Sequenced (Number Different)d |
|---|---|---|---|---|---|
| VH1 | VH1-CS1 | GL | 8 | 12 (30.0%) | 10 (3 dif)e |
| SK | 13 | 28 (87.5%) | 28 (14 dif)e | ||
| I2 | 11 | 26 (45.6%) | 22 (14 dif)e | ||
| VH1-CS2 | PBL | 0 | 2 (3.8%) | 1 | |
| I3 | 11 | 204 (57.8%) | 20 (9 dif)e | ||
| VH1-CS3 | GL | 2 | N.D. | 2 (2 dif) | |
| VH1-CS6 | I3 | 2 | N.D. | 2 (2 dif) | |
| VH2 | VH2-CS1 | I3 | 4 | 9 (50.0%) | 8 (4 dif)e |
| VH2-CS2 | PBL | 0 | 1 (2.1%) | 1 | |
| AK | 2 | 9 (14.3%) | 4 (3 dif)e | ||
| SP | 0 | 2 (2.2%) | 1 | ||
| VH2-CS5 | AK | 1 | N.D. | 1 | |
| I3 | 1 | 1 | |||
| VH2-CS6 | AK | 1 | N.D. | 1 | |
| I3 | 2 | 2 (0 dif)e | |||
| VH2-CS7 | I2 | 3 | N.D. | 3 (3 dif) | |
| VH6 | VH6-CS1 | PBL | 1 | N.D. | 1 |
| AK | 1 | 1 | |||
| VH6-CS2 | SP | 2 | N.D. | 2 (2 dif) | |
| VH6-CS3 | AK | 2 | N.D. | 2 (2 dif) | |
| VH6-CS4 | GL | 1 | N.D. | 1 | |
| SK | 3 | 3 (3 dif) | |||
| VH6-CS5 | AK | 1 | N.D. | 1 | |
| SP | 1 | 1 | |||
| VH6-CS7 | PBL | 2 | N.D. | 2 (2 dif) | |
| VH7 | VH7-CS1 | PBL | 1 | 1 (50%) | 1 |
| I2 | 12 | 39 (95.1%) | 33 (8 dif)e | ||
| VH7-CS2 | GL | 2 | 2 (33.3%) | 2 (2 dif) | |
| VH7-CS3 | GL | 2 | N.D. | 2 (2 dif) |
Clones expressing the same rearrangement were assigned to clonal sets (CS) as in Table II.
The cDNA libraries from the different tissues are described in Table I.
VH clones from four different VH families were randomly sequenced. The libraries were also screened by hybridization or PCR with CDR3 oligonucleotides each specific for a CS. The number of randomly sequenced clones and the number of CDR3 positive clones is indicated. The number of CDR3 positive clones as a percentage of the library clones expressing the same VH family used in the clonal rearrangement is also shown. N.D., not determined.
The total number of CS members sequenced from each library includes those that were randomly sequenced following hybridization with the VH probes plus additional clones that were sequenced after analysis with CS-specific probes. The number of clones whose sequence was different due to somatic mutations is indicated.
Some clones in the same library had the identical sequence. The library and number of identical clones identified were: VH1 (GL, 8 clones in VH1-CS1; SK, two different populations in VH1-CS1, 14 clones in one population and 2 clones in the other; I2, 9 clones in VH1-CS1; I3, 12 clones in VH1-CS2), VH2 (I3, 5 clones in VH2-CS1; AK, 2 clones in VH2-CS2; and I3, 2 clones in VH2CS6), and VH7 (I2, 26 clones in VH7-CS1).
Additional evidence to support these observations was determined by characterizing the distribution of six CS, two with members in more than one library (VH1-CS1 in GL, SK, and I2; and VH7-CS1 in PBL and I2) and four with members in a single library (VH1-CS2 in I3, VH2-CS1 in I3, and VH2-CS2 in AK, and VH7-CS2 in GL). Different probes, each specific for the CDR3-encoded region in one of these CS, were sequentially hybridized to each library. VH7-CS2 was analyzed by screening the limited number of VH7-positive clones in the libraries by PCR using CDR3 specific primers. These results (Table 4) showed that members of two CS were only present in a single library (VH2-CS1 in I3 and VH7-CS2 in GL). Two other CS were present in PBL and one other library (VH1-CS2 in PBL and I3, and VH7-CS1 in PBL and I2), and the other two were in three libraries (VH1-CS1 in GL, SK and I2; and, VH2-CS2 in PBL, AK, and SP).
These results indicated that CS members can represent a significant proportion of the VH family-specific heavy chains locally expressed in a tissue and that clonal members can be present in more than a single tissue. VH1-CS1 was dominant in SK, I2, and the GL libraries representing 88%, 46%, and 30% of the VH1-positive members. VH1-CS2 comprised 58% of the VH1 positive clones in the I3 library, VH2-CS1 represented 50% of the VH2-positive members in the I3 library, and VH7-CS1 represented 95% of the VH7-positive members in I2.
3.4. Clonal genealogies of B cells within the systemic and mucosal-associated tissues
Sequence alignments showed that the VH-encoded regions could be readily assigned to different groups. Within each group these regions shared between 95 to 100% nt identity and exhibited coding region similarities likely restricted to a specific VH germline gene. Nucleotide differences were principally single position differences, and these infrequent differences were located at various sites within the encoded region. These results allowed a VH consensus sequence to be constructed that was derived from three or more independent rearrangements. The consensus sequence generally shared >98% nucleotide identity to the VH-encoded region of each clone assigned to that group. A summary of the consensus sequences representing the VH members likely expressed in the CS rearrangements is shown in Table 5.
Table 5.
Summary of VH consensus sequences used in the analysis of clonal lineages
| VH Consensus Sequence (Length)a |
Number of Independent Rearrangements Expressing the VH Consensus Sequence | Number of cDNA Clones in Clonal Sets Expressing the Consensus VH Sequenceb | Total Number of cDNA Clones Expressing the VH Consensus Sequence | Mean ± SD, and Range of the Percentage of Nucleotide Identities in cDNA Clones when Aligned with the VH Consensus Sequence | Representative cDNA Clone Expressing the VH Consensus Sequence (Accession Number) | Total Number of Nucleotide Differences Between Representative cDNA Clone and VH Consensus Sequence |
|---|---|---|---|---|---|---|
| VH1A (400 nt) |
7 | 31 (CS1) 2(CS6) |
38 | 98.9 ± 0.4 (97.8 – 99.7) |
20A06VH1SK_CS1 (EU492754) |
1 |
| VH1B (398 nt) |
10 | 10 (CS2) | 19 | 99.6 ± 0.5 (97.7 – 100)c |
15C07VH1PBL (EU492557) |
0 |
| VH1C (398 nt) |
7 | 2 (CS3) | 8 | 99.1 ± 0.7 (97.5 – 99.7) |
15C11VH1AK (EU492590) |
1 |
| VH2C (369 nt) |
4 | 2 (CS5) | 5 | 99.2 ± 0.5 (98.6 – 99.7) |
16E09VH2SP (EU492652) |
1 |
| VH2D (369 nt) |
4 | 4 (CS1) | 7 | 99.7 ± 0.2 (99.4 – 100) |
16H03VH2I3_CS1 (EU492821) |
0 |
| VH2G (369 nt) |
4 | 2 (CS6) | 5 | 99.4 ± 0.4 (98.9–99.7) |
16E05VH2SP (EU492649) |
1 |
| VH2H (350 nt) |
3 | 3 (CS7) | 5d | 98.8 ± 0.4 (98.2 – 99.1) |
16E08VH2SP (EU492651) |
3 |
| VH6A (369 nt) |
17 | 2(CS1) 2(CS2) 2(CS3) 4(CS4) |
23 | 99.2 ± 0.5 (97.8 – 100) |
17B10VH6GL (EU492718) |
0 |
| VH6B (366 nt) |
11 | 2 (CS5) | 12 | 99.3 ± 0.5 (98.6 – 100)e |
17B09VH6GL (EU492717) |
0 |
| VH6D (372 nt) |
7 | 2 (CS7) | 8 | 99.4 ± 0.5 (98.7 – 100) |
17C12VH6PBL_CS7 (EU492586) |
0 |
| VH7F (399 nt) |
4 | 2 (CS2) | 5 | 99.5 ± 0.4 (99.0 – 99.7) |
18A02VH7GL_CS2 (EU492727) |
1 |
The VH consensus sequence extends from the 5’-untranslated region thru the end of the encoded FR3 region.
The number of clones analyzed in clonal sets precedes the CS designation with identical clones within a tissue counted only once. The VH1A and VH6A consensus sequences were used in two or four different CS rearrangements respectively.
VH-encoded regions in clones 15E09VH1SP (EU492643), 19C10VH1I3_CS2 (EU492834), and 21D06VH1I3 (EU492842) were identical to the VH1B consensus sequence.
The VH2H consensus sequence was derived by including one clone from a previous study (M58670).
Alignments of known germline genes and the consensus sequences enabled genealogies to be constructed that reflected the patterns of likely clonal expansion. The genealogies of the 9 CS identified in a single library are shown in Fig. 1. Three CS from the GL library (VH1-CS3, VH7-CS2, and VH7-CS3) were each represented by 2 members that differed by 1, 2, or 4 mutations, respectively. Two other CS were in I3: in VH2-CS1 three members descended from a common mutated intermediate and each had 1 or 2 other mutations while in VH1-CS6 members descended from a mutated intermediate with one accumulating 5 other mutations. In I2, three members of VH2-CS7 were identified: two descended from a mutated intermediate and each gained 2 different mutations, whereas the third descended from the CS progenitor and had 5 other mutations. The genealogies of the CS in the PBL and AK libraries also had branches representing divergent mutational patterns. Thus, somatic mutation occurred during localized clonal expansion of B cells populations in both the mucosal-associated and the systemic tissues.
Figure 1. Genealogical relationships of clonally related sequences identified in heavy chain cDNA libraries derived from a single mucosal or systemic tissue.
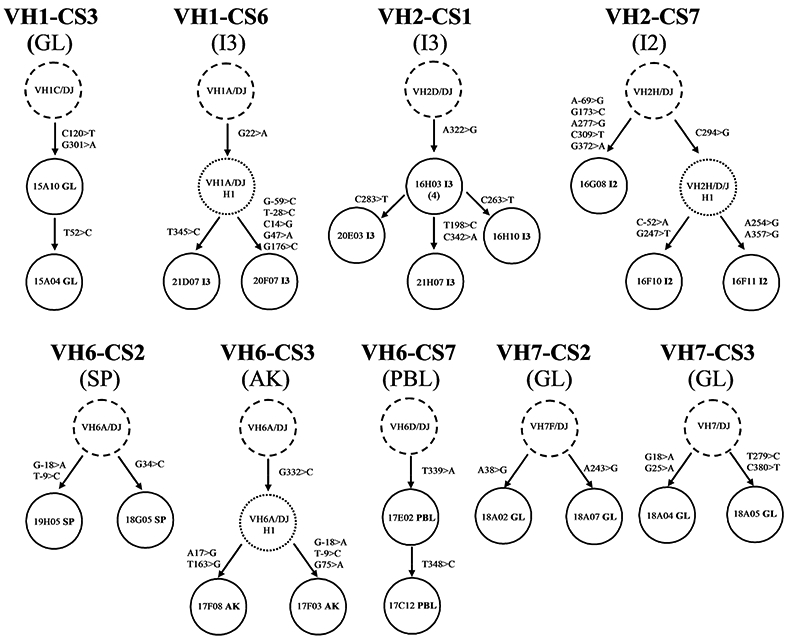
For each clonal set the dashed circle represents the common clonal progenitor resulting from VDJ recombination with the indicated VH member (see also Table IV). The solid circles represent different heavy chain cDNA library clones designated by clone names. Tissue origin is designated by the last two letters of the name: AK, GL, I1 (from a proximal third of the intestine), I2 (from the middle third of the intestine), I3 (from the distal third of the intestine), PBL, SK, and SP. The number of additional clones with the identical sequence, if any, is indicated by the number in parenthesis below the clone’s name. Mutations that occurred during clonal expansion are designated using standard IMGT nomenclature (e.g., C120>T means that the nucleotide “C” at position 120 of the V region has been mutated to “T”). Thus, for example, clone 15A10GL in VH1-CS3 had accumulated two mutations from the clonal progenitor (C120>T and G301>A), and both mutations were present in clone 15A04GL which had one additional mutation (T52>C).
In contrast to the CS where members were in a single library, the other CS had members in two or three libraries. The clonal lineages of 8 sets are shown in Fig. 2. As noted earlier, AK is the principal hematopoietic organ in fish and as such maturing lymphocytes leave AK and travel via the blood to reach alternate tissues. This pattern is evident in various clonal lineages. Three of these CS had members only in systemic tissues, four had members in one region of the intestine with other members in either PBL or AK, and one set had members in just the mucosal-associated tissues. These results indicate that clonal proliferation and expansion coupled with somatic mutation can occur within AK as well as in other tissues. In VH2-CS2 identical sequences were found in AK, SP, and PBL and each had an A328>C mutation in the DH2-encoded region. This was the only example of this mutation in the >20 independent rearrangements that expressed the DH2 segment which indicates this mutated clonal precursor had undergone lineage expansion and subsequent migration to other systemic tissues. During lineage expansion somatic mutation continued in AK as two other clones differed by 3 nts. In VH6-CS1 and VH6-CS5 few members were found but in both sets an unmutated clonal progenitor gave rise to mutated descendants located in different tissues.
Figure 2. Genealogical relationships of clonally related sequences identified in heavy chain cDNA libraries derived from different mucosal and systemic tissues.
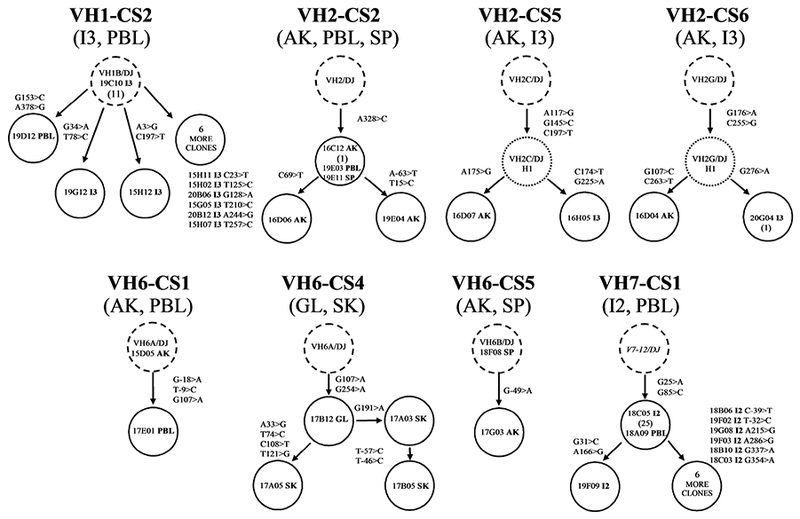
For each clonal set the dashed circle represents the common clonal progenitor resulting from VDJ recombination with the indicated VH member (see also Table IV). The solid circles represent different heavy chain cDNA library clones designated by clone names, and the dotted circles represent hypothetical clonal intermediates. Tissue origin is designated by the last two letters of the clone name with the mutations that occurred during clonal expansion (see legend to Fig. 1). The number of additional clones with the identical sequence, if any, is indicated by the number in parenthesis below the clone’s name.
The two CS with members in PBL and intestine showed that clonal proliferation accompanied by somatic mutation occurred in the I2 and I3 regions of the intestine and that clonal members gained systemic access via the blood. In VH1-CS2 12 of the 20 sequenced clones were identical and represented the clonal progenitor. Clonal expansion was accompanied by somatic mutation as 8 other I3 members differed by 1 or 2 mutations. In VH7-CS1, 26 of 33 I2 clonal members represented the same clonal intermediate with 2 mutations. Seven other members diverged from this common intermediate by 1–2 additional mutations.
The two other sets with members located within both the intestine and AK showed similar results. In VH2-CS5, I3 and AK clones shared 3 mutations yet were distinguished by 1 or 2 additional mutations. These results were supported by clonal lineage VH2-CS6 where common mutations were in clones from I3 and AK with these members accumulating additional mutations during lineage expansion. As it is unlikely that clonal precursors in different tissues would independently accumulate identical mutations, a mutated clonal descendant likely migrated into the alternative tissue.
Lastly in VH6-CS4, where clonal members were found in only GL and SK, it was evident that a mutated clonal member within one mucosal-associated tissue site can be clonally related to members in a distant mucosal-associated tissue site and these members can undergo further somatic mutation after migration.
3.5. B cell migration between the mucosal-associated tissues
To further support the evidence that there is B cell trafficking among the mucosal-associated tissues, sequencing efforts were focused on VH1-CS1 where sequencing of VH family-specific clones had identified 32 clonal members in the SK, I2, and GL libraries. CDR3 hybridization studies indicated that these three mucosal libraries were the only libraries where these members were located (Table 4). An additional 28 clones from these libraries were subsequently sequenced. The likely clonal genealogy of all 60 members and the patterns of expansion and trafficking of the sublineages within the mucosal-associated tissues are shown in Fig. 3. VH1-CS1 resulted from the rearrangement of member VH1A with germline segments DH1 and JH2 with N-region additions located between coding segments. From this progenitor rearrangement two lineages arose: one represented by a single SK clone with two mutations (20A06SK) and another lineage represented by the all of the remaining 59 clones which two shared mutations (T257>G, and A275>G, shown as intermediate VH1A/DJ_H1 in Fig. 3). Lineage expansion occurred in I2 resulting in multiple branches represented by five members with different mutational patterns. One clone (15F08I2, shaded in Fig. 3) had the G68>T mutation. This mutation served as an important reference for clonal expansion and migration because all other clones from I2 as well as all clones from SK and GL libraries carried this mutation. Furthermore the identical 15F08I2 sequence was identified in clones from both the SK and GL libraries (18C11SK and 18E01GL also shaded in Fig. 3). Descending from this mutated common intermediate, separate patterns of sublineage expansion occurred in each mucosal tissue. In I2, 9 clones differed from this mutated common intermediate by 1–6 nts. In the SK library, 12 clones differed from the mutated common intermediate by 1–3 mutations. Lastly in the GL library 2 clones differed from this common intermediate by 1 mutation.
Figure 3. Genealogical relationships of clonally-related VH1-CS1 cDNA sequences located in different mucosal tissues.
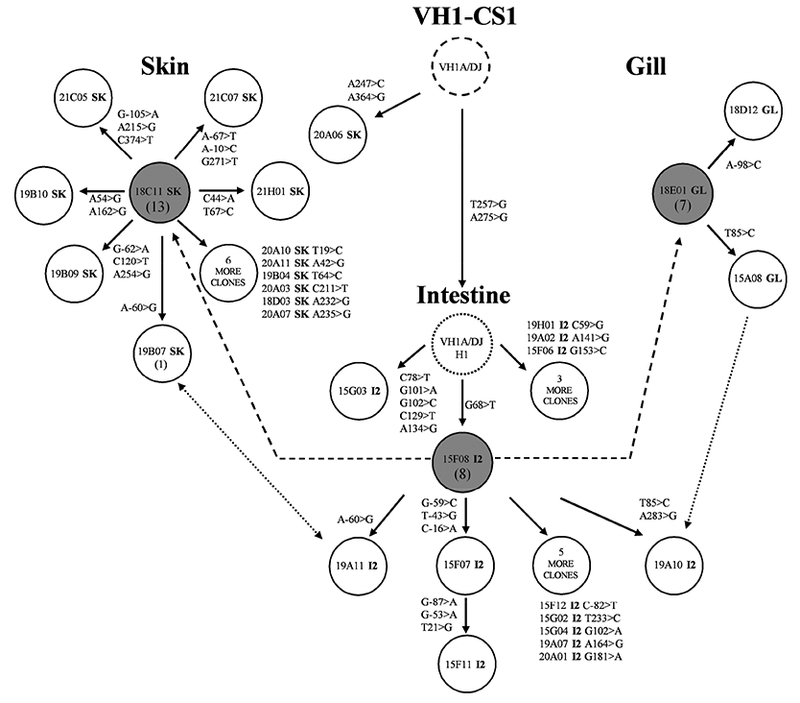
The dashed circle represents the common clonal progenitor resulting from VDJ recombination with VH1 member VH1A (see also Table IV). The solid circles represent different heavy chain cDNA library clones designated by clone names, and the dotted circle represents a hypothetical clonal intermediate. Tissue origin is designated by the last two letters of the clone name with the mutations that occurred during clonal expansion (see legend to Fig. 1). The number of additional clones with the identical sequence, if any, is indicated by the number in parenthesis below the referenced clone’s name. The shaded circles represent cDNA clones that have the identical sequence and were isolated from the SK, GL, and I2 mucosal heavy chain cDNA libraries. The dashed lines indicate the proposed primary B cell migration between the mucosal tissues. The dotted lines indicate the proposed secondary B cell migration between the mucosal tissues. The arrows represent the proposed unidirectional or bidirectional movement of B cells.
One additional feature was observed. Clones 19B07 from the SK library and 19A11 from the I2 library were identical to each other. These members were immediate descendants of the mutated common intermediate and both had an A-60>G mutation. Similarly clones 15A08 from the GL library and 19A10 from the I2 library were descendants of the common mucosal intermediate and both clones had a T85>C mutation (with 19A10 acquiring an additional mutation). As it would be unlikely that the same mutation would occur by chance in clonal members isolated from different tissues; these two clonal pairs more likely indicate that secondary B-cell trafficking of clonal descendants occurred between the mucosal-associated tissues.
3.6. Distribution and localization of clonal sets among the systemic and mucosal-associated tissues
The above results showed that clonal populations can undergo localized proliferation accompanied by somatic mutation within both systemic tissues and the mucosal-associated tissues. The results also showed that clonal members can migrate to different tissues where additional clonal expansion can occur. To further evaluate patterns of clonal proliferation and trafficking, the tissues were examined by PCR using different primers specific for each of six different CS (VH1-CS1, VH1-CS2, VH2-CS1, VH2-CS2, VH7-CS1, and VH7-CS2). The basic approach was to prepare VH family-specific heavy chain cDNA templates from each of the eight tissues using an aliquot of the original RNA pool from each tissue (including I1 where a heavy chain cDNA library had not been constructed). Equivalent amounts of these specific templates were then used to conduct PCR studies using clonal specific primers to determine the number of cycles required to visualize the clonal product.
This approach revealed distinctive distribution patterns of the CS within the eight different tissues. For clarity these results are individually summarized:
VH1-CS1: characterized clones had been identified in the GL, SK, and I2 libraries. PCR studies showed that this CS product was initially identified in SK cDNA at 22 cycles (data not shown), and in GL and I2 at 24 cycles. The product was subsequently identified at 28 cycles in I1, and later in PBL at 33 cycles with the cDNA from the remaining tissues positive by 36 cycles (Fig 4A).
VH1-CS2: characterized clones were identified in two libraries (I3, and a single PBL clone). PCR studies first identified this CS product in I3 (22 cycles, data not shown). Subsequently the product was faintly observed in I1 at 25 cycles and by 27 cycles it was present in the cDNA from all regions of the intestine (Fig. 4B). By 30 cycles it was detected in PBL, SP, GL, and SK, and lastly observed in AK at 35 cycles (data not shown).
VH2-CS1: characterized clones were identified only in the I3 library. PCR studies identified the product in I3 at 20 cycles (data not shown) and the product was present in other two intestinal regions by 22 cycles. At 26 cycles no additional tissues were positive. The CS product was subsequently detected in PBL, SP, and SK with very faint bands in AK and GL at 28 cycles.
VH2-CS2: characterized clones were identified in the AK, PBL, and SP libraries. PCR studies first identified the product in AK at 20 cycles with the product subsequently identified in PBL, SP and SK (faint) at 24 cycles. Faint products were next observed in GL and I1 at 28 cycles with faint I2 and I3 products present at 30 cycles.
VH7-CS1: characterized clones had been identified in I2 with a single clone identified in PBL. PCR studies identified prominent I2 and faint I1 and SK products at 16 cycles. By 18 cycles the product was also identified in I3 and GL. By 22 cycles faint products were identified in PBL and SP with the product lastly identified in AK at 24 cycles.
VH7-CS2: characterized clones were only identified in the GL library. PCR studies identified the product in GL at 16 cycles (data not shown), and by 18 cycles products were present in SK and I1. By 24 cycles the CS product was in I3 and SP and subsequently detected in all tissues except I2 and PBL at 28 cycles.
Figure 4. PCR analysis of clonal rearrangements in eight different tissues.
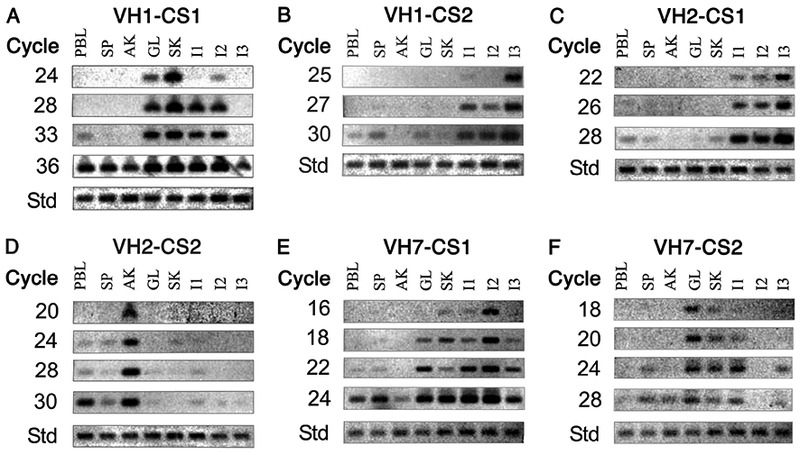
VH family-specific heavy chain cDNA pools derived from each of the indicated tissues (see Materials and Methods) were amplified with a VH family-specific forward primer (VH1, VH2 or VH7) and a Cμ1 reverse primer. Equivalent amounts of template (shown at the bottom of the panels as the standard (Std)) were then amplified for varying number of cycles with a VH-member restricted forward primer (corresponding to the member used in the clonal rearrangement) and a CDR3 clonal set specific reverse primer. The VH family-specific cDNA pool analyzed corresponded to the VH family expressed in the CS rearrangement. The name of the clonal set is shown above each panel (A-F) and the number of PCR cycles is shown at left of each panel.
To confirm that the PCR cycling studies resulted in the bonafide amplification of the targeted CS, the products derived from the different tissues at various amplification cycles were excised from the gels, the products were cloned, and various clones were sequenced. Sequencing studies were directed to those tissues where members of the CS had not been previously identified in the cDNA libraries (Table 4). The results of these studies are summarized in Table 6. These analyses confirmed that each sequenced clone represented a member of the targeted CS that was either identical or differed by single or multiple point mutations when compared to the common clonal VDJ precursor (as depicted in Figs. 1–3). Thus clonal expansion occurs within both the systemic tissues and the mucosal-associated tissues and these studies support the conclusion that clonal members can migrate to the mucosal-associated tissues prior to becoming systemically distributed to other solid tissues.
Table 6.
Summary of sequencing results on members of six Ig heavy chain clonal sets derived from different tissues at various amplification cycles
| Tissue Source |
Number of Clones Sequenced @Number of Amplification Cyclesa Clone Name (Mutational Differences, if any, with sequence of Clonal Set Progenitor)b |
|||||
|---|---|---|---|---|---|---|
| VH1-CS1 | VH1-CS2 | VH2-CS1 | VH2-CS2 | VH7-CS1 | VH7-CS2 | |
| PBL | N.D. | N.D. | 2 @ 26 cycles 21A07 (A258>G); 21A08 |
N.D. | N.D. | N.D. |
| SP | 1 @ 36 cycles 21A03(A242>G, T257>G, A275>G) |
1 @ 30 cycles 21A12 |
N.D. | N.D. | N.D. | 3 @ 24 cycles 20C12, 20D01, 20D07 (3 identical sequences) |
| AK | 1 @ 36 cycles 21A05 |
N.D. | N.D. | N.D. | N.D. | N.D. |
| GL | N.D. | 1 @ 30 cycles 22C06 |
N.D. | 2 @ 30 cycles 21C01, 21C02 (2 identical sequences) |
2 @ 18 cycles 21B05, 21B06 (2 identical sequences; G85>C) |
N.D. |
| SK | N.D. | 2 @ 30 cycles 21B02; 21B03 (A290>T) |
2 @ 28 cycles 21B11 (G196>A); 21B12 (G247>A, A258>G, G301>A) |
N.D. | N.D. | 2 @ 20 cycles 20D02, 20D03 (2 identical sequences) |
| I1 | 2 @ 28 cycles 20E11, 20E12 (2 identical sequences; T257>G, A275>G) |
2 @ 27 cycles 20C10 (C296>T); 20C11 |
2 @ 22 cycles 20D04; 20D05 (G196>A) |
2 @ 30 cycles 21C03, 21C04 (2 identical sequences) |
2 @ 18 cycles 21B07 (G85>C, G132>A); 21B08 (G85>C, A113>T) |
2 @ 20 cycles 20D09, 20D10 (2 identical sequences) |
| I2 | N.D. | N.D. | 1 @ 22 cycles 20D06 |
N.D. | N.D. | N.D. |
| I3 | 1 @ 36 cycles 20E07 (T257>G, A275>G) |
N.D. | N.D. | N.D. | 2 @ 18 cycles 21B09 (G85>C); 21B10 (T81>C, G85>C) |
2 @ 24 cycles 20D11, 20D12 (2 identical sequences) |
The amplification products were derived at the indicated number of PCR cycles and cloned. The number and name of sequenced clones is shown. Products that were not cloned or sequenced are indicated as not determined, N.D.
Cloned sequences from the cloned amplification product were aligned with the sequence of the respective clonal set VDJ clonal progenitor (as depicted in Figs. 1–3). The nucleotide position(s) of any point mutations in these clones are shown. VH2-CS1 and VH2-CS2 products were derived using antisense primers that reflected a single point mutation in the encoded CDR3 region of all clonal descendants in the cDNA libraries (A322>G or A328>C respectively). VH7-CS1 products were derived using a sense primer that reflected a single FR1 point mutation in all clonal descendants in the libraries (G25>A). Each sequenced clone reflected this respective nucleotide difference when compared to the clonal set progenitor.
Lastly, an additional series of PCR experiments was conducted. For these experiments 2 SP clones, each representing an independent rearrangement not identified in clones from this or any other library, were selected. Specific primers were generated and amplification studies were conducted. One of these independent rearrangements (15E09VH1SP) was identified in the VH1 cDNA from SP at 30 cycles but could not be detected in the cDNA from any other tissue at 36 cycles (data not shown). The other independent rearrangement (18G10VH6SP) could not be detected in the VH6 cDNA from any tissue after 40 cycles of amplification indicating a rare message had been sequenced from the SP library. Thus the presence of a sequence within an individual tissue cDNA library does not necessarily indicate that clonal expansion and dispersion to other tissues has occurred.
4. Discussion
Arrayed heavy chain cDNA libraries, each composed of more than 500 clones, were derived from seven different systemic and mucosal tissues. These libraries were hybridized with probes specific for four different VH families (VH1, VH2, VH3, and VH7). The percentages of the B cell transcripts in these libraries differed from each other, and this observation prompted further analyses to define these differences. We randomly sequenced clones from each of the seven tissue libraries and assigned the utilized germline VH, DH and JH gene segments based on known genomic and consensus sequences. Two groups of sequences were identified: those rearrangements which were only identified once in any library, and those sequences which represented clonal B cells as they were derived by the same rearrangement of genomic VDJ segments and had the junctional pattern in the CDR3 encoded region.
These analyses indicated there were different B cell populations within each of the individual tissues. Of the 72 randomly sequenced VH2 clones identified in all the libraries, >85% of the VDJ rearrangements were only found in one of the libraries (Table 3). Similarly of the 110 VH6 clones sequenced in these libraries >90% of these rearrangements were also found in only one library. Among the VH1 and VH7 randomly sequenced clones >50% and >40% respectively were only found in one library. The remaining sequences were members of various clonal sets with the number of clonal members higher within the mucosal tissue libraries of GL, SK, I2, and I3. This was perhaps most evident with the VH1 sequences where more than half of the randomly sequenced clones were members of clonal sets with members located in different mucosal tissues. This result prompted further investigations into the diversity of the mucosal clonal sets [24, 25].
As shown in mammalian studies [29–33] and in our earlier studies on the nucleotide targets of somatic mutation and receptor revision events in catfish, the identification and characterization of clonal B-cell lineages can provide insight into the activation, proliferation and the evolving diversity of different B cell subsets [24, 25, 34]. In this study 18 clonal B cell populations representing ~30% of the randomly sequenced clones were identified. The distribution of six of these clonal sets was determined by hybridizing each of the arrayed libraries with six different probes each specific for one of these sets. These additional sequencing studies allowed expanded genealogies of members of these clonal sets to be defined [24, 25]. Beyond the initial conclusion that clonal B cell lineages are found in each of these systemic and mucosal tissues, these results provide insight into the divergence and migration of clonal members in these tissues (Figs.1–3). Some of the clonal lineages were represented by simple divergence of clonal members by 1–2 mutations from a common progenitor. Other clonal sets were more divergent with clonal members carrying initial mutations from a common intermediate with clonal expansion continuing as members diverged from one another as different somatic mutations accumulated.
Fish lack bone marrow and AK is the primary site of hemopoiesis in bony fish, which includes the development of B cell precursors and residence of long-lived plasma cells [35, 36]. Accordingly, it might have been postulated that the AK might share clonal members in other tissues such as PBL and SP (see Fig 2), but it was not clear if there were alternative migratory pathways. Thus, perhaps what was the most intriguing was that mucosal clonal members could migrate into other mucosal sites and undergo additional clonal expansion after diverging from a common intermediate. This pattern was evident in the comprehensive analysis of the VH1-CS1 clonal population where 90% of the clonal members identified by hybridization in the libraries were sequenced (Fig. 3). Clonal proliferation in the middle region of the intestine led to common clonal intermediates found in different tissues (15F08I2, 18C11SK, 18E01GL). These identical common intermediates proliferated after migration to the gill lamellae and skin; where additional proliferation and somatic mutation continued to occur in all three tissues. There was additional evidence that secondary migration events occurred between the mucosal tissues (Fig. 3). These features suggest that there is an interactive mucosal system that involves proliferation and migration of B cells between the gill, intestine and skin.
Of additional interest was the finding that the two non-adjacent regions of the intestine (I2 and I3) appeared to have different populations of B cells, each dominated with their own clonal populations. As fish lack lymph nodes, this indicates that local proliferation accompanied by somatic mutations occurs in the tissue itself and in different intestinal regions (Table 4). This observation prompted additional studies to use PCR approaches to identify which other tissues were more likely to have specific members of the identified clonal populations. Specific primers for various clonal sets were made, and the systemic and mucosal B cell populations corresponding to the utilized VH family in these tissues were used to evaluate their locations (see materials and methods, and Fig 4). In addition, a third section of the intestine, designated I1, which had not been used for cDNA library construction, was also evaluated. These studies confirmed to us that there is indeed an interconnected mucosal system that is independent of that found systemically. Those clonal sets initially found by randomly sequencing library clones from mucosal tissues were present in the tissue where they were initially found, but members of these mucosal sets were predominantly located in other mucosal tissues rather than in the systemic tissues (Fig 4). In contrast, clonal sets found in the systemic tissues were predominantly found in other systemic tissues. PCR products from these studies were cloned, and sequencing confirmed that the amplified products were from bonafide clonal members.
In some species of bony fish such as trout another Ig designated IgT is present and has been characterized in mucosal surfaces. Although IgT is not found in all fish, including the catfish, IgM is more abundant than IgT in the trout skin and gill mucus [37, 38]. As noted in the Introduction, early studies defined the structure of IgM in the skin mucus and bile and showed that these mucosal Igs were derived by local synthesis rather than active transport or transudation [6]. In addition, these early studies identified a secretory component that was structurally identified to be covalently associated with IgM in the skin of the sheepshead, a evolutionally advanced teleost [4]. More recent studies have now identified the pIgR in fish and have indicated that secretory component is also present, suggesting that there may be a phylogenetically conserved mechanism for the transport of secretory Igs into external surfaces [37, 39, 40].
Lastly, the VH6-CS4 clonal set showed that the progenitor was located in the lamellae of the gills, and the somatically mutated descendants were located in the skin (Fig 2). Although it remains unknown if this migratory pathway is typical, bath immunization studies indicated that protective immunity is generated by uptake of antigen via the gills and the skin. As earlier studies have shown antigen bath immunization can lead to localized IgM antibodies in cutaneous mucus in the absence of systemic immune response [9, 41–44]. These combined results suggest these observations may be interrelated. Further studies to identify migratory pathways of mucosal and systemic B cells after activation by specific bath and oral immunization protocols may lead to improved vaccination approaches for growing aquaculture needs.
Highlights.
IgM transcripts from catfish show different B cell populations in tissues.
Clonal B cells reveal that somatic mutation accompanied localized clonal expansion.
Mucosal B cell transcripts can be expressed differently from that found systemically.
Acknowledgments
We extend appreciation to Dr. Feixue Yang for assistance in the construction of heavy chain cDNA libraries and to Mary Duke for high throughput cDNA sequencing support.
Funding
This work was supported by a grant from the National Institutes of Health (AI23052).
Abbreviations:
- VH
heavy chain variable region gene segment
- DH
heavy chain diversity region gene segment
- JH
heavy chain joining region gene segment
- AK
anterior kidney
- GL
gill lamellae
- I1
a central region located within the proximal 1/3 of the intestine
- I2
a central region located within the middle 1/3 of the intestine
- I3
a central region located within the distal 1/3 of the intestine
- SK
skin
- SP
spleen
- FR
framework region
- CDR
complementarity-determining region
Footnotes
Publisher's Disclaimer: This is a PDF file of an unedited manuscript that has been accepted for publication. As a service to our customers we are providing this early version of the manuscript. The manuscript will undergo copyediting, typesetting, and review of the resulting proof before it is published in its final citable form. Please note that during the production process errors may be discovered which could affect the content, and all legal disclaimers that apply to the journal pertain.
References
- [1].Brandtzaeg P, ‘ABC’ of mucosal immunology, Nestle.Nutr.Workshop Ser.Pediatr.Program 64 (2009) 23–38. [DOI] [PubMed] [Google Scholar]
- [2].Brandtzaeg P, Function of mucosa-associated lymphoid tissue in antibody formation, Immunol.Invest 39(4–5) (2010) 303–355. [DOI] [PubMed] [Google Scholar]
- [3].McGhee JR, Fujihashi K, Inside the mucosal immune system, PLoS.Biol 10(9) (2012) 1–5. [DOI] [PMC free article] [PubMed] [Google Scholar]
- [4].Lobb CJ, Clem LW, Phylogeny of immunoglobulin structure and function. XI. Secretory immunoglobulins in the cutaneous mucus of the sheepshead, Archosargus probatocephalus, Dev.Comp Immunol 5(4) (1981) 587–596. [DOI] [PubMed] [Google Scholar]
- [5].Lobb CJ, Clem LW, Phylogeny of immunoglobulin structure and function-XII. Secretory immunoglobulins in the bile of the marine teleost Archosargus probatocephalus, Mol.Immunol 18(7) (1981) 615–619. [DOI] [PubMed] [Google Scholar]
- [6].Lobb CJ, Clem LW, The metabolic relationships of the immunoglobulins in fish serum, cutaneous mucus, and bile, J.Immunol 127(4) (1981) 1525–1529. [PubMed] [Google Scholar]
- [7].Rombout JH, Yang G, Kiron V, Adaptive immune responses at mucosal surfaces of teleost fish, Fish.Shellfish.Immunol 40(2) (2014) 634–643. [DOI] [PubMed] [Google Scholar]
- [8].Rombout JWHM, Blok LJ, Lamer CHJ, Egberts E, Immunization of carp (Cyprinus carpio) with a Vibrio anguillarum bacterin indications for a common mucosal immune system, Developmental and Comparative Immunology 10 (1986) 341–351. [DOI] [PubMed] [Google Scholar]
- [9].Lobb CJ, Secretory immunity induced in catfish, Ictalurus punctatus, following bath immunization, Dev.Comp Immunol 11(4) (1987) 727–738. [DOI] [PubMed] [Google Scholar]
- [10].Salinas I, Zhang YA, Sunyer JO, Mucosal immunoglobulins and B cells of teleost fish, Dev.Comp Immunol 35(12) (2011) 1346–1365. [DOI] [PMC free article] [PubMed] [Google Scholar]
- [11].Rombout JHWM, Taverne-Thiele AJ, Villena MI, The gut-associated lymphoid tissue (GALT) of carp (Cyprinus carpio L.) an immunocytochemical analysis, Developmental and Comparative Immunology 17 (1993) 55–66. [DOI] [PubMed] [Google Scholar]
- [12].Rombout JH, Huttenhuis HB, Picchietti S, Scapigliati G, Phylogeny and ontogeny of fish leucocytes, Fish.Shellfish.Immunol 19(5) (2005) 441–455. [DOI] [PubMed] [Google Scholar]
- [13].Huttenhuis HB, Romano N, Van Oosterhoud CN, Taverne-Thiele AJ, Mastrolia L, Van Muiswinkel WB, Rombout JH, The ontogeny of mucosal immune cells in common carp (Cyprinus carpio L.), Anat.Embryol.(Berl) 211(1) (2006) 19–29. [DOI] [PubMed] [Google Scholar]
- [14].Rombout JH, Abelli L, Picchietti S, Scapigliati G, Kiron V, Teleost intestinal immunology, Fish.Shellfish.Immunol 31(5) (2011) 616–626. [DOI] [PubMed] [Google Scholar]
- [15].Picchietti S, Guerra L, Bertoni F, Randelli E, Belardinelli MC, Buonocore F, Fausto AM, Rombout JH, Scapigliati G, Abelli L, Intestinal T cells of Dicentrarchus labrax (L.): gene expression and functional studies, Fish.Shellfish.Immunol 30(2) (2011) 609–617. [DOI] [PubMed] [Google Scholar]
- [16].Parra D, Korytar T, Takizawa F, Sunyer JO, B cells and their role in the teleost gut, Dev Comp Immunol 64 (2016) 150–66. [DOI] [PMC free article] [PubMed] [Google Scholar]
- [17].Ghaffari SH, Lobb CJ, Cloning and sequence analysis of channel catfish heavy chain cDNA indicate phylogenetic diversity within the IgM immunoglobulin family, J.Immunol 142(4) (1989) 1356–1365. [PubMed] [Google Scholar]
- [18].Ghaffari SH, Lobb CJ, Heavy chain variable region gene families evolved early in phylogeny. Ig complexity in fish, J.Immunol 146(3) (1991) 1037–1046. [PubMed] [Google Scholar]
- [19].Ventura-Holman T, Jones JC, Ghaffari SH, Lobb CJ, Structure and genomic organization of VH gene segments in the channel catfish: members of different VH gene families are interspersed and closely linked, Mol.Immunol 31(11) (1994) 823–832. [DOI] [PubMed] [Google Scholar]
- [20].Yang F, Ventura-Holman T, Waldbieser GC, Lobb CJ, Structure, genomic organization, and phylogenetic implications of six new VH families in the channel catfish, Mol.Immunol 40(5) (2003) 247–260. [DOI] [PubMed] [Google Scholar]
- [21].Hayman JR, Ghaffari SH, Lobb CJ, Heavy chain joining region segments of the channel catfish. Genomic organization and phylogenetic implications, J.Immunol 151(7) (1993) 3587–3596. [PubMed] [Google Scholar]
- [22].Hayman JR, Lobb CJ, Heavy chain diversity region segments of the channel catfish: structure, organization, expression and phylogenetic implications, J.Immunol. 164(4) (2000) 1916–1924. [DOI] [PubMed] [Google Scholar]
- [23].Bengten E, Wilson M, Antibody Repertoires in Fish, Results and problems in cell differentiation 57 (2015) 193–234. [DOI] [PubMed] [Google Scholar]
- [24].Yang F, Waldbieser GC, Lobb CJ, The nucleotide targets of somatic mutation and the role of selection in immunoglobulin heavy chains of a teleost fish, J.Immunol 176(3) (2006) 1655–1667. [DOI] [PubMed] [Google Scholar]
- [25].Lange MD, Waldbieser GC, Lobb CJ, Patterns of receptor revision in the immunoglobulin heavy chains of a teleost fish, J Immunol 182(9) (2009) 5605–22. [DOI] [PMC free article] [PubMed] [Google Scholar]
- [26].Hsu E, Criscitiello MF, Diverse Immunoglobulin Light Chain Organizations in Fish Retain Potential to Revise B Cell Receptor Specificities, The Journal of Immunology 177(4) (2006) 2452–2462. [DOI] [PMC free article] [PubMed] [Google Scholar]
- [27].van Ginkel FW, Miller NW, Lobb CJ, Clem LW, Characterization of anti-hapten antibodies generated in vitro by channel catfish peripheral blood lymphocytes, Dev.Comp Immunol 16(2–3) (1992) 139–151. [DOI] [PubMed] [Google Scholar]
- [28].Lefranc MP, Giudicelli V, Ginestoux C, Bodmer J, Muller W, Bontrop R, Lemaitre M, Malik A, Barbie V, Chaume D, IMGT, the international ImMunoGeneTics database, Nucleic Acids Res. 27(1) (1999) 209–212. [DOI] [PMC free article] [PubMed] [Google Scholar]
- [29].Wilson PC, Wilson K, Liu YJ, Banchereau J, Pascual V, Capra JD, Receptor revision of immunoglobulin heavy chain variable region genes in normal human B lymphocytes, J Exp Med 191(11) (2000) 1881–1894. [DOI] [PMC free article] [PubMed] [Google Scholar]
- [30].Davila M, Liu F, Cowell LG, Lieberman AE, Heikamp E, Patel A, Kelsoe G, Multiple, conserved cryptic recombination signals in VH gene segments: detection of cleavage products only in pro B cells, J Exp Med 204(13) (2007) 3195–208. [DOI] [PMC free article] [PubMed] [Google Scholar]
- [31].Kepler TB, Munshaw S, Wiehe K, Zhang R, Yu JS, Woods CW, Denny TN, Tomaras GD, Alam SM, Moody MA, Kelsoe G, Liao HX, Haynes BF, Reconstructing a B-Cell Clonal Lineage. II. Mutation, Selection, and Affinity Maturation, Front Immunol 5 (2014) 1–10. [DOI] [PMC free article] [PubMed] [Google Scholar]
- [32].Hershberg U, Luning Prak ET, The analysis of clonal expansions in normal and autoimmune B cell repertoires, Philos Trans R Soc Lond B Biol Sci 370(1676) (2015) 1–16. [DOI] [PMC free article] [PubMed] [Google Scholar]
- [33].Meng W, Zhang B, Schwartz GW, Rosenfeld AM, Ren D, Thome JJC, Carpenter DJ, Matsuoka N, Lerner H, Friedman AL, Granot T, Farber DL, Shlomchik MJ, Hershberg U, Luning Prak ET, An atlas of B-cell clonal distribution in the human body, Nat Biotechnol 35 (2017) 879–884. [DOI] [PMC free article] [PubMed] [Google Scholar]
- [34].Saunders HL, Oko AL, Scott AN, Fan CW, Magor BG, The cellular context of AID expressing cells in fish lymphoid tissues, Dev Comp Immunol 34(6) (2010) 669–76. [DOI] [PubMed] [Google Scholar]
- [35].Zwollo P, Cole S, Bromage E, Kaattari S, B Cell Heterogeneity in the Teleost Kidney: Evidence for a Maturation Gradient from Anterior to Posterior Kidney, The Journal of Immunology 174(11) (2005) 6608–6616. [DOI] [PubMed] [Google Scholar]
- [36].Bromage ES, Kaattari IM, Zwollo P, Kaattari SL, Plasmablast and Plasma Cell Production and Distribution in Trout Immune Tissues, The Journal of Immunology 173(12) (2004) 7317–7323. [DOI] [PubMed] [Google Scholar]
- [37].Xu Z, Parra D, Gomez D, Salinas I, Zhang YA, von Gersdorff JL, Heinecke RD, Buchmann K, LaPatra S, Sunyer JO, Teleost skin, an ancient mucosal surface that elicits gut-like immune responses, Proc.Natl.Acad.Sci.U.S.A 110(32) (2013) 13097–13102. [DOI] [PMC free article] [PubMed] [Google Scholar]
- [38].Xu Z, Takizawa F, Parra D, Gomez D, von Gersdorff Jorgensen L, LaPatra SE, Sunyer JO, Mucosal immunoglobulins at respiratory surfaces mark an ancient association that predates the emergence of tetrapods, Nat Commun 7 (2016) 1–14. [DOI] [PMC free article] [PubMed] [Google Scholar]
- [39].Hamuro K, Suetake H, Saha NR, Kikuchi K, Suzuki Y, A Teleost Polymeric Ig Receptor Exhibiting Two Ig-Like Domains Transports Tetrameric IgM into the Skin, The Journal of Immunology 178(9) (2007) 5682–5689. [DOI] [PubMed] [Google Scholar]
- [40].Rombout JH, van der Tuin SJ, Yang G, Schopman N, Mroczek A, Hermsen T, Taverne-Thiele JJ, Expression of the polymeric Immunoglobulin Receptor (pIgR) in mucosal tissues of common carp (Cyprinus carpio L.), Fish Shellfish Immunol 24(5) (2008) 620–8. [DOI] [PubMed] [Google Scholar]
- [41].Zhao X, Findly RC, Dickerson HW, Cutaneous antibody-secreting cells and B cells in a teleost fish, Dev.Comp Immunol 32(5) (2008) 500–508. [DOI] [PubMed] [Google Scholar]
- [42].Findly RC, Zhao X, Noe J, Camus AC, Dickerson HW, B cell memory following infection and challenge of channel catfish with Ichthyophthirius multifiliis, Dev Comp Immunol 39(3) (2013) 302–11. [DOI] [PubMed] [Google Scholar]
- [43].Lange MD, Beck BH, Brown JD, Farmer BD, Barnett LM, Webster CD, Missing the target: DNAk is a dominant epitope in the humoral immune response of channel catfish (Ictalurus punctatus) to Flavobacterium columnare, Fish.Shellfish.Immunol 51 (2016) 170–179. [DOI] [PubMed] [Google Scholar]
- [44].Lange MD, Webster CD, The effect of temperature on the mucosal IgM antibody response to DNP-KLH in channel catfish (Ictalurus punctatus), Fish Shellfish Immunol 70 (2017) 493–497. [DOI] [PubMed] [Google Scholar]