Abstract
In the last decade, there has been a surge in the number of academic research groups and commercial companies exploiting naturally occurring cosmic-ray muons for imaging purposes in a range of industrial and geological applications. Since 2009, researchers at the University of Glasgow and the UK National Nuclear Laboratory (NNL) have pioneered this technique for the characterization of shielded nuclear waste containers with significant investment from the UK Nuclear Decommissioning Authority and Sellafield Ltd. Lynkeos Technology Ltd. was formed in 2016 to commercialize the Muon Imaging System (MIS) technology that resulted from this industry-funded academic research. The design, construction and performance of the Lynkeos MIS is presented along with first experimental and commercial results. The high-resolution images include the identification of small fragments of uranium within a surrogate 500-litre intermediate level waste container and metal inclusions within thermally treated GeoMelt® R&D Product Samples. The latter of these are from Lynkeos' first commercial contract with the UK National Nuclear Laboratory. The Lynkeos MIS will be deployed at the NNL Central Laboratory facility on the Sellafield site in Summer 2018 where it will embark upon a series of industry trials.
This article is part of the Theo Murphy meeting issue ‘Cosmic-ray muography’.
Keywords: muography, cosmic-ray muons, muon tomography
1. Introduction
(a). Cosmic-ray muography
Muons are fundamental, charged particles that form part of our naturally occurring background radiation. They are produced in particle showers in the upper atmosphere from the impact of cosmic rays. These muons are incident at sea level at a rate of one per square centimetre per minute and with average energies of 3 GeV, approximately four orders of magnitude that of typical X-rays. This allows them to penetrate thick shielding and in addition to their high energies, muons are highly penetrating and can traverse kilometres of rock, which has opened up the possibility to use them for challenging imaging applications.
The absorption of naturally occurring cosmic-ray muons was first used to investigate complex structures over 60 years ago by British physicist E. P. George when he determined the burden of ice above a mining tunnel in Australia [1]. Fifteen years ago, researchers at Los Alamos National Laboratory demonstrated that the Coulomb-scattering of the muon could be exploited to identify high-density, high-atomic number (Z) material within large, shielded transport containers [2]. Since this discovery, the non-destructive testing field of cosmic-ray muography has developed and, in recent years, has experienced an exponential growth with more than 40 research groups and projects active in over 20 countries throughout the world. At the height of this activity last year, the field achieved widespread attention with the publication of the high-profile measurements from within the great Pyramids of Egypt that indicated the presence of a previously unknown chamber [3].
In recent years, half a dozen companies have formed to commercialize muography imaging technology for a variety of different applications including nuclear contraband detection for national security, Brownfield mineral exploration and nuclear waste characterization. It is this latter industrial application that is the subject of this current work by researchers at the University of Glasgow and its spin-out company Lynkeos Technology Ltd.
(b). Nuclear waste
A major challenge for the global nuclear industry is to process and safely store legacy, current and future nuclear waste. In the UK, the decommissioning programme is estimated to cost in the region of £100 billion over the next century and up to £10 billion in the next 5 years alone. Globally, the nuclear decommissioning market is in the region of £250 billion. One of the most complex challenges for the industry is to characterize the contents of shielded waste containers. These highly engineered structures have been designed to prevent the radiation stored within from escaping out into the environment, which therefore makes the use of conventional imaging techniques using similar radiation such as X-rays and gamma rays difficult, if not impossible. Previous work presented by the authors [4–6] has shown muography to be a viable solution to this challenge, one that has the potential to improve waste classification and significantly reduce storage costs.
The primary focus of the authors' research has been the passive inspection of 500-litre stainless-steel intermediate level waste (ILW) drums as shown in figure 1. At present, there are many tens of thousands of these drums in long-term storage in the UK alone, containing cladding material stripped from uranium fuel rods encapsulated within concrete grout. Recent observations suggest that an unknown proportion of this inventory may contain fuel fragments. The natural expansion of these decaying uranium fragments over time may threaten the containment of this waste form, resulting in a radiation release into the local environment. The ability to identify fragments of fuel within a drum can mitigate the risks associated with containment breaches, which would mandate a large-scale decontamination and repackaging programme at significant expense to the Taxpayer.
Figure 1.
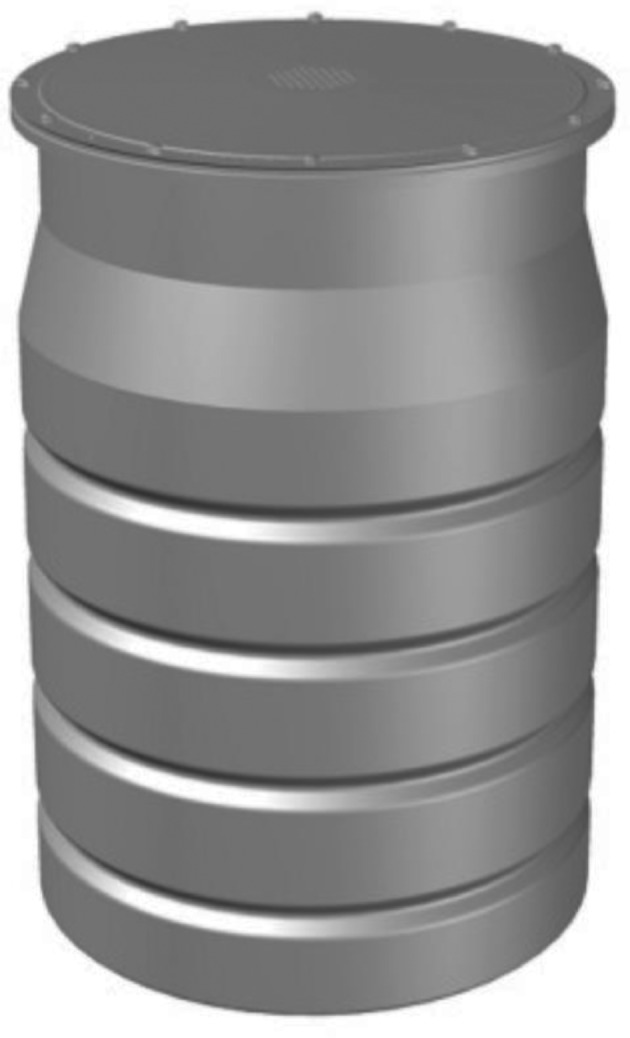
A three-dimensional CAD model of a 500-litre ILW drum.
(c). Background research
In 2009, the Nuclear Physics group at the University of Glasgow, working alongside the UK National Nuclear Laboratory (NNL), performed initial feasibility studies to assess the potential of using cosmic-ray muons to image high Z material, e.g. uranium, within stainless-steel, concrete-filled drums. This was the first phase in a 7-year project funded with £4.8 million from the UK Nuclear Decommissioning Authority (UK NDA) and Sellafield Ltd. A small-scale prototype muon tomography system was designed and developed using scintillating fibre and multi-anode photomultiplier tube (MAPMT) technologies. This system comprised four muon tracker modules, two positioned above the container and two below. Each detector module contained two orthogonal layers of 128 2 mm-pitch Saint-Gobain BCF12 plastic scintillating fibres creating a Cartesian grid of 16 384 possible muon interaction points per module. This system had an imaging volume of approximately one cubic foot. Each fibre was multiplexed to a unique position on a 64-channel Hamamatsu H8500A MAPMT with two fibres coupled to detector pixel and decoupled in software. The modular construction, external support structures and readout electronics are all described in [4], along with the first results reconstructed from a test set-up containing different materials within air, including a small 20-mm-diameter, 30-mm-long cylinder of uranium metal and a 40-cm cube of lead. Subsequent studies, published in [6], validated the technology's ability to identify these same objects embedded within a 20 mm-thick stainless-steel, cement-filled drum with sub-centimetre resolution in the horizontal plane.
Subsequent funding from the UK NDA enabled the scale-up of this technology and the development of a full-scale Demonstrator Muon Imaging System (MIS) at the University of Glasgow. The size of this system was designed to accommodate a 500-litre ILW drum within its 1.5 m3 imaging volume. This system was commercialized by Lynkeos Technology under a £1.6 million First of a Kind Deployment of Innovation contract from Innovate UK.
This work will detail the design, construction and performance of the Lynkeos MIS that was developed as part of a 7-year industry-funded research and development project at the University of Glasgow and commercialized by Lynkeos Technology. The hardware and software systems of this commercial offering will be described and first experimental results from the technology using surrogate waste containers will be presented. Finally, the first commercial results from an imaging campaign on a new thermally treated waste form are presented.
2. Lynkeos Muon Imaging System
The Lynkeos Muon Imaging System is shown in figure 2. This commercial system was commercialized as part of the Innovate UK First of a Kind Deployment of Innovation contract undertaken between April 2017 and March 2018. The core system, constituent technologies and materials are similar to the Demonstrator MIS at the University of Glasgow, which has been used to produce the images shown later in this manuscript. The construction techniques are described in [4] and described here where different.
Figure 2.
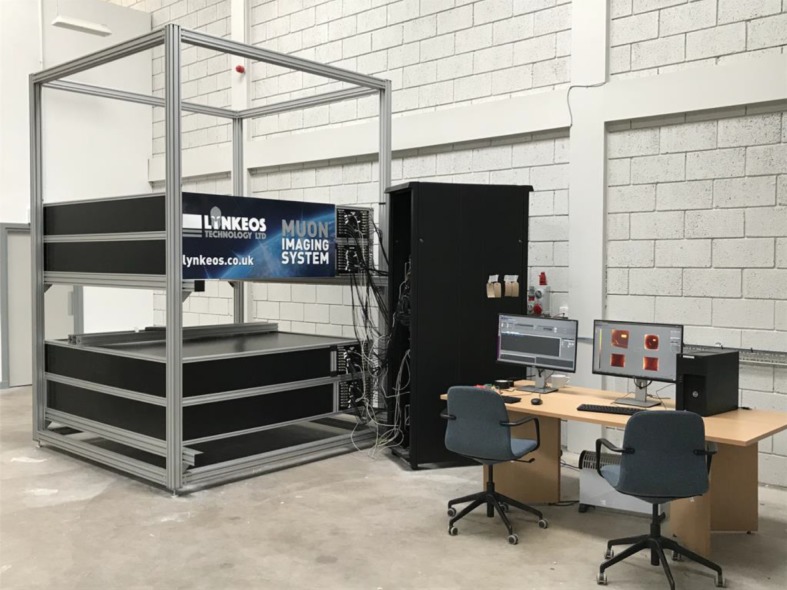
The Lynkeos MIS installed at the Lynkeos Technology fabrication facility. (Online version in colour.)
As with the small-scale prototype, the MIS consists of two detector modules above the imaging volume and two below to be able to reconstruct the incoming and Coulomb-scattered muon vectors, respectively. Whereas each detection plane in the small-scale system consisted of a single layer of 2-mm-pitch Saint-Gobain BCF12 plastic scintillating fibres in orthogonal directions, the MIS has two overlapping layers of fibres in each direction such that the bottom layer forms the support for the top layer. With 512 fibres in each layer, a total of 1024 fibres form each detection layer, e.g. each x-direction layer, resulting in a total of 1 048 576 possible muon interaction points per module. The active area of the system is approximately 1066 mm × 1066 mm. The base layer of fibres in the x- and y-directions is optically bonded to a specially machined piece of Rohacell® foam. This sheet is precision machined to produce orthogonal rows of 512 V-shaped grooves of pitch 2.08 mm on the top and bottom surfaces.
Each fibre is coupled to a pixel on a 64-channel Hamamatsu H12700A MAPMT, which superseded the H8500A model, again with two fibres per pixel that are decoupled in software. Scintillation light produced in the fibres is detected by these MAPMTs. Each module has 16 MAPMTs, which are operated at a gain of approximately 106.
The aggregate signal from the MAPMT dynode 10 stage is used in the trigger pathway. The signal from each MAPMT is amplified before being fed into a low threshold discriminator. If the signal passed the threshold, it formed an input to the trigger logic, implemented onto an FPGA. The input signals are grouped into eight-layer signals, corresponding to the x- and y-direction layer in each module. An OR of these signals is taken, the output of which is combined with an AND and an OR layer mask (these masks allow the user to select which layers must have registered a muon hit) to generate a trigger signal.
The 64 individual pixel signals for each MAPMT are read out by a MAROC 3A ASIC. The MAROC chip is incorporated into an FPGA controlled readout system designed by INFN Genoa. Upon receipt of a trigger signal, the FPGA reads the MAPMT data in the MAROC and stores it in a register ready for readout over USB by the DAQ software.
The framework and support structures of the detector are all constructed from Bosch-Rexroth aluminium profiling. This profile is shown in figure 3 with a 500-litre ILW drum, aluminium alloy pallet and all internal and external module components removed.
Figure 3.
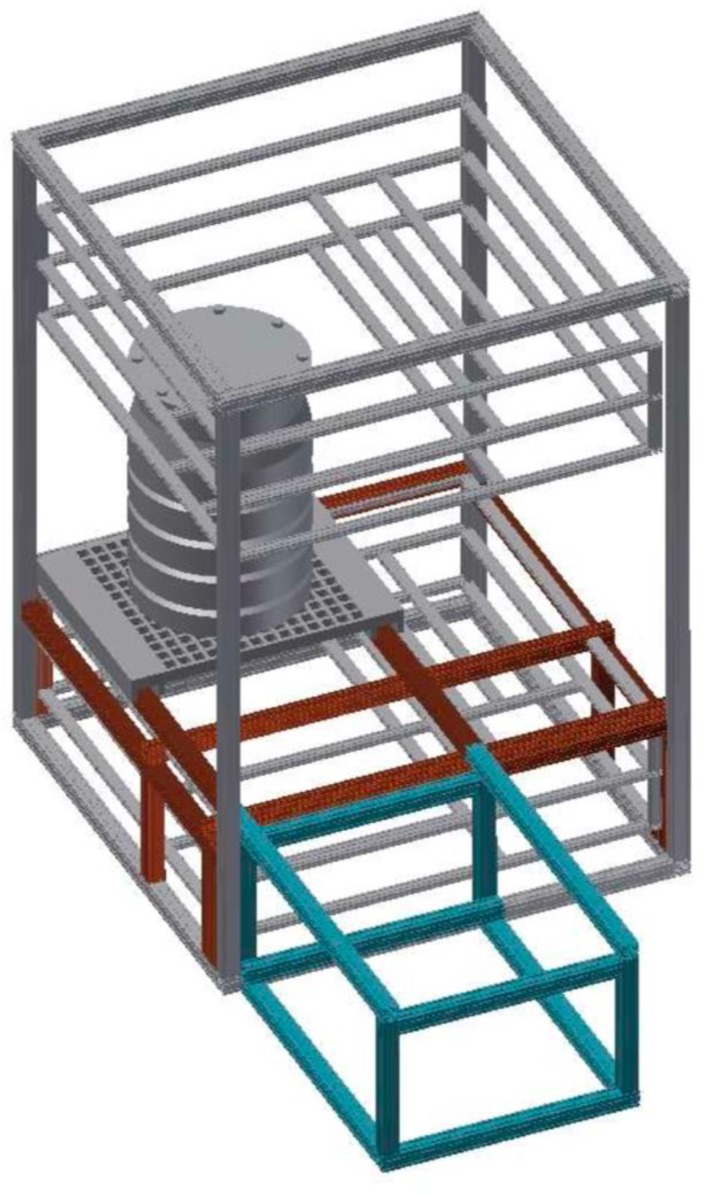
A three-dimensional CAD model of the aluminium profile used in the Lynkeos MIS. Shown are the module frames (with all internal and lightproof components removed), a 500-litre ILW drum, the aluminium pallet, external loading table (blue) and internal support table (red).
A heavy-duty gravity roller conveyor track is fixed to the external table (pictured in blue) and its continuation into the internal table (shown in red) to allow the pallet (made from 6082 Aluminium) to be loaded with the object and then slid into the position over the active area. Each module is encased in a 30 mm aluminium profile frame measuring 2.0 m × 2.0 m × 0.3 m. The module interior is made lightproof with 8 mm sheets of black Palight™ foam PVC that is precision cut to fit into all six frame sides (as seen in figure 2). One patch on each module has been machined and fitted with connectors for the HV, LV, USB and signal cables that are connected to the electronics rack. The four modules are installed within an 80 mm × 80 mm aluminium profile support frame with the height of the top module pair adjustable to accommodate containers of different vertical dimensions.
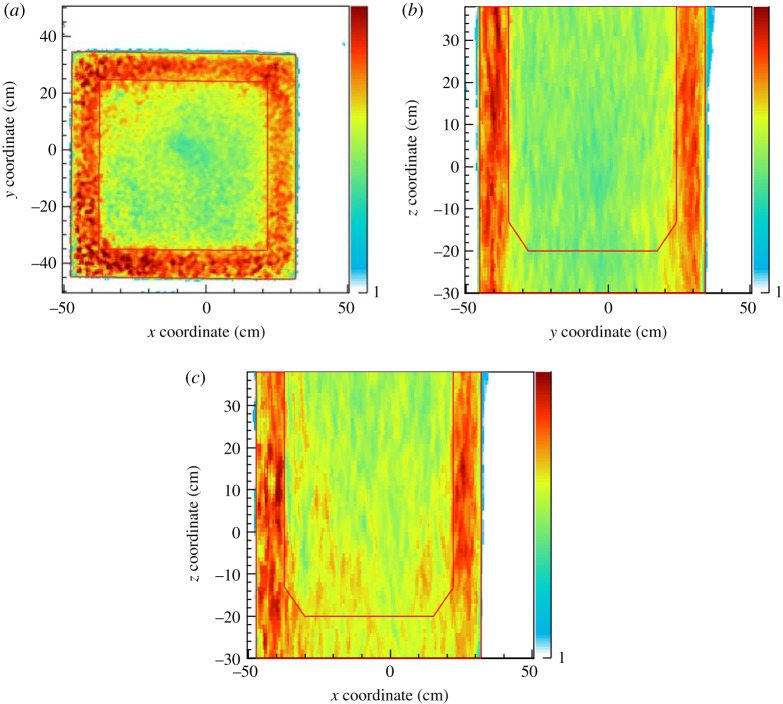
The constructed system was extensively commissioned prior to, and optimized during, the initial imaging studies. The system was mechanically aligned to less than a centimetre precision and a final correction was applied in the analysis software. The resultant misalignment was less than a half fibre width across the active area. During the pre-imaging commissioning phase, the muon detection efficiency was studied as a percentage of triggered muon events that provide a signal in all eight detection layers. The trigger has been described previously. The resultant eight-layer efficiency was found to be approximately 92% as shown in figure 4 for over a week of continuous, stable data collection, with a single layer efficiency of 99%.
Figure 4.
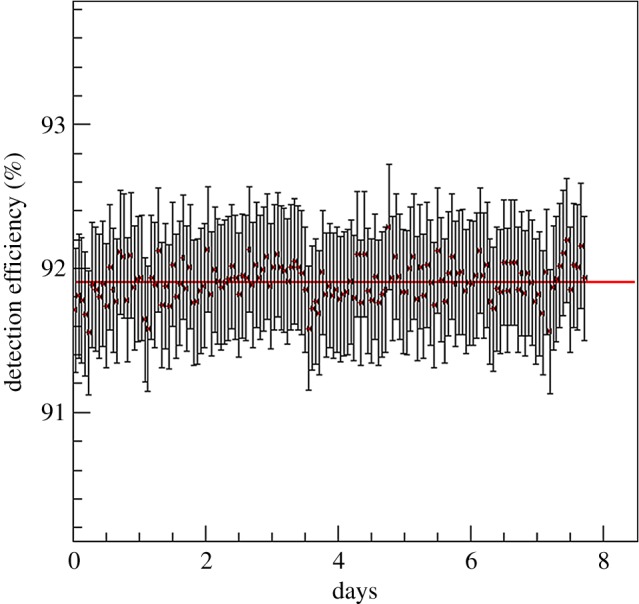
Muon detection efficiency of the MIS during commissioning. An average efficiency of almost 92% was observed with a high degree of stability. (Online version in colour.)
3. Results
The reconstructed results shown in this section are presented in the form of two-dimensional images. The colour palette metric used relates to the atomic number and density of the material encountered by the muon sample within each volume element. All data analysis software and image reconstruction techniques are described in [4], with minor modifications to account for the data acquisition event structure and bi-layer of fibres.
(a). Experimental imaging
Since the completion of the Demonstrator MIS construction in 2015, a series of imaging tests have been performed to validate the technology and to optimize the image reconstruction algorithms. This work will detail the results from two such validation studies on industry-provided drums containing nuclear fuel surrogate materials: the Sellafield Demonstration Top Hat and the Lillyhall 500-litre ILW Drum. Initial imaging results using a series of lead blocks in air are presented in [7] alongside detailed discussion of the image reconstruction algorithms used to perform these analyses.
(b). Sellafield Demonstration Top Hat
The first blind test of the Demonstrator MIS after commissioning was performed using a so-called Top Hat container provided by the National Nuclear Laboratory on behalf of Sellafield Ltd. This 20 mm-thick stainless-steel drum, shown within the Demonstrator MIS in figure 5, measured 300 mm in diameter and 550 mm in height and was filled with different layers of surrogate waste material to simulate different waste storage scenarios. This Top Hat was not fabricated for the purposes of muographic analysis; however, its thick casing and concreted contents provided an ideal blind test of the MIS. The following images were reconstructed from a high-statistics measurement totalling 26.3 million muons over a period of one month.
Figure 5.
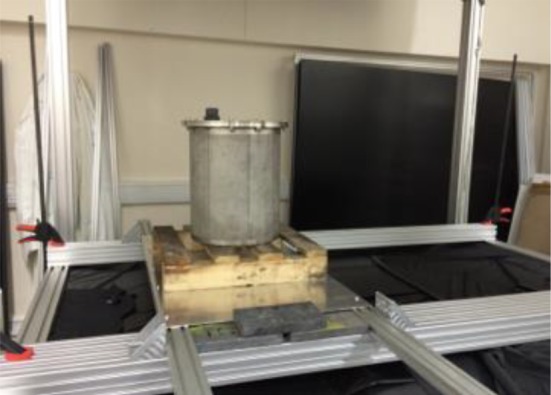
The Sellafield Demonstration Top Hat within the Demonstrator MIS during data collection. (Online version in colour.)
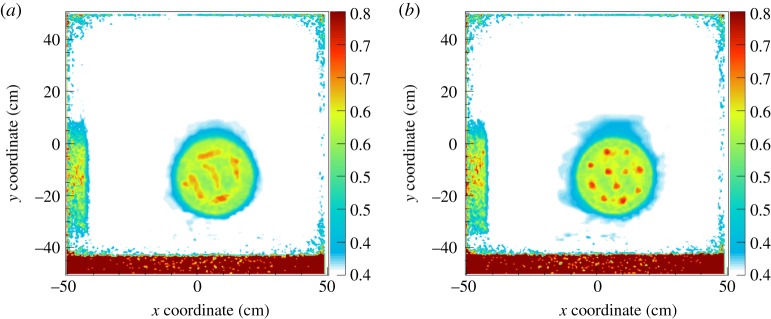
The results reconstructed from these data are shown in figure 6. The two 10 mm horizontal slices are taken through layers later found to contain sections of a steel reinforcement bar embedded in concrete (left) and eleven 10 mm-thick, 25 mm-diameter tungsten pennies (right) surrounded in molybdenum powder and embedded in concrete. From the results within the steel bar region, there is evidence of five roughly equal-sized portions within the concrete matrix along with a smaller segment on the left of the drum. The regions of thicker molybdenum powder manifest as lower-density shadows around the tungsten. The high-density band at the bottom of the images is the artefact of a faulty MAPMT readout card that has since been repaired. The object on the left of the image is part of the support structure.
Figure 6.
A 10 mm horizontal slice reconstructed through the Top Hat in the region of the sectioned steel reinforcement bar (a) and the tungsten pennies (b). The results are discussed in the text.
(c). Lillyhall 500-litre ILW Drum
As part of the Innovate UK contract programme of work, Lynkeos Technology took delivery of this development drum from the Lillyhall storage facility in Cumbria. This drum had previously had a quadrant removed for display purposes. Four horizontal cores of diameter 60 mm were taken through one of the open faces at different heights and two similar vertical cores were removed to allow for the insertion of different material standards to perform a final validation of the technology on the intended industrial application. This drum is shown in figure 7 prior to and during installation within the Demonstrator MIS. The random distribution of the magnesium oxide (Magnox) fuel cladding is encased within the concrete grout matrix within the 3-mm-thick stainless-steel casing. The location of the six cores is clearly visible.
Figure 7.
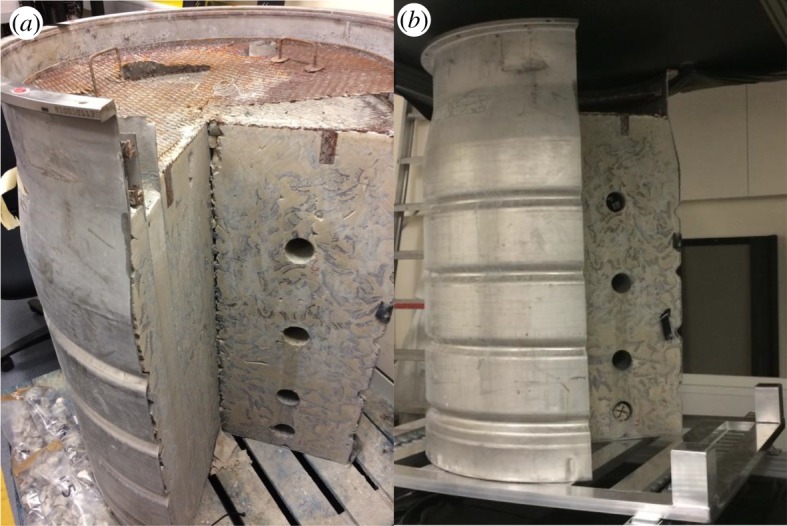
Photographs of the Lillyhall 500-litre ILW drum prior (a) and during (b) installation in the Demonstrator MIS. Shown are the four 60 mm-diameter horizontal cores. The two vertical cores are not pictured. (Online version in colour.)
For the purposes of this validation, the same uranium sample used in previous studies [4,6] was placed in the bottommost horizontal core. This 20 mm-diameter, 30 mm-long cylinder was placed in an upright position within the core. In the uppermost core, a configuration of lead pieces, measuring approximately 90 mm × 40 mm × 20 mm, was inserted. A total of 24.7 million muons were collected for this analysis.
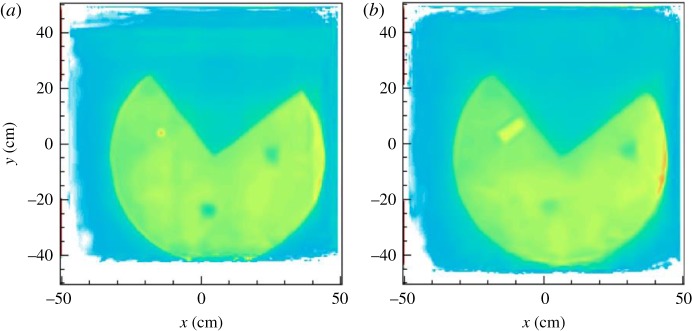
The high-resolution imaging results of this drum are shown in figure 8. Shown are two 10 mm horizontal slices through the drum in the region of the uranium and lead samples. In both slices, the circular contour of the drum is clearly visible along with the location of the two vertical cores. Subtle density variations are observed within the concrete and magnesium oxide matrix. In the uranium image, the high Z cylinder has been reconstructed within the core in the open face with the correct 20 mm diameter. The shadow of the aluminium pallet and table on which the barrel is supported can also be seen. In the other slice taken from the upper half of the drum, the rectangular arrangement of lead was successfully reconstructed in the same location with a lower density to the uranium as expected.
Figure 8.
A 10 mm horizontal slice through the Lillyhall 500-litre ILW drum in the region of a uranium cylinder (a) and lead pieces (b). The images are described in the text.
In both slices, there is evidence of high-density material accumulating around the right-hand side wall of the drum. However, this anomaly is present due to noisy readout channels in the final x-axis MAPMT on the second detector module that results in a higher-than-normal (i.e. false) detection rate of a muon, which, due to the data structure and analysis chain at the time of this study, could not be removed in offline analysis or imaging post-processing. This has, however, been remedied for future analyses, e.g. the GeoMelt® campaign described later.
(d). Commercial imaging
In November 2017, Lynkeos Technology embarked upon its first commercial imaging campaign for the UK National Nuclear Laboratory, paid for by Sellafield Ltd. The subject of this series of studies was three R&D Product Blocks produced under UK NDA funded research using a new thermal waste treatment process. The GeoMelt® In-Container Vitrification (ICV)™ process, owned by Veolia Nuclear Services, is being piloted at the NNL Central Laboratory facility on the Sellafield site in Cumbria in North West England. GeoMelt® vitrification destroys organic wastes and immobilizes radionuclides and heavy metals, such as those found within conventional ILW, in a stable glass waste form. Prior to melting, waste material is loaded into an aluminium silicate crucible that also serves as the long-term storage container after vitrification. Granulate sodium borosilicate glass is added along with an accelerant on the top surface. Four carbon electrodes are lowered into the mixture at the corners to vitrify the sample.
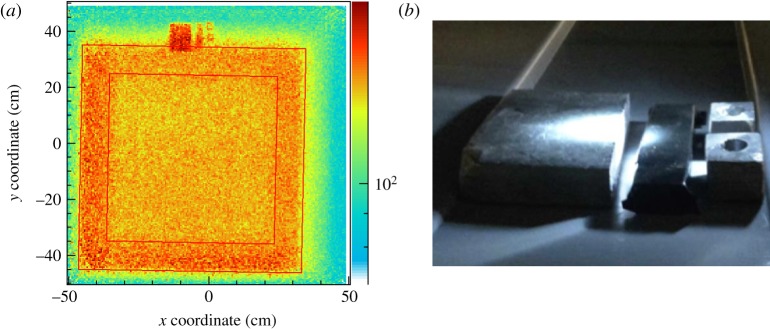
Three GeoMelt® samples (here, labelled A, B and C) have been successfully imaged using Lynkeos' Demonstrator MIS at the University of Glasgow. Figure 9 shows one of the samples loaded into the active volume of the system within its thin plastic transport box. The results from the passive analysis of each sample are presented in the following subsections. As stipulated by the customer, an image resolution of less than 10 mm (in particular in the ability to discern between two objects separated by this distance) was required in the final reconstruction. To demonstrate compliance with this satisfaction criteria, a series of lead objects was placed on top of the plastic transport box, each spaced 10 mm apart. The validation of this capability is shown in figure 10. The four different blocks are discerned. In this image, the 8 mm-diameter holes in the smaller lead pieces are visible even in the low-statistic region at the edge of the MIS acceptance. An image resolution of less than 5 mm was observed in the horizontal plane.
Figure 9.
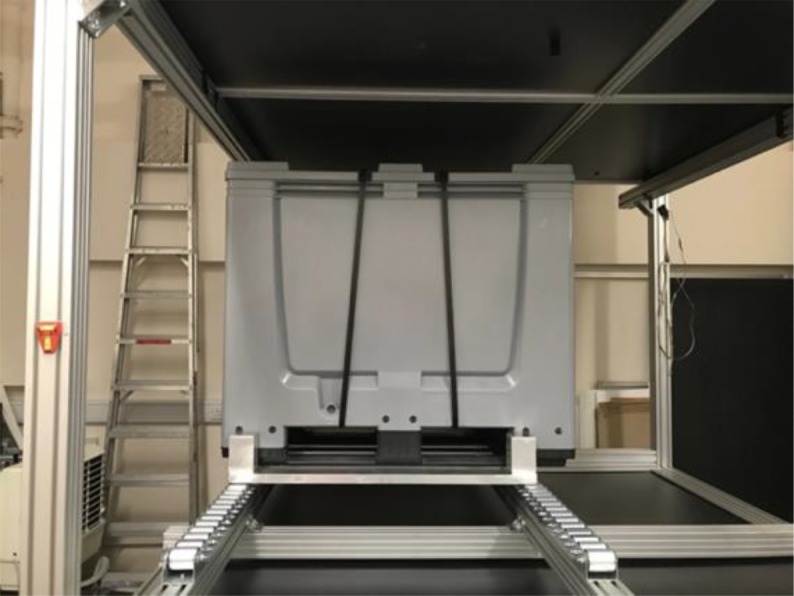
A GeoMelt® sample installed in the Demonstrator MIS imaging volume inside its plastic transport box. (Online version in colour.)
Figure 10.
Image reconstructed in the region of the lead validation samples (a), which are pictured on top of the transport box (b). The image is described in the text.
(e). GeoMelt® sample A
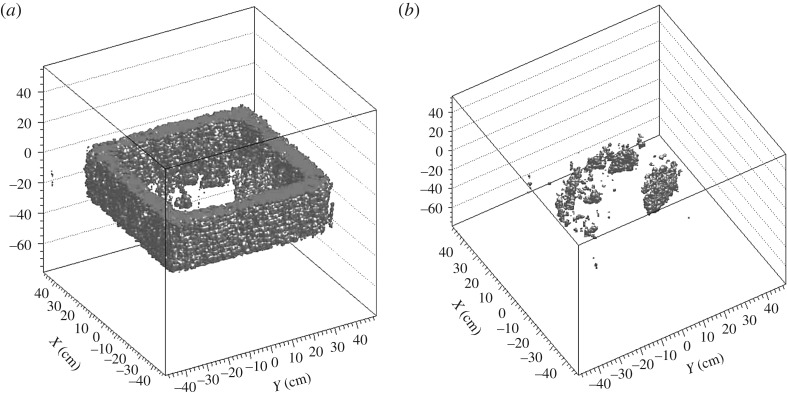
A total of 21.3 million muons were collected for the first sample in the imaging campaign with an average trigger rate of 8.9 Hz. The Demonstrator MIS operated stably for the duration of the collection period with a muon detection efficiency of 90%. Figure 11 shows a 10 mm horizontal slice through the sample in the region 50 mm above the base of the aluminium silicate crucible. The crucible is positioned within the transport box at an angle of approximately 2°. The 100 mm walls are reconstructed with a higher-than-expected density due to the large thickness. This is an inherent problem with muographic scattering reconstruction. Within the glass volume, there is evidence of a large metallic inclusion on the right-hand side.
Figure 11.
Reconstructed results from sample A imaging. Shown are a 10 mm horizontal slice (a) and a 5 mm vertical slice (b) through the sample. These results are described in the text.
The reconstructed density is consistent with stainless steel and was later determined to be the 20 mm-thick lid of a Top Hat container, similar to that shown in figure 6, which was the subject of this melt. A collection of smaller metallic inclusion or regions of higher-density glass are present anticlockwise from top right and may be a result of convection during the vitrification process. These may represent the contents of the Top Hat or part of its walls that were not melted. Despite the presence of inclusions, this sample represents a successful melt. In the corners of the glass volume, four lower-density circular regions corresponding to the electrode locations have been identified. Note that the thin plastic transport box, pictured in figure 9, is transparent to muons. Figure 11 also shows a 5 mm vertical slice through the stainless-steel inclusion and reveals its location in the vertical axis. This result shows characteristic smearing of the reconstructed image in the vertical direction, which is another common problem associated with the small-angle scattering of the muon and the resulting challenge of reconstructing the scattering location of two near parallel partial tracks. For these reasons, the base of the low-density aluminium silicate crucible is not visible. To be able to observe this, a larger acceptance detector would be required.
As part of the first investigation of this application, dedicated studies were performed to optimize the analysis. A metric called ‘homogeneity’ was defined as the percentage of volume elements that contained a value that was four-sigma in a Gaussian distribution above the average value for sodium borosilicate. This yielded a maximum homogeneity for this sample of 96%. Figure 12 shows a simple three-dimensional rendering of the crucible for all volume elements that were deemed to contain inhomogeneities (i.e. all glass volume elements removed), both with and without the aluminium silicate crucible walls.
Figure 12.
Simple three-dimensional rendering of the sample A results with all sodium borosilicate volume elements removed. (a) The crucible walls are visible and (b) the metallic inclusions within the glass. The results are described in the text.
(f). GeoMelt® sample B
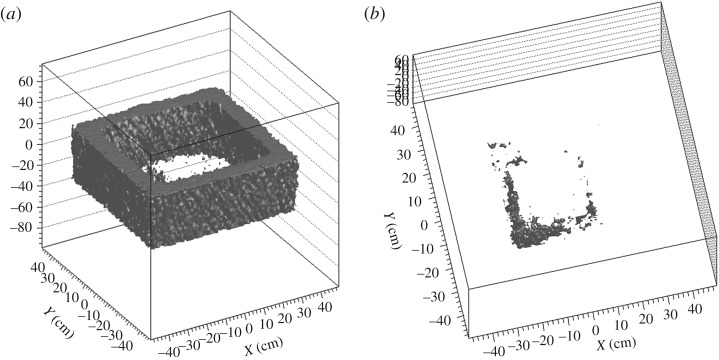
For sample B, a total of 17.2 million muons (20% less than sample A) were collected with the same data rate, stability and efficiency as for sample A. The results from this analysis are shown in figures 13 and 14, which are also in the same format as for the previous sample. There is clear evidence of a rectangular steel object inside this vitrified product, with smaller debris accumulating on the left and bottom regions of the horizontal slice. A homogeneity of 97% was deduced from this study.
Figure 13.
Reconstructed results from sample B imaging. Shown are a 10 mm horizontal slice (a) and a 5 mm vertical slice (b) through the sample. These results are described in the text.
Figure 14.
Simple three-dimensional rendering of the sample B results with all sodium borosilicate volume elements removed. (a) The crucible walls are visible and (b) the metallic inclusions within the glass. The results are described in the text.
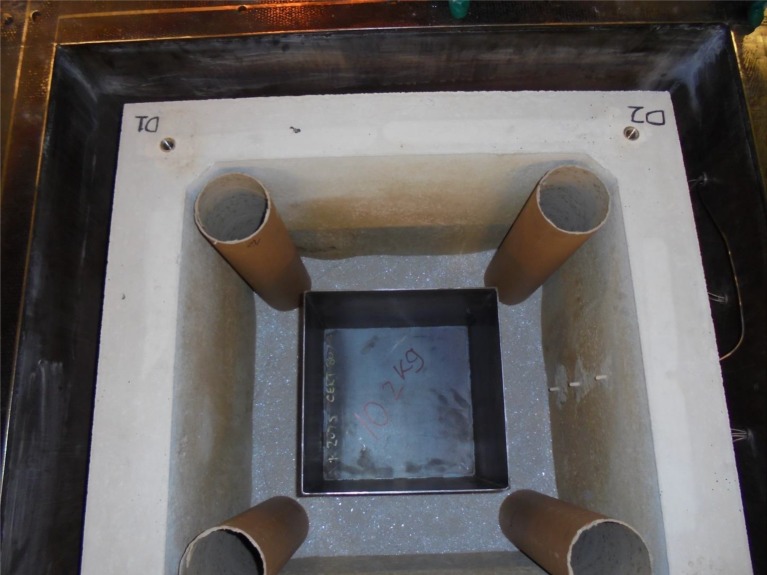
Subsequently, the object was revealed to be a steel waste skip that was loaded into the crucible prior to melting. This is shown in figure 15, which also shows the crucible, the positions that the electrodes are lowered into and a partial fill of glass.
Figure 15.
Photograph showing the contents of sample B prior to vitrification. Shown are the steel skip and the positions that the electrodes are loaded into. (Online version in colour.)
(g). GeoMelt® sample C
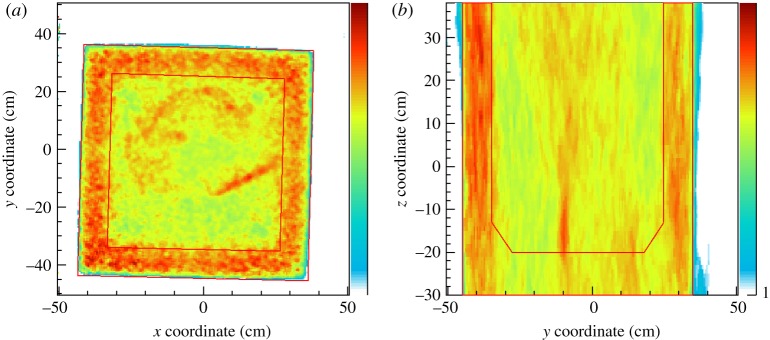
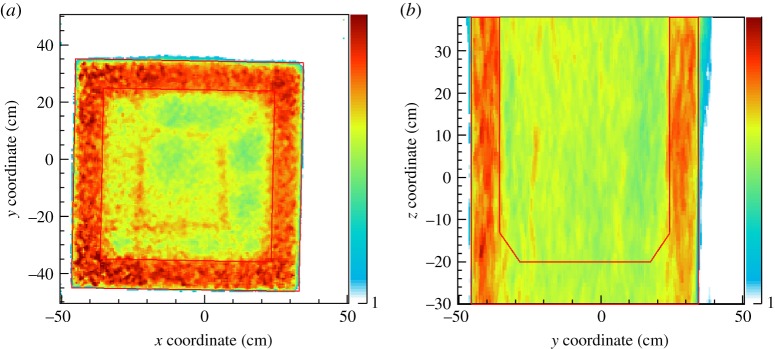
For the final sample, 10.6 million muons (50% of the sample A dataset) were collected using the Demonstrator MIS. No significant inclusions were detected as can be seen from figure 16. The sodium borosilicate glass volume was found to be up to 98% homogeneous with the inhomogeneities isolated in the top-left quadrant of the sample.
Figure 16.
A 10 mm horizontal slice through the crucible (a) and 5 mm vertical slices through the middle of the crucible (b) and through the region near the walls that contain inclusions (c). The results are described in the text.
4. Conclusion
The Lynkeos MIS is the first commercial system of its kind in the world. This muographic system uses the Coulomb-scattering property of cosmic-ray muons to passively image the contents of shielded nuclear waste containers. This system was developed over a 7-year period at the University of Glasgow with significant funding from the UK Nuclear Industry and commercialized by Lynkeos Technology as part of an Innovate UK contract. The Lynkeos MIS uses scintillating fibre and MAPMT technology to track the position of the muons as they pass through the waste drum, primarily 500-litre ILW containers.
This manuscript presented the first high-resolution three-dimensional images from within these containers during an industry validation study. The presence of a small sample of uranium metal was identified within this thick, concrete-filled drum. Results from the first commercial imaging campaign were presented. Images from within three samples of a new thermal treatment process called GeoMelt® revealed the vast potential to passively inspect the homogeneity of the produced glass waste form and to identify small metallic inclusions within to unrivalled precision.
This innovative inspection technique has huge potential to play a vital role in the decommissioning of UK nuclear sites and the characterization of legacy waste, both concreted and vitrified forms. With the first commercial system being deployed in 2018 at the Sellafield site, it is anticipated that this technology will help increase safety of storage of waste containers and reduce the risks associated with the long-term storage of materials of this nature. The cost to the Taxpayer will also be reduced with the deployment of this First of a Kind system.
Acknowledgements
Colleagues involved with the GeoMelt® pilot programme at the UK National Nuclear Laboratory and technical staff at the University of Glasgow have contributed to the research presented in this manuscript.
Data accessibility
Owing to the commercial sensitivity of the proprietary data format and image reconstruction software, both either trade secrets and the Intellectual Property of Lynkeos Technology, the raw data from the results presented in this manuscript cannot be provided. The data related to the GeoMelt process are the property of the UK Nuclear Decommissioning Authority and have been included with their permission.
Authors' contributions
D.M. was a lead organizer for the Royal Society Theo Murphy meeting from which these proceedings arise. He is a Director of Lynkeos Technology and developed the data analysis software used in the presented analyses. He is the author of this manuscript. A.C. designed and led the construction of the Lynkeos MIS that is the subject of this manuscript. S.G. performed the data analysis of the commercial GeoMelt® results and assisted in the development of the commercial MIS. D.I. is a Principal Investigator of the research contract that funded the staff at the University of Glasgow during UK NDA and Innovate UK/Lynkeos funding. R.J. developed the electronics system for the Lynkeos MIS. R.K. is a Managing Director of Lynkeos Technology and project managed the Innovate UK and commercial contracts and that these results originated from. M.R. was subcontracted to Lynkeos Technology during the period spanning these results and developed the data acquisition and 3D visualization systems for the MIS. C.S. project managed the research programme at the University of Glasgow during UK NDA funding. G.Y. developed the 3D image reconstruction software and performed the data analyses presented in this manuscript. All authors read and approved the manuscript.
Competing interests
The authors declare that they have no competing interests. However, as four of the five referees are co-authors of this manuscript, this has been sent to the independent fifth referee for impartial peer review.
Funding
During the research periods covered in this manuscript, the following sources of funding were contributed:
D.M. (UK NDA, STFC and Scottish Enterprise/Royal Society of Edinburgh); A.C. (UK NDA, STFC and Innovate UK/Lynkeos); S.G. (STFC and Innovate UK/Lynkeos); D.I. (UK NDA, STFC and Innovate UK/Lynkeos); R.J. (UK NDA, STFC and ESS); R.K. (UK NDA, Innovate UK/Lynkeos and IAEA); M.R. (UK NDA, Innovate UK/Lynkeos and NNL); C.S. (UK NDA, Innovate UK/Lynkeos and NNL); G.Y. (UK NDA, STFC and Innovate UK/Lynkeos).
Disclaimer
The data shown in relation to the commercial imaging service for the GeoMelt process are owned by the UK NDA and should not be reproduced. All other data and images presented in this manuscript are the property of Lynkeos Technology and should not be used without the permission of the corresponding author.
References
- 1.George EP. 1955. Cosmic rays measure overburden of tunnel. Commonwealth Engineer, July 1, 455–457. [Google Scholar]
- 2.Borozdin K, et al. 2003. Surveillance: radiographic imaging with cosmic-ray muons. Nature 422, 277 ( 10.1038/422277a) [DOI] [PubMed] [Google Scholar]
- 3.Morishima K, et al. 2017. Discovery of a big void in Khufu's Pyramid by observation of cosmic-ray muons. Nature 552, 386–390. ( 10.1038/nature24647) [DOI] [PubMed] [Google Scholar]
- 4.Clarkson A, et al. 2014. The design and performance of a scintillating-fibre tracker for the cosmic-ray muon tomography of legacy nuclear waste containers. Nucl. Instrum. Meth. A 745, 138–149. ( 10.1016/j.nima.2014.01.062) [DOI] [Google Scholar]
- 5.Clarkson A, et al. 2014. GEANT4 simulation of a scintillating-fibre tracker for the cosmic-ray muon tomography of legacy nuclear waste containers. Nucl. Instrum. Meth. A 746, 64–73. ( 10.1016/j.nima.2014.02.019) [DOI] [Google Scholar]
- 6.Clarkson A, et al. 2015. Characterising encapsulated nuclear waste using cosmic-ray muon tomography. JINST 10, P03020 ( 10.1088/1748-0221/10/03/P03020) [DOI] [Google Scholar]
- 7.Yang G, Clarkson T, Gardner S, Ireland D, Kaiser R, Mahon D, Jebali RA, Shearer C, Ryan M.. 2019. Novel muon imaging techniques. Phil. Trans. R. Soc. A 377, 20180062 ( 10.1098/rsta.2018.0062) [DOI] [PMC free article] [PubMed] [Google Scholar]
Associated Data
This section collects any data citations, data availability statements, or supplementary materials included in this article.
Data Availability Statement
Owing to the commercial sensitivity of the proprietary data format and image reconstruction software, both either trade secrets and the Intellectual Property of Lynkeos Technology, the raw data from the results presented in this manuscript cannot be provided. The data related to the GeoMelt process are the property of the UK Nuclear Decommissioning Authority and have been included with their permission.


