Abstract
A short description of the muon tomography demonstrator at the INFN Laboratori Nazionali di Legnaro near Padua, Italy, is given and the principal achievements owing to the data collected at that experimental facility are presented. In particular, the feasibility studies for several applications based on the muon-tomographic technology, within national and European projects, are discussed. The experimental problems and the procedures used to improve the performance are underlined. In addition, new activities and the related detector optimization are illustrated.
This article is part of the Theo Murphy meeting issue ‘Cosmic-ray muography’.
Keywords: cosmic rays, muon tomography, muon radiography, image reconstruction, maximum likelihood expectation maximization, absorption
1. Introduction
Muon scattering tomography (MST) [1] enables the exploration of large and dense volumes by using the properties of cosmic-ray muons. The scattering angle of muons σ (as projected onto a plane) has a distribution which is approximately Gaussian for particles of momentum p, with mean zero and an r.m.s. which depends on the inverse of the muon momentum, as well as the material thickness X and radiation length X0,
 |
1.1 |
Measurements of muon scattering angles allow one to reconstruct information about the radiation length or, rather, its inverse, the linear scattering density (LSD) λ=1/X0, of an unknown material. The technique requires two detectors in order to detect muons entering and leaving the inspection volume. Each detector measures the position and directionality of crossing muons.
At the INFN National Laboratory of Legnaro (LNL) near Padua, Italy, a demonstrator for the study of MST has been assembled using two spare muon detectors which were originally due to be installed in the detector barrel of the compact muon solenoid (CMS) experiment at CERN [2]. The system at LNL has been operating since 2007 and has been used to study several MST applications.
In this paper, a description of the experimental set-up is given and the results obtained with the facility are described. In particular, feasibility studies for several MST applications carried out as a result of the data collected with the demonstrator are discussed. Experimental complications which arose during the studies as well as our performance optimization procedures are outlined. Additionally, new possible applications and optimizations of the related detector are presented.
2. Experimental set-up
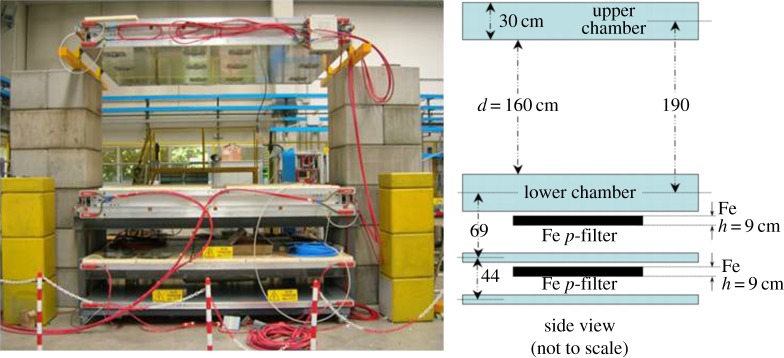
The demonstrator detector consists of two 300 cm×250 cm drift chambers (orientated horizontally), vertically separated by a distance of about 160 cm, as shown in figure 1. The chambers enclose a volume of more than 11 m3, one of the largest volumes for MST tests in the world.
Figure 1.
INFN muon tomography demonstrator.
The detectors (figure 2), which were originally produced for the CMS experiment at the Large Hadron Collider, are made up of 12 planes of rectangular drift cells grouped in three superlayers (SLs), each of which consists of four layers of cells staggered by half a cell. Each cell has a transverse dimension of 42 mm×13 mm with a central 50 μm anodic wire. The maximum path is therefore 21 mm, which corresponds to a drift time of 380 ns in an 85% Ar/15% CO2 gas mixture. In the outer SLs (SLΦ), the wires are parallel to the shortest side of the chamber, while in the inner SL (SLΘ) they are orthogonal to them. To provide mechanical stability the SLs are glued to an aluminium honeycomb plate so that the total thickness of a chamber is 30 cm. The track angular resolution is much better in the plane shown in figure 1 (the x– y-plane in our conventional reference system where y is the vertical coordinate) than in the orthogonal one (z– y-plane) as there are twice as many layers (corresponding to up to eight measured points per track), and there is also a much larger lever arm. As a consequence, the scattering angle projection on the x– y-plane (Δϕ angle) is measured with much higher precision than the projection on the z– y-plane (Δθ angle). The typical values for high-energy muons are about 300 μm for single-point position resolution and approximately 1.2 mrad and 10 mrad for Δϕ and Δθ, respectively.
Figure 2.
(a) Section of the chambers in the same plane as figure 1. Outer SLs (SLΦ) and the inner SL (SLΘ) have the wires orthogonal and parallel to the figure plane, respectively. (b) Schematic of a drift cell.
Different chamber self-triggering modes are available upon the passage of cosmic muons. The most common requires a trigger signal from the upper chamber with a reconstructed track pointing to the lower chamber. The typical trigger and acquisition rate of cosmic rays is around 350 Hz.
Two additional SLs are placed below the lower chamber and paired to 11 cm thick iron plates, as shown in figure 1. They can be used as a low-momentum filter to separate the low-energy component absorbed by iron plates from the rest of the cosmic muon spectrum. However, they were not used in the analyses presented below, mainly because they reduce the angular acceptance.
3. Material discrimination
The first important result obtained with the INFN demonstrator regarded the capability of MST to discriminate different materials [3]. Data were recorded for six blocks of different materials placed between the chambers, as shown in figure figure 3. Each block, except for the tungsten sample, is a cube with sides of length 10 cm. The W block consisted of 10 cm×10 cm×4 cm bricks.
Figure 3.
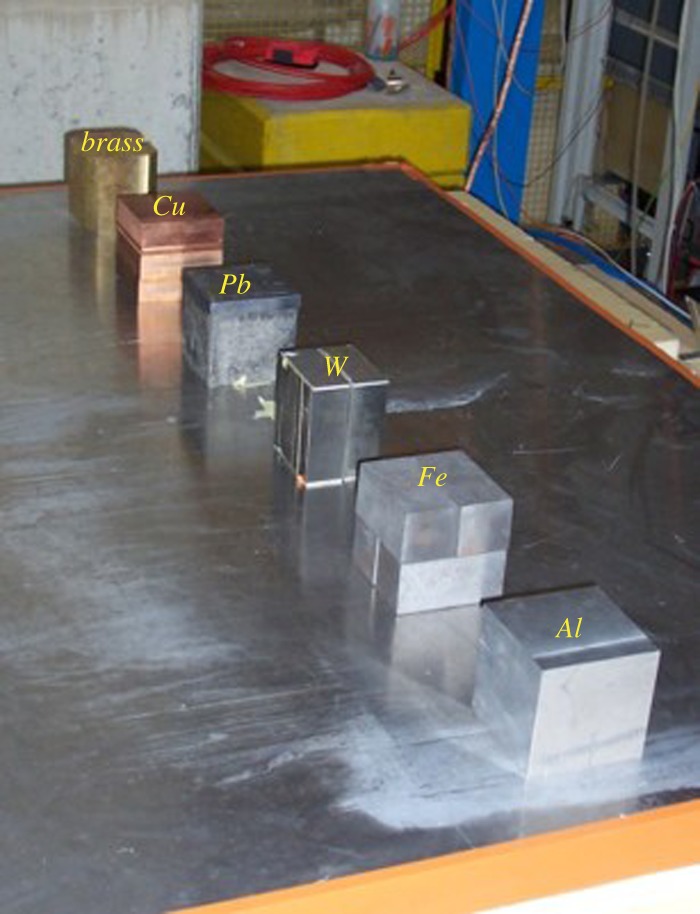
Blocks of the different materials analysed.
The measured scattering densities of the six blocks are shown in figure 4 as a function of the nominal scattering density. The reconstructed densities do not follow a linear trend but they clearly show a saturation effect. In particular, the W measured scattering density is not much larger than that of Pb. The effect is reproduced by the simulation of cosmic muons crossing the objects with the same characteristics.
Figure 4.
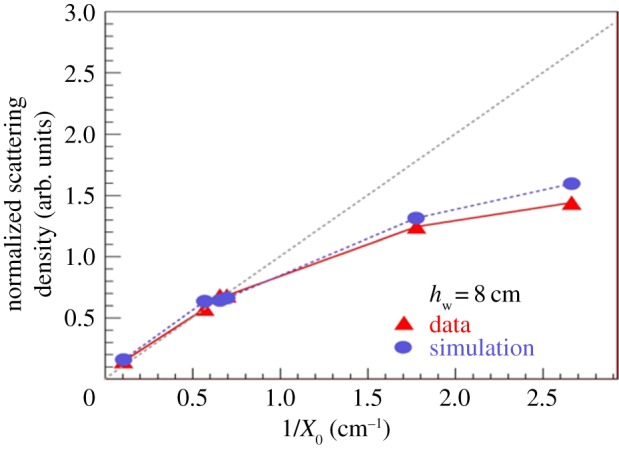
Correlation between the reconstructed scattering density and the expected value (inverse of the scattering length). The tungsten is 8 cm high while all the other samples are 10 cm high.
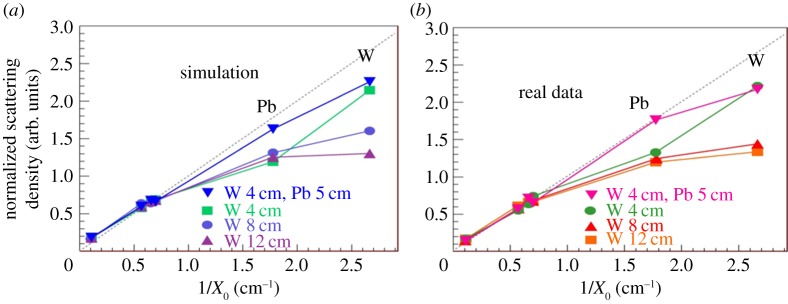
To collect more information, additional data were recorded for a block of Pb with a thickness of 5 cm, as well as blocks of W of thickness 4, 8 and 12 cm. The results shown in figure 5 indicate that the effect is related to the total thickness of the samples and this suggests that the nonlinearity is due to the absorption of the low-energy component of the muon spectrum. Indeed one should note that, in the absence of measurement of the individual muon momentum, equation (1.1) can be rewritten as
 |
3.1 |
which relates the scattering length t to the average 〈1/p2〉. However, if the low-momentum muons are absorbed when crossing the material samples, the effective momentum spectrum is modified, becoming harder for heavier materials to an extent that depends on the sample thickness. Figure 6 shows the simulated spectrum of muons crossing 10 cm of different materials. Clearly, the absorption of low-energy muons is visible, and consequently it proves that the quantity 〈1/p2〉 is dependent on the scattering length crossed by the particles. Neglecting this dependence, as is the case for the values shown in figures 4 and 5, implies that reconstructed scattering densities for heavy materials are smaller than expected.
Figure 5.
(a) Correlation between the reconstructed scattering density and the expected value for the simulated data. (b) The same correlation for real data.
Figure 6.
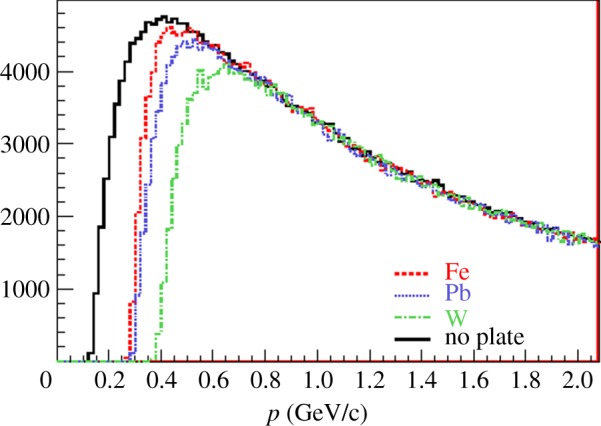
The simulated spectrum of muons crossing 10 cm of different materials.
4. Material findings
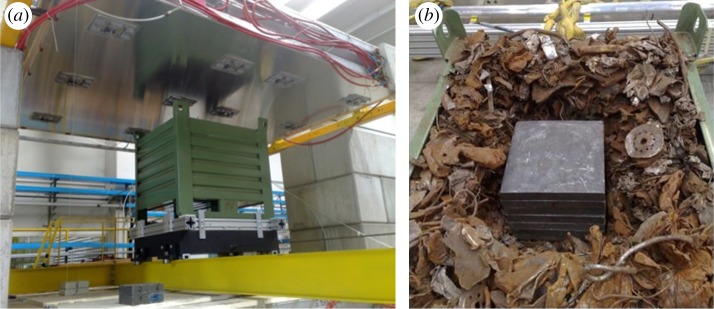
In shipment inspections and in some industrial applications, the detection of heavy materials embedded in containers is a field where MST can play an important role. In particular, all over the world, radioactive sources are sometimes present in scrap metal used for steel recycling. In most cases, these sources are detected by radiation portals present at the foundries, but in some cases, if the radiation source is shielded well by a heavy metal cask and by the scrap metal itself, they are not detected and can be melted, with serious environmental and economical consequences. A European project (MU-Steel1 ) to study a portal capable of detecting a heavy metal shield of a possible radiation source has been successfully completed. This project conducted realistic tests of such material searches using the INFN MST system. An approximately 1 m3 box filled with scrap metal was installed in the demonstrator and an approximately 12.5 l lead block was buried inside (figure 7). Two iron and two lead reference blocks were placed on the lower chamber. The reconstruction was performed with the maximum likelihood expectation maximization (MLEM) method [4,5] by dividing the volume into cubic voxels (of length 5 cm) assumed to contain a homogeneous LSD. Given the large number of variables (values of LSD in voxels) and large amount of data (scattering angle and displacement of the muon tracks), the reconstruction package, which follows an iterative procedure, required important software optimizations to keep the computing time below the data collection time. The reconstructed tomographic images clearly reproduce the set-up, as shown in figure 8.
Figure 7.
(a) Experimental set-up for material finding tests with the INFN demonstrator. The green container was filled with scrap metal and placed on the yellow support structure. (b) The lead block in the container before being buried by scrap metal.
Figure 8.
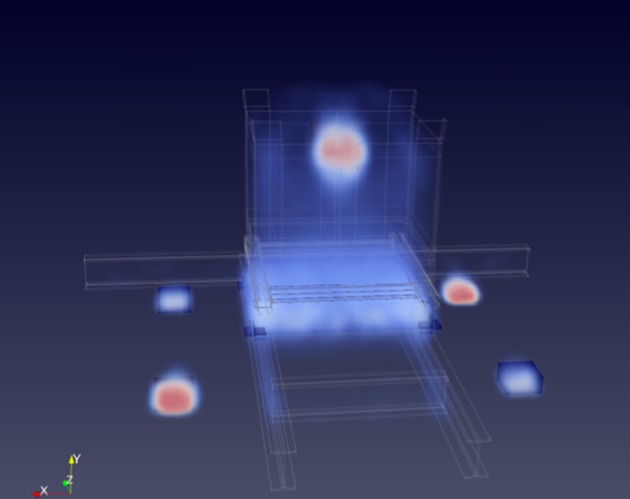
Tomographic reconstruction of the set-up described in the text and shown in figure 7. The reference blocks, the supporting structure, the scrap metal and the lead block are all clearly visible.
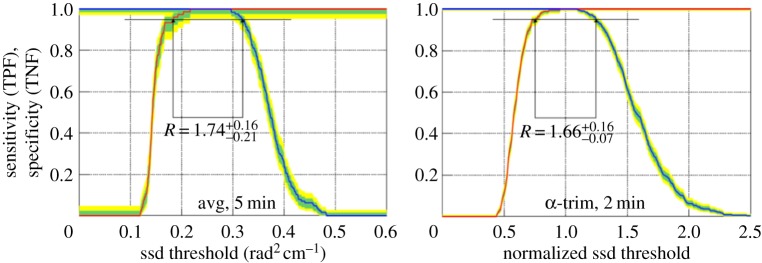
In order to go beyond qualitative images by quantifying the positive detection of source materials, an alarm level has been defined as the occurrence of a voxel (or of a group of voxels) with an LSD above a predefined threshold. The effectiveness of the method has been assessed as follows: (i) a large number (150 in the following) of independent datasets with the Pb block hidden in the scrap metal (sample A) were collected; (ii) a similar number of independent datasets without any Pb block in the scrap metal were also collected (sample B); (iii) the rate of source detection on sample A (true positive fraction or TPF), also called sensitivity, and the rate of apparent absence of the source material in sample B (true negative fraction or TNF), also called specificity, were computed as a function of the threshold; (iv) a separation rate R was defined as the ratio
| 4.1 |
of the thresholds (th) for which TNP and TNF are at 95%. A higher value of R indicates a better detection performance.
For short inspection times, as required by controls in operative situations, we must consider large fluctuations in the reconstructed LSD induced by large non-Gaussian tails on the scattering angle due to the wide spectrum of cosmic muons. This leads to noise in the reconstructed images, which can usually be reduced with filters. Details regarding the filters can be found in [5]. Here, it is sufficient to show that good detection performance (R>1) can be obtained with short inspection times, down to 2 min, as shown in figure 9, with an acceptable performance also for a 1 min inspection time: R=1.28+0.04−0.05.
Figure 9.
Examples of TPN plots with different exposure time and different filters. From Benettoni et al. [5].
5. Precision measurements
As discussed in §3, MST, in the absence of individual muon momentum measurements, is affected by several systematic uncertainties, in particular the proper value of 〈1/p2〉 and the absorption effects, that make an absolute and precise determination of material LSD very difficult. In addition to the previous sources of uncertainty, one also has to consider the finite angular acceptance of the detector system, the choice of voxel size, the convergence criteria of the iterative algorithm and the presence of other materials crossed by muons. Nevertheless, we have used the INFN MST demonstrator to prove that it is possible to measure the LSD and the ratio R=λ/ρ with a 10% precision or better.
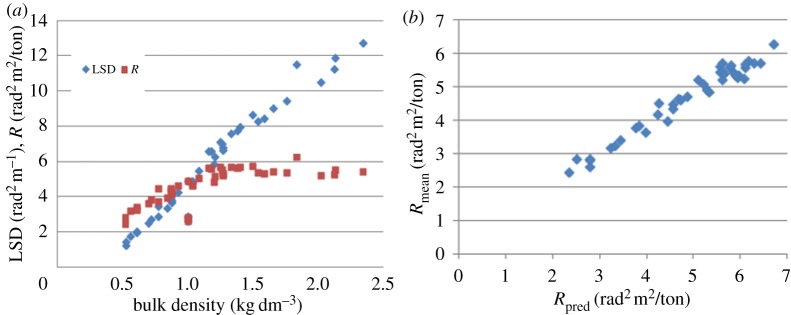
The material to be measured was extracted from an experimental blast furnace during activities related to the European project MU-Blast.2 Additional calibration samples were also measured [6], which were stored in 4.7 l plastic buckets. The lightest calibration samples were water and coke, and the heaviest were iron oxides, with a range of LSD of λ=1.30 rad2 m−1 (coke) to λ=13.65 rad2 m−1 (haematite). The material extracted from the furnace was expected to have an LSD value in this range, and hence measurements had to cope with one order of magnitude variation in LSD. For all samples containing several elements, the quantity R can be derived from the Ri value of the constituent elements by
| 5.1 |
where wi is the mass fraction of the ith element.
To fix the absolute scale of the reconstructed LSD, we included, in the target volume, four objects of known LSD. They were all parallelepipeds with 20 cm×20 cm horizontal surface. Two of them were 10 cm high iron blocks, the other two were composed of alternating 2 mm thick layers of iron and 8.5 mm thick layers of plywood to a total height of 10.5 cm. The LSD of these ‘mock-up’ blocks was λmock-up=11.7 rad2 m−1. Only the mock-up blocks were used to calibrate the measurements of experimental blast furnace samples since they have similar LSD values. The experimental set-up and the corresponding reconstructed image are shown in figure 10, where the shapes of the buckets with material samples and of the reference blocks are evident.
Figure 10.
(a) Experimental set-up for the measurement of several material samples. (b) Reconstructed tomographic image. M1 and M2 are the mock-up blocks, B1– B4 are the four buckets and F1 and F2 are the iron reference blocks.
In addition to the calibration, procedures devoted to noise reduction, background subtraction and the control of MLEM convergence were adopted. The bucket content was assumed to be homogeneous since only the average bulk density was evaluated and small fluctuations in material distribution were indistinguishable given the spatial resolution of the technology. By considering all the systematic uncertainties, the expected precision was between 7% and 10%. The measured R and LSD were then compared with the predicted values obtained from equation (5.1) once the chemical composition of the samples was known. As shown in figure 11, a good correspondence between the measured and predicted R values was obtained. Indeed, considering all samples and defining the deviation ΔR=(Rmeas/Rpred−1) we obtained an r.m.s. of 4.9% with an average value of −3.2%.
Figure 11.
(a) Measured LSD and R as a function of bulk density for all samples. (b) Measured R versus the predicted value. From Aström et al. [6].
6. Optimization of three-dimensional reconstruction
To have a good three-dimensional reconstruction, tomography requires a source with an input direction distributed over the whole solid angle. The angular distribution of cosmic muons is limited, at most, to the upper half of the solid angle but, even in this case, the highly penetrative properties of muons ensures a complete overall reconstruction of the target. However, in several cases, including the INFN demonstrator, the finite acceptance of the detectors limits even further the usable solid angle. In general, the acceptance favours the vertical direction as this has the highest intensity of muon flux. To increase the solid angle coverage without employing huge detectors, one could either rotate the detectors (impossible in our case) or else, where possible, rotate the sample under measurement.
We studied this solution in a real situation, providing the tools to make it effective. The most problematic issue in all cases of rotations (both detector or sample) is to provide a position survey sufficiently accurate that it does not spoil the image reconstruction. Given a set of objects in the detection volume (e.g. in the range from 2 to 15 cm iron pieces used as the benchmark and shown in figure 12), our solution is given by the following steps:
-
(i)
Define, as reference blocks, objects that can produce in an MST inspection clear signals in any direction (eight Pb cubes).
-
(ii)
Install reference blocks in a rigid system to ensure that distances remain fixed w.r.t. the volume to investigate.
-
(iii)
Take data (set 1: S1).
-
(iv)
Rotate the reference system and the volume to investigate and take a new dataset: S2.
-
(v)
For all the i=1–8 reference blocks find the space position pS1i and pS2i in both datasets.
-
(vi)
Find the roto-translation RT that minimizes Σ8i=1[pS1i−RT(pS2i)]2.
-
(vii)
Reconstruct as a unique dataset S1∪(RT)−1S2.
Figure 12.
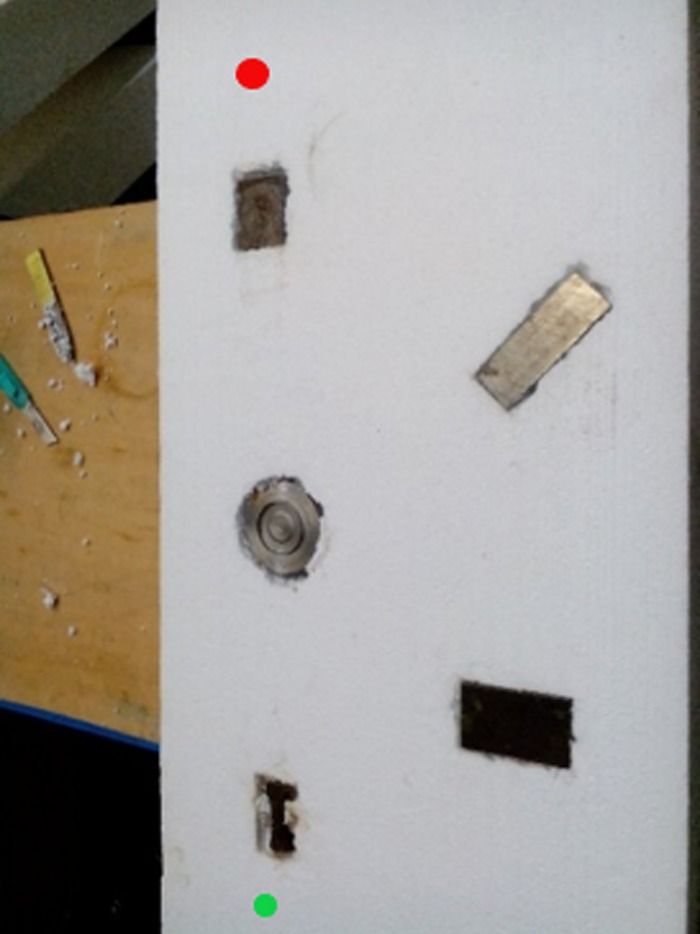
Layout of the iron objects used as a benchmark for the roto-translation procedure. The green and red spots are markers drawn by hand to give a reference to the objects.
In practice, in the last step, the directions of muons of S2 are rotated according to the inverse of the roto-translation RT before processing all data with the MLEM iterative algorithm. This method could be applied, with the same formalism, to the case of a rigid rotation of the detector system.
The results applied to the objects used as the benchmark are shown in figure 13, where the reconstruction of the S1 set is compared with the reconstruction of S1∪(RT)−1S2, both obtained with 1.5 cm voxel size. The improvement is clear, despite the iron structure in our apparatus which cannot be rotated (and hence (RT)−1S2 could produce ghost images in incorrect positions).
Figure 13.
(a) Vertical plane image from the reconstruction of the S1 set only, obtained with the 1.5 cm voxel size. (b) The same image from the reconstruction of S1∪(RT)−1S2. The green and red spots are markers drawn by hand to refer the reconstructed object to their position in figure 12.
7. Characterization of new detectors
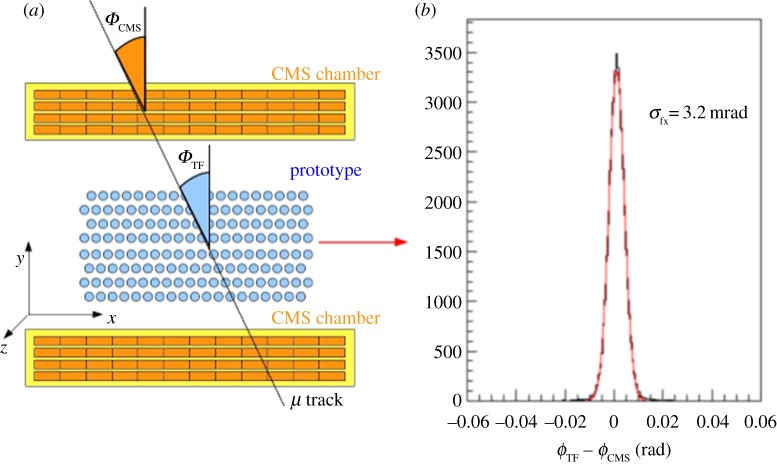
To produce new detectors for future MST applications, it may be more convenient to use different techniques which are simpler than the one using the CMS chambers. In particular, a simple solution would be to produce cylindrical drift tubes with radial electric field. We developed such solutions in past prototypes, based on tubes such as an elementary cell, as a potential scanner for transport or industrial controls (see footnote 1). We also plan to develop a detector for applications related to nuclear controls [7]. On the basis of reconstructed cosmic muon tracks, the INFN demonstrator can be used as a facility to characterize new detectors in terms of efficiency, drift time to space relation, position and angular resolution and stability. A schematic view of such an application for the MU-Steel project (see footnote 1) is shown in figure 14 together with the comparison of the track angular reconstruction. Figure 15 shows a 64-channel prototype based on 2 m long drift tubes inserted in the volume between the two chambers.
Figure 14.
(a) Schematic view of a prototype detector characterization test in the INFN cosmic muon demonstrator. (b) Distribution of the difference in muon angle track reconstructed in the prototype and in the CMS chambers.
Figure 15.
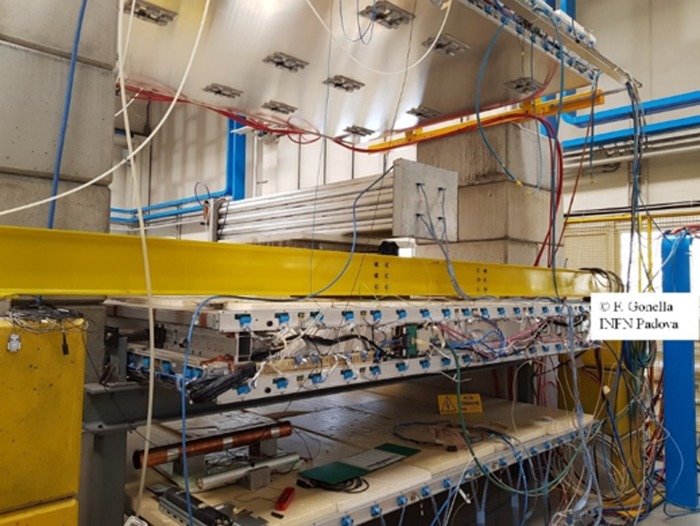
A 64-channel prototype based on a 2 m long drift tube inserted in the INFN demonstrator.
8. Conclusion
For several years, a large detector, composed of two spare chambers from the CMS experiment, has been used as a demonstrator for muon tomography. The detector constitutes an optimal tool to study muon scattering tomography with real data. With this facility, several important (and in part unexpected) achievements have been obtained. The detector has been (and will continue to be) used to answer specific questions related to different applications of muon tomography. It also constitutes an effective tool to commission new detectors dedicated to future MST applications.
Acknowledgments
Our gratitude to our colleagues at the University of Brescia for their help in GEANT4 simulations and at the other institutions collaborating with us to publish Benettoni et al. [5] and Aström et al. [6] (see footnote 2). Our deep appreciation for their work goes to Lorenzo Barcellan and all the INFN technicians who made available the Muon Tomography Station.
Footnotes
Muons scanner to detect radioactive sources hidden in scrap metal containers (MU-Steel), EU publication Research Fund for Coal and Steel, RFSR-CT-2010-00033.
Study of the capability of muon tomography to map the material composition inside a blast furnace (MU-Blast), EU publication Research Fund for Coal and Steel, RFSR-CT-2014-00027.
Data accessibility
This article has no additional data.
Competing interests
The authors declare that they have no competing interests.
Funding
The research being reported in this publication was supported by grants from the Università di Padova, from the Italian Ministry for Industry (project ‘SLIMPORT’), the European Union Research Fund for Coal and Steel: grant no. RFSR-CT-2010-00033 for the MU-Steel project Muon scanner to detect radioactive sources hidden in scrap metal containers, and grant no. RFSR-CT-2014-00027 for the MU-Blast project Study of the capability of muon tomography to map the material composition inside a blast furnace. In addition, the authors of this publication have benefitted from research support from the Istituto Nazionale di Fisica Nucleare sezione di Padova and Laboratori Nazionali di Legnaro.
References
- 1.Borozdin KN, Hogan GE, Morris C, Priedhorsky WC, Saunders A, Schultz LJ, Teasdale ME. 2003. Surveillance: radiographic imaging with cosmic-ray muons. Nature 422, 277 ( 10.1038/422277a) [DOI] [PubMed] [Google Scholar]
- 2.Chatrchyan S. et al. 2008. The CMS experiment at the CERN LHC. J. Instrum. 3, S08004 ( 10.1088/1748-0221/3/08/S08004) [DOI] [Google Scholar]
- 3.Pesente S. et al. 2009. First results on material identification and imaging with a large-volume muon tomography prototype. Nucl. Instrum. Methods Phys. Res. 604, 738–746. ( 10.1016/j.nima.2009.03.017) [DOI] [Google Scholar]
- 4.Schultz LJ, Blanpied GS, Borozdin KN, Fraser AM, Hengartner NW, Klimenko AV, Morris CL, Oram C, Sossong MJ. 2007. Statistical reconstruction for cosmic ray muon tomography. IEEE Trans. Image Process. 16, 1985–1993. ( 10.1109/TIP.2007.901239) [DOI] [PubMed] [Google Scholar]
- 5.Benettoni M. et al. 2013. Noise reduction in muon tomography for detecting high density objects. J. Instrum. 8, P12007 ( 10.1088/1748-0221/8/12/P12007) [DOI] [Google Scholar]
- 6.Aström E. et al. 2016. Precision measurements of linear scattering density using muon tomography. J. Instrum. 11, P07010 ( 10.1088/1748-0221/11/07/P07010) [DOI] [Google Scholar]
- 7.Checchia P, Gonella F, Rigoni A, Vanini S, Zumerle G. 2017. Muon tomography for spent nuclear fuel control. ESARDA Bull. 54, 2. [Google Scholar]
Associated Data
This section collects any data citations, data availability statements, or supplementary materials included in this article.
Data Availability Statement
This article has no additional data.


