Abstract
Chorus waves, among the most intense electromagnetic emissions in the Earth’s magnetosphere, magnetized planets, and laboratory plasmas, play an important role in the acceleration and loss of energetic electrons in the plasma universe through resonant interactions with electrons. However, the spatial evolution of the electron resonant interactions with electromagnetic waves remains poorly understood owing to imaging difficulties. Here we provide a compelling visualization of chorus element wave–particle interactions in the Earth’s magnetosphere. Through in-situ measurements of chorus waveforms with the Arase satellite and transient auroral flashes from electron precipitation events as detected by 100-Hz video sampling from the ground, Earth’s aurora becomes a display for the resonant interactions. Our observations capture an asymmetric spatial development, correlated strongly with the amplitude variation of discrete chorus elements. This finding is not theoretically predicted but helps in understanding the rapid scattering processes of energetic electrons near the Earth and other magnetized planets.
Electron precipitation plays major role in magnetospheric physics and space weather. Here the authors show nonlinear behavior of the wave–particle interaction in the magnetosphere as the evolution of chorus electromagnetic waves detected by the Arase satellite and PWING observatory.
Introduction
Chorus waves are among the most common plasma waves in the Earth’s magnetosphere1–5, around magnetized planets6, and in laboratory plasmas7. Chorus waves in the Earth’s magnetosphere are a major driver of relativistic electron precipitation (MeV or sub-MeV)8–10, X-ray microbursts (> 30 keV)11, pulsating auroras (tens of keV)12,13, and diffuse auroras (keV to tens of keV)14, all of which are mediated by chorus wave–particle interactions15,16. In particular, coherent chorus elements provide nonlinear energy exchange processes between electromagnetic waves and electrons on microphysical timescales17,18, which are essential to rapid local acceleration in the Earth’s radiation belts19 and are an important space weather proxy20. Theoretical analyses16,21 and numerical simulations22–25 assuming a one-dimensional spatial model along the background magnetic field line have predicted that rapid resonant interactions occur between single packets of chorus waves and energetic electrons over a wide (keV to MeV) range of energies and at a nonlinear transition time of less than several hundred milliseconds. However, to date there have been no observations that allow the spatiotemporal evolution in the transverse (across an existing geomagnetic field line) direction of single chorus element wave–particle interactions showing an elementary physical step of the prompt resonant interactions, and hence the quantitative spatial development of the source region is still poorly understood. Identifying any trace of the ionospheric footprint along geomagnetic field lines from the location of the chorus source (the magnetic equator)26 is difficult because a single chorus-wave packet lasts for only a few hundreds of milliseconds. If a single chorus-wave packet can interact with energetic electrons at the magnetic equator, as suggested by nonlinear theoretical and numerical studies16,21–25, a short-lived visible burst should be observed in the magnetic-conjugate region in the auroral zone. To quantify this rapid precipitation of energetic electrons, measurements of the spatiotemporal characteristics of the interaction between chorus waves and electrons are essential. Such electrons affect the Earth’s atmospheric chemistry and may play a role in climate change27–29. Direct detection of the auroral flash caused by a single chorus-wave packet requires coordinated observations from a satellite near the source region of the chorus waves at the magnetic equator and from highly sensitive cameras in a ground station network. The Arase satellite30 was launched in December 2016 to provide in situ observations in the Earth’s magnetosphere, and the ground-based PWING (study of dynamical variation of Particles and Waves in the INner magnetosphere using Ground-based network observations)31 collaboration is underway to deliver unique conjugate observations covering a wide longitudinal range at subauroral latitudes. To deliver unprecedented observations of the short-period auroras associated with chorus-wave packets, ground-based optical observations taken by PWING offer a high temporal resolution at 100 frames per second and the high sensitivity of electron-multiplying charge-coupled device (EMCCD) image sensors.
The spatiotemporal evolution of the auroral flashes driven by discrete chorus elements we show here is consistent with the idea of prompt resonant interactions between electromagnetic waves and electrons in collisionless plasmas. Our observations demonstrate that chorus waves regulate rapidly the time variations and locations of precipitating electron flux into the Earth’s atmosphere. Quantifying the spatial and temporal scales of these precipitation events contributes to understanding the nonlinear physical processes mediating the acceleration and precipitation of energetic electrons on the Earth and other magnetized planets.
Results
Coordinated Arase and ground observations
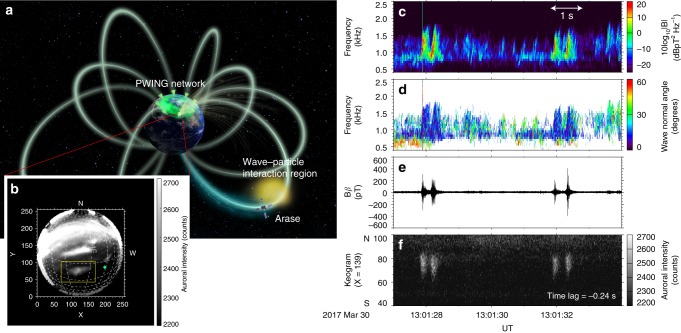
Figure 1a shows an illustration of an observation of a chorus-wave packet taken by the Arase satellite32–34, which coincided with an auroral flash that was imaged from the ground at Gakona, Alaska (62.39° N, 214.78° E) at 13:01 UT on 30 March 2017. A time-lapse video of the simultaneously observed all-sky EMCCD image and chorus-wave packets is included in Supplementary Movie 1. At this moment, the Arase satellite was located at the geomagnetic latitude of −19.6° and [XSM, YSM, ZSM] = [−3.59, −2.15, −1.43] Earth radii (Re) in solar magnetic (SM) coordinates, where the ZSM-axis is parallel to the Earth’s north magnetic pole, the YSM-axis is perpendicular to the Earth–Sun line toward the dusk, and the XSMZSM-plane contains the Earth–Sun direction. The Arase footprint calculated from an empirical geomagnetic field (T02) model35 was located near the auroral region (Fig. 1b) associated with the observed chorus-wave packets (Fig. 1c). The individual wave packet propagating parallel to the geomagnetic field line in this event (Fig. 1d) is the large-amplitude chorus (over a few hundreds of pT as shown in Fig. 1e)36, which can resonate with not only tens of keV electrons but also relativistic electrons8–10 when a resonance condition is satisfied22. Additionally, oblique-propagating chorus-wave packets with weak amplitudes were observed simultaneously with a typical pulsating aurora shown at the edge of the yellow frame in Supplementary Movie 1 from 13:01:30 to 13:01:31.5 UT. The equatorial half-gyrofrequency, calculated using the T02 model35, is ~2 kHz. The auroral data (Fig. 1f) were time-shifted with a lag of −0.24 s to adjust the temporal coincidence between the discrete chorus elements and auroral flashes. The observed time lag includes information on the source location along the field line.
Fig. 1.
Coordinated PWING stations and Arase observations. a Illustration of conjugate observations from the PWING ground network and the Arase satellite. Earth in Fig. 1a is mapped using NASA image. All rights reserved. b All-sky EMCCD snapshot observed at Gakona in Alaska at 13:01:28 UT, 30 March 2017. Dotted lines indicate the spacing of geographical latitudes and longitudes at 1° and 2° intervals. The yellow frame indicates the auroral region that is focused on in this study. The green diamond symbol indicates Arase’s footprint at the time of observation. c–e The dynamic spectrum, wave-normal angle with respect to the geomagnetic field line, and the waveform of large-amplitude chorus elements observed by Arase near the magnetic equator. f North to South keogram of auroral emissions with a time shift of −0.24 s
Source region
To localize the source region for chorus wave–particle interactions, the theoretical time difference between a chorus wave with group velocity vg and energetic particles with parallel velocity vp is calculated as
where si, sArase, sionosphere, and s are the possible source location, the Arase location, the ionospheric location above the ground station (at an altitude of 110 km), and the location along a geomagnetic field line, respectively. The parallel velocity of an energetic electron is written as
where
is the minimum kinetic energy for cyclotron resonance15 with chorus waves, m is the electron mass, α is the pitch angle, B is the geomagnetic field, μ0 is the permeability of a vacuum, N is the electron number density, f is the wave frequency, and fce is the electron cyclotron frequency. The group velocity2 of the chorus wave is
where, c is the speed of light, fp is the plasma frequency, and θkB is the wave-normal angle with the geomagnetic field line. The wave-normal angle is assumed to be parallel to the direction of propagation from the possible source location for the sake of simplicity. The electron number density along the geomagnetic field line is assumed to be 1.95 particles cm−3, as estimated from the upper hybrid resonance frequency observed by the Arase satellite37. The geomagnetic field line is calculated from the T02 model35. Figure 2 shows the calculation results for the wave (of 1600 Hz) and the electron traveling time as a function of the geomagnetic latitude of the source location. The observed time lag of −0.24 s is consistent with the theoretical time difference at the geomagnetic latitudes of +4.4° and −9.5°. The source region is localized using a calculation in the observed wave frequency range.
Fig. 2.
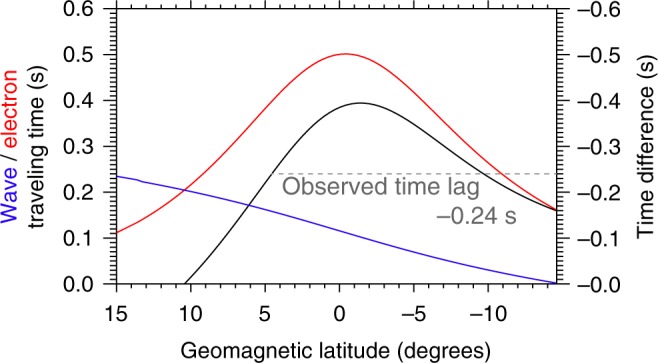
Theoretical time difference between chorus waves and electrons. Blue and red curves indicate the wave and electron traveling times. The dotted line indicates the observed time lag of −0.24 s for reference. Cross points between the black curve and the dotted line indicate the possible location of wave–particle interactions
Figure 3 shows the estimated magnetic latitude range of the chorus wave–particle interaction region in SM coordinates. The geomagnetic latitude is within the range +4.4° to −9.5° around the equator. The minimum kinetic energy is in the range from 26 to 83 keV and resonates with chorus waves at frequencies from 1600 to 1150 Hz. When an empirical plasma model, i.e., the global core plasma model38, is used instead of the assumption of constant electron density along the geomagnetic field line, the source region was in the range from −3.1° to −12°, still distributing near the equator. Since the time difference between chorus waves and energetic electrons is mostly characterized near the equator as shown in Fig. 2, the inferred source region does not strongly depend on the inhomogeneity of electron density along the geomagnetic field line. Therefore, the observed time difference between chorus elements and auroral flashes suggests that the source of the resonant interactions is located near the magnetic equator, which is in support of early theoretical analyses39,40 and numerical simulations41 of chorus-wave generation. Because related chorus waves were not detected at the Chistochina ground station, located 40 km northeast of Gakona, the observed chorus waves might be in the so-called nonducted mode in the Earth’s magnetosphere2. Nonducted chorus waves can deviate from the geomagnetic field line, thus the Arase satellite, locating a slightly different position from the source region, could observe the chorus elements propagating from the resonant interaction region.
Fig. 3.
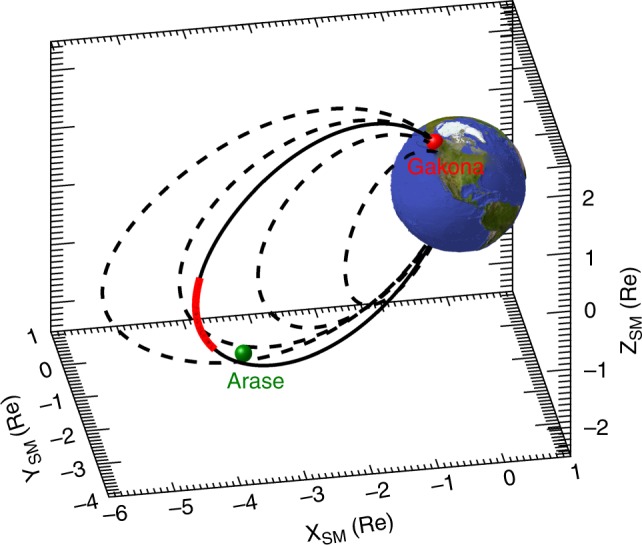
Magnetic latitude range of the wave–particle interaction region. The black solid curve is the magnetic field line connected to the auroral flash observed at Gakona. Dotted curves are magnetic field lines for the L-values of 3, 4, 5, and 6 for reference. The green symbol indicates Arase’s location in SM coordinates
Spatial development
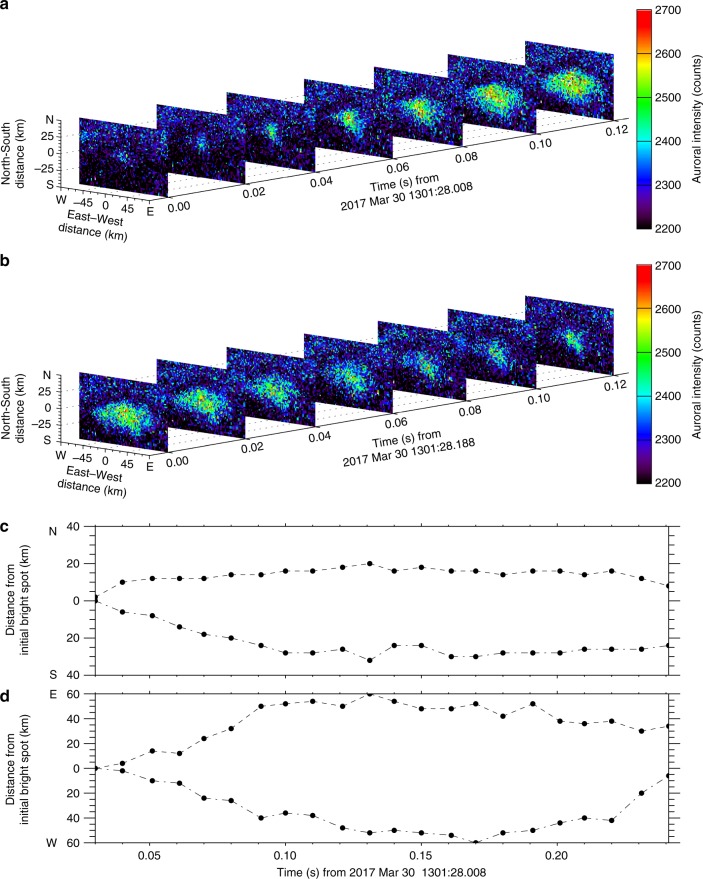
The correlated auroral flashes showed rapid spatial expansion (Fig. 4a) and contraction (Fig. 4b) in the ionosphere (at 110 km) as shown in Fig. 4. The auroral flashes expanded and contracted from their original position, which is likely to be the region from which the aurora was seeded. The spatial evolution in the ionosphere shows quite different spatiotemporal characteristics in comparison with a global morphology of diffuse auroras driven by chorus waves in the same manner14 and implies that the chorus wave–particle interaction region is also activated in a very small region in the equatorial plane of the magnetosphere. The spatial variations in the magnetic north–south and east–west directions are plotted in Fig. 4c, d. The auroral boundary evolved in the east–west direction with a slight asymmetry but deformed in the magnetic north–south direction with a clear asymmetry. The maximum spatial development in the south direction is approximately two times larger than that for the magnetic north direction from the initial bright spot observed at 1301:28.038 UT. During the growth phase (Fig. 4a), the horizontal expansion speeds were 560 to 625 km s−1 in the east–west direction and 250 to 375 km s−1 in the magnetic southward direction at the ionospheric altitude (110 km). During the contraction phase (Fig. 4b), the horizontal decay speeds were slower than those in the growth phase. As shown in Supplementary Movie 1, the other auroral flashes also showed similar spatial developments and horizontal speeds. As these speeds are a few hundred times faster than the typical ionospheric convection42, the spatial evolution indicates the projection of chorus wave–particle interactions in the magnetosphere without influence from the convection motion. The patchy structure and the expanded development are similar to the spatial features of pulsating aurora43, which is also driven by chorus waves consisting of a bundle of successive discrete elements, not a single chorus element. It should be noted that the expansion speeds of the present events were two times or more faster than those of typical pulsating aurora. The rapid development of the coherent spatial structure suggests that the coherent resonant interaction processes along the background magnetic field line between electromagnetic waves and energetic particles are spread radially across the magnetic field line in the seed region near the equator.
Fig. 4.
Spatiotemporal evolution of the auroral flash in the ionosphere. a The initial spatial expansion and b the gradual contraction of the auroral flash. The spatial developments in c the magnetic north (dashed line)–south (dot-and-dash line) and d east (dashed line)–west (dot-and-dash line) directions from the initial bright spot
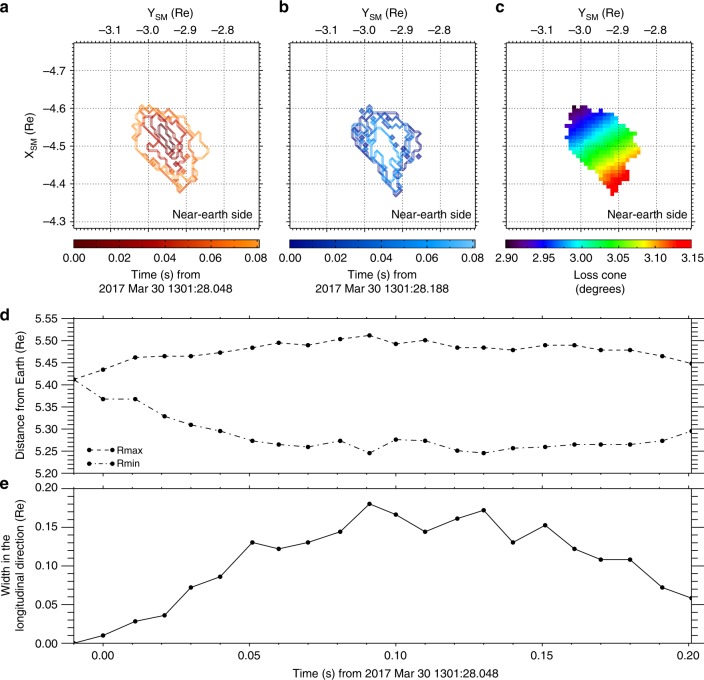
The transverse (across the geomagnetic field line) spatial evolution of chorus wave–particle interactions was estimated by projecting the ionospheric aurora onto the equatorial plane in the magnetosphere using the T02 model35. Figure 5a, b shows the spatial evolution of the auroral boundary in the magnetosphere’s equatorial plane. The auroral boundary was extracted using Otsu’s method44. The radial distance of the contours mapped along geomagnetic field lines from the Earth to the equatorial plane (ZSM = 0) is defined as , and the maximum and minimum values (Rmax and Rmin) are plotted in Fig. 5d. The width of contours in the longitudinal direction is plotted in Fig. 5e. The small transverse scale in both radial and longitudinal directions evolves from the order of gyroradii scales of tens-keV electrons at the initial extent phase, then the maximum spatial size is rapidly reached at 0.1 s from the initial development. The maximum widths in the radial and longitudinal directions were 0.25 Re and 0.18 Re, respectively. The observed spatial variation of the resonant interaction in the magnetosphere was mainly the radial expansion toward the Earth rather than in the longitudinal direction. The precipitated electrons must have their pitch angles within an equatorial loss cone, , where B0 and Bm are the geomagnetic field intensity at the magnetic equator and at the ionospheric altitude (110 km), respectively. As shown in Fig. 5c, the angles of this equatorial loss cone, that is, the angle of motion of the electrons relative to the field line within which they must precipitate, as estimated by the T02 model35, becomes smaller with increasing radial distance from the Earth. The spatial dependence of the equatorial loss cone can have an impact on this asymmetric distribution in the earthward direction of the resonant wave–particle interaction region, because the earthward loss cone has a wider angle for electron precipitation into the atmosphere.
Fig. 5.
Visualization of the region of resonant interaction between a single chorus wave and electrons. a The expansion (red contours) and b contraction (blue contours) of the chorus wave–particle interaction region at the magnetic equator (ZSM = 0) in SM coordinates. Contour lines are plotted every 20 ms. c The spatial dependence of the equatorial loss cone calculated from the T02 model. The time variations of d the maximum and minimum radial distance from the Earth and e the width in the longitudinal direction of the resonant interaction region
Spatiotemporal evolution
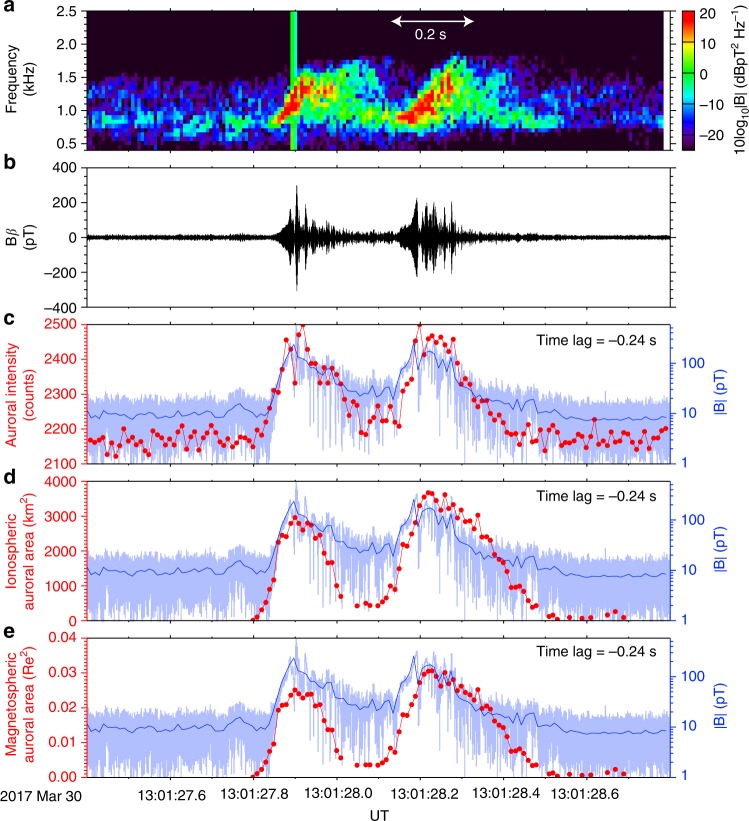
Figure 6 shows the relationship between the chorus-wave amplitude and the spatiotemporal evolution of the resonant interaction region for the first two chorus elements (Fig. 6a) in Fig. 1c. The chorus-wave amplitude with the original temporal resolution of 1/65536 s (Fig. 6b) is averaged over 0.01 s to match the temporal resolution of the auroral images. The exact one-to-one correspondence between auroral intensity variation and chorus-wave amplitude (Fig. 6c) provides clear experimental evidence that discrete chorus elements effectively and rapidly resonate with energetic electrons at the magnetic equator on the nonlinear scale of a few hundred milliseconds. Furthermore, the expansion and contraction of the auroral area in the ionosphere (Fig. 6d) and at the equatorial plane of the magnetosphere (Fig. 6e) correlates very well with the chorus-wave amplitude, with a correlation coefficient of 0.77. Although there is no information on the transverse size of the chorus-wave packet because of the single probe by Arase, the spatiotemporal evolution of the resonant interaction region in this event showed a clear agreement with the chorus amplitude variation at the Arase location. The relationship between auroral spatial scale and chorus is also reported in the case of typical pulsating aurora, which was accompanied by dense discrete chorus elements45. This agreement extracted from the pure single chorus element suggests the possibility that the chorus-wave amplitude is associated with its transverse size of wave packet to effectively and rapidly grow in amplitude. It is known that the chorus-wave amplitude is closely related to various physical parameters, such as the frequency sweep rate, the energy gain of the energetic electrons, propagation effects, and others17. The spatial expansion and contraction of auroras has not been theorized clearly because most theories of chorus-wave generation approximate the chorus wave as a plane wave propagating along a field line17,39,40. Our findings require a nonlinear theory to explain the relationship between the evolution of the chorus-wave amplitude and the spatial development of the resonant interaction region across the geomagnetic field line, because the source region should be characterized like a natural antenna with a finite spatial scale radiating chorus waves rather than a point source.
Fig. 6.
Evolution of chorus element wave–particle interactions associated with the chorus-wave growth. a, b The frequency–time diagram and the waveform of discrete chorus elements. c The temporal evolution of the auroral emissions. Spatial evolutions of the auroral area d in the ionosphere (110 km) and e at the magnetic equator. The light and rich blue curves indicate chorus amplitudes with a temporal resolution of 1/65536 s and an averaged resolution of 1/100 s in panels c, d, and e
Discussion
In previous studies, chorus wave–particle interactions have been found to show a coincidence in their temporal characteristics8–13. The observations presented here show unprecedented one-to-one correspondence between individual chorus elements and auroral flashes on timescales of a few hundreds of milliseconds. Furthermore, our measurements show clear expansion and contraction of the chorus wave–particle interaction region in the Earth’s magnetosphere using visualization through the auroral display. As shown in Fig. 5a, the transverse development implies the cascade of resonant interactions across the geomagnetic field line among different wave numbers and frequencies with electrons and the largest source in the magnetosphere reached a circle of radius ~0.1–0.15 Re. The transverse source size of a single chorus element wave–particle interaction at the magnetic equator was roughly consistent with observations of relativistic electron microburst precipitation events from multiple CubeSats46 and with the size of coherent sources of chorus-wave packets47. Relativistic MeV and sub-MeV electrons have been reported to precipitate simultaneously with pulsating auroras driven by chorus waves48, which suggests that electrons of a wide range of energies can resonate with chorus waves at higher latitudes along the geomagnetic field line24. Therefore, the auroral flashes, that are so clearly associated with large-amplitude chorus waves in the present observation, are caused by tens-keV electron precipitation directly exciting auroral emissions and might be accompanied by microbursts of relativistic electrons when the resonant condition is established22,48.
The high correlation between aurora size and chorus amplitude in the observations suggests the following three interpretations: (1) the auroral size indicates the wave–particle interaction region as suggested by previous work49 and also indicates the finite transverse size of the chorus-wave source47; (2) the area of the source region depends on chorus-wave propagation49, which is essential for wave growth17, and (3) the auroral size is restricted by the spatial structure of the electron populations that are suited for chorus-wave generation50. Further theoretical consideration will be needed to understand the parameters that dominate the spatial evolution of the wave–particle interaction regions.
Chorus waves have attracted considerable attention not only as loss mechanisms of the Earth’s radiation belt electrons but also for their local acceleration via wave–particle interactions19,51,52. The localized acceleration and loss rates of energetic electrons from the radiation belts are strongly restricted by the spatial scales of the chorus waves. The visualization of the wave–particle interaction region as an aurora provides a key informational tool for understanding the dynamical variations of energetic electron populations of the Earth’s magnetosphere and other magnetized planets.
Methods
Chorus-wave measurements
Chorus waves were observed by the Magnetic Search Coil34 of the Plasma Wave Experiment (PWE)32 aboard the Arase satellite30. The waveforms were captured with a sampling frequency of 65.536 kHz33. The wave amplitude was calculated as the absolute value of the magnetic field vector of a chorus wave, where Bγ is a spin axis component of a magnetic field vector and, Bα and Bβ are spin-plane components. The wave-normal angle is calculated using Means’ method53.
Ground-based optical observations
Prompt auroral emissions at the first positive bands of molecular nitrogen (~700–900 nm) were recorded at 100 frames per second. EMCCD images were taken with an electron-multiplying (EM) gain of 150 and 2 × 2 binning (total: 256 × 256 pixels). The EMCCD images were triggered by 1-pulse-per-second (1PPS) signals from a global positioning system (GPS) receiver to maintain time synchronization accurate to less than 1 ms. The EMCCD images were taken through an RG665 glass filter to eliminate slow auroral emissions54 (i.e., 557.7 and 630.0 nm lines). The high-speed image data allows direct comparisons between chorus-wave packets and short auroral emissions.
Auroral image mapping
The World Geodetic System 1984 was used for ionosphere mapping of the all-sky EMCCD images. The altitude of the auroral emissions was assumed to be 110 km, and the magnetic declination was assumed to be 18° from the international geomagnetic reference field55. While mapping at the magnetosphere, the T02 model35 was used with SM coordinates. The auroral contour is extracted from the auroral images mapping in the ionosphere (110 km) using Otsu’s method44, then the contour is projected to the equatorial plane using the T02 model35. The auroral image at an altitude of 110 km and at the magnetic equator has a spatial resolution of 2 km and 0.01 Earth radii, respectively.
Supplementary information
Description of Additional Supplementary Files
Acknowledgements
The present study was supported by JSPS KAKENHI JP15H05747, JP15H05815, JP16H06286, JP16H04056, JP17H06140, and JP17K06456 and by Kanazawa University SAKIGAKE project. The authors would like to thank Marty Karjala of the University of Alaska Fairbanks (UAF) for his careful support with the EMCCD optical observations at Gakona. The database construction for the PWING ground-based instruments is partly supported by the IUGONET (Inter-university Upper atmosphere Global Observation NETwork) project (http://www.iugonet.org/). The authors would also like to extend sincere thanks to all members of the ERG project, the PWING project, and the ERG Science Center. This work was carried out by the joint research program of the Institute for Space–Earth Environmental Research (ISEE), Nagoya University.
Author contributions
M.O. led the data analysis and wrote the paper. Y.M. is the ERG project scientist and carefully advised M.O. in writing this paper. K.S. is the project leader for PWING and contributed to the discussion of the results. K.H. gave many important suggestions for writing this paper. R.K., Y.E., and Y.Ogawa developed the high-speed EMCCD camera systems and contributed to the EMCCD data analysis. Y.Kasahara is the principal investigator for the Plasma Wave Experiment (PWE) aboard the Arase satellite. S.Y. and Y.Kasaba are co-principal investigators of the PWE. A.Kunamoto, F.T., S.M., Y.Katoh, M.H., and S.K contributed to the PWE data analysis. S.O., Y.Otsuka, Y.T. M.N., T.N., N.N., A.Kadokura, and M.C. contributed to the discussion about data handling in the PWING network. T.I. contributed to plotting figures. R.M. provided the ground VLF data observed at Chistochina. A.M. is the principal investigator for the Magnetic Field Experiment aboard the Arase satellite. I.S. is the manager of the ERG project and contributed to the discussion about Arase data handling.
Data availability
The EMCCD image by PWING and chorus wave by Arase data that support the findings of this study are available from the ERG Science Center operated by ISAS/JAXA and ISEE/Nagoya University (https://ergsc.isee.nagoya-u.ac.jp/data_info/index.shtml.en).
Competing interests
The authors declare no competing interests.
Footnotes
Journal peer review information: Nature Communications thanks the anonymous reviewers for their contribution to the peer review of this work.
Publisher’s note: Springer Nature remains neutral with regard to jurisdictional claims in published maps and institutional affiliations.
Supplementary information
Supplementary Information accompanies this paper at 10.1038/s41467-018-07996-z.
References
- 1.Storey LRO. An investigation of whistling atmospherics. Philos. Trans. R. Soc. Lond. 1953;246:113–141. doi: 10.1098/rsta.1953.0011. [DOI] [Google Scholar]
- 2.Helliwell RA. Low-frequency waves in the magnetosphere. Rev. Geophys. 1969;7:281–303. doi: 10.1029/RG007i001p00281. [DOI] [Google Scholar]
- 3.Tsurutani BT, Smith EJ. Postmidnight chorus: a substorm phenomenon. J. Geophys. Res. 1974;79:118–127. doi: 10.1029/JA079i001p00118. [DOI] [Google Scholar]
- 4.Santolík O, et al. Spatio-temporal structure of storm-time chorus. J. Geophys. Res. 2003;108:1278. doi: 10.1029/2002JA009791. [DOI] [Google Scholar]
- 5.Li W, et al. Global distribution of whistler-mode chorus waves observed on the THEMIS spacecraft. Geophys. Res. Lett. 2009;36:L09104. [Google Scholar]
- 6.Kurth WS, Gurnett DA. Plasma waves in planetary magnetospheres. J. Geophys. Res. 1991;96:18977–18991. doi: 10.1029/91JA01819. [DOI] [Google Scholar]
- 7.Van Compernolle B, et al. Excitation of chirping whistler waves in a laboratory plasma. Phys. Rev. Lett. 2015;114:245002. doi: 10.1103/PhysRevLett.114.245002. [DOI] [PubMed] [Google Scholar]
- 8.Lorentzen KR, et al. Observations of relativistic electron microbursts in association with VLF chorus. J. Geophys. Res. 2001;106:6017–6027. doi: 10.1029/2000JA003018. [DOI] [Google Scholar]
- 9.Breneman AW, et al. Observations directly linking relativistic electron microbursts to whistler mode chorus: Van Allen Probes and FIREBIRD II. Geophys. Res. Lett. 2017;44:11,265–11,272. doi: 10.1002/2017GL075001. [DOI] [Google Scholar]
- 10.Mozer FS, et al. Simultaneous observations of lower band chorus emissions at the equator and microburst precipitating electrons in the ionosphere. Geophys. Res. Lett. 2018;45:511–516. doi: 10.1002/2017GL076120. [DOI] [Google Scholar]
- 11.Rosenberg TJ, Helliwell RA, Katsufrakis JP. Electron precipitation associated with discrete very-low-frequency emissions. J. Geophys. Res. 1971;76:8445–8452. doi: 10.1029/JA076i034p08445. [DOI] [Google Scholar]
- 12.Nishimura Y, et al. Identifying the driver of pulsating aurora. Science. 2010;330:81–84. doi: 10.1126/science.1193186. [DOI] [PubMed] [Google Scholar]
- 13.Kasahara S, et al. Pulsating aurora from electron scattering by chorus waves. Nature. 2018;554:337–340. doi: 10.1038/nature25505. [DOI] [PubMed] [Google Scholar]
- 14.Thorne RM, et al. Scattering by chorus waves as the dominant cause of diffuse auroral precipitation. Nature. 2010;467:943–946. doi: 10.1038/nature09467. [DOI] [PubMed] [Google Scholar]
- 15.Kennel CF, Petschek HE. Limit on stably trapped particle fluxes. J. Geophys. Res. 1966;71:1–28. doi: 10.1029/JZ071i001p00001. [DOI] [Google Scholar]
- 16.Tsurutani BT, Lakhina GS. Some basic concepts of wave-particle interactions in collisionless plasmas. Rev. Geophys. 1997;35:491–501. doi: 10.1029/97RG02200. [DOI] [Google Scholar]
- 17.Omura Y, Katoh Y, Summers D. Theory and simulation of the generation of whistler-mode chorus. J. Geophys. Res. 2008;113:A04223. doi: 10.1029/2007JA012622. [DOI] [Google Scholar]
- 18.Foster JC, et al. Van Allen Probes observations of prompt MeV radiation belt electron acceleration in nonlinear interactions with VLF chorus. J. Geophys. Res. Space Phys. 2017;122:324–339. doi: 10.1002/2016JA023429. [DOI] [Google Scholar]
- 19.Thorne RM, et al. Rapid local acceleration of relativistic radiation-belt electrons by magnetospheric chorus. Nature. 2013;504:411–414. doi: 10.1038/nature12889. [DOI] [PubMed] [Google Scholar]
- 20.Horne RB, et al. Space weather impacts on satellites and forecasting the Earth’s electron radiation belts with SPACECAST. Space Weather. 2013;11:169–186. doi: 10.1002/swe.20023. [DOI] [Google Scholar]
- 21.Lakhina GS, et al. Pitch angle transport of electrons due to cyclotron interactions with the coherent chorus subelements. J. Geophys. Res. 2010;115:A00F15. doi: 10.1029/2009JA014885. [DOI] [Google Scholar]
- 22.Bortnik J, Thorne RM, Inan US. Nonlinear interaction of energetic electrons with large amplitude chorus. Geophys. Res. Lett. 2008;35:L21102. doi: 10.1029/2008GL035500. [DOI] [Google Scholar]
- 23.Hikishima M, Omura Y, Summers D. Microburst precipitation of energetic electrons associated with chorus wave generation. Geophys. Res. Lett. 2010;37:L07103. doi: 10.1029/2010GL042678. [DOI] [Google Scholar]
- 24.Saito S, Miyoshi Y, Seki K. Relativistic electron microbursts associated with whistler chorus rising tone elements: GEMSIS-RBW simulations. J. Geophys. Res. 2012;117:A10206. doi: 10.1029/2012JA018020. [DOI] [Google Scholar]
- 25.Miyoshi Y, et al. Relation between fine structure of energy spectra for pulsating aurora electrons and frequency spectra of whistler mode chorus waves. J. Geophys. Res. Space Phys. 2015;120:7728–7736. doi: 10.1002/2015JA021562. [DOI] [Google Scholar]
- 26.Nishimura Y, et al. Estimation of magnetic field mapping accuracy using the pulsating aurora-chorus connection. Geophys. Res. Lett. 2011;38:L14110. doi: 10.1029/2011GL048281. [DOI] [Google Scholar]
- 27.Codrescu MV, et al. Medium energy particle precipitation influences on the mesosphere and lower thermosphere. J. Geophys. Res. 1997;102:19977–19987. doi: 10.1029/97JA01728. [DOI] [Google Scholar]
- 28.Lam MM, et al. Origin of energetic electron precipitation>30 keV into the atmosphere. J. Geophys. Res. 2010;115:A00F08. doi: 10.1029/2009JA014619. [DOI] [Google Scholar]
- 29.Turunen E, et al. Mesospheric ozone destruction by high-energy electron precipitation associated with pulsating aurora. J. Geophys. Res. Atmos. 2016;121:852–11,861. doi: 10.1002/2016JD025015. [DOI] [Google Scholar]
- 30.Miyoshi Y, et al. Geospace exploration project ERG. Earth Planets Space. 2018;70:101. doi: 10.1186/s40623-018-0862-0. [DOI] [Google Scholar]
- 31.Shiokawa K, et al. Ground-based instruments of the PWING project to investigate dynamics of the inner magnetosphere at subauroral latitudes as a part of the ERG-ground coordinated observation network. Earth Planets Space. 2017;69:160. doi: 10.1186/s40623-017-0745-9. [DOI] [Google Scholar]
- 32.Kasahara Y, et al. The plasma wave experiment (PWE) on board the Arase (ERG) satellite. Earth Planets Space. 2018;70:86. doi: 10.1186/s40623-018-0842-4. [DOI] [Google Scholar]
- 33.Matsuda S, et al. Onboard software of plasma wave experiment aboard Arase: instrument management and signal processing of waveform capture/onboard frequency analyzer. Earth Planets Space. 2018;70:75. doi: 10.1186/s40623-018-0838-0. [DOI] [Google Scholar]
- 34.Ozaki M, et al. Magnetic search coil (MSC) of plasma wave experiment (PWE) aboard the Arase (ERG) satellite. Earth Planets Space. 2018;70:76. doi: 10.1186/s40623-018-0837-1. [DOI] [Google Scholar]
- 35.Tsyganenko NA. A model of the near magnetosphere with a dawn-dusk asymmetry, 2, Parameterization and fitting to observations. J. Geophys. Res. 2002;107:A8. [Google Scholar]
- 36.Santolík O, et al. Fine structure of large-amplitude chorus wave packets. Geophys. Res. Lett. 2014;41:293–299. doi: 10.1002/2013GL058889. [DOI] [Google Scholar]
- 37.Kumamoto A, et al. High frequency analyzer (HFA) of plasma wave experiment (PWE) onboard the Arase spacecraft. Earth Planets Space. 2018;70:82. doi: 10.1186/s40623-018-0854-0. [DOI] [Google Scholar]
- 38.Gallagher DL, Craven PD, Comfort RH. Global core plasma model. J. Geophys. Res. 2000;105:18819–18833. doi: 10.1029/1999JA000241. [DOI] [Google Scholar]
- 39.Helliwell RA. A theory of discrete VLF emissions from the magnetosphere. J. Geophys. Res. 1967;72:4773–4790. doi: 10.1029/JZ072i019p04773. [DOI] [Google Scholar]
- 40.Trakhtengerts VY. Magnetosphere cyclotron maser: backward wave oscillator generation regime. J. Geophys. Res. 1995;100:205–17,210. doi: 10.1029/95JA00843. [DOI] [Google Scholar]
- 41.Katoh Y, Omura Y. Computer simulation of chorus wave generation in the Earth’s inner magnetosphere. Geophys. Res. Lett. 2007;34:L03102. [Google Scholar]
- 42.Yang B, et al. Using patchy pulsating aurora to remote sense magnetospheric convection. Geophys. Res. Lett. 2015;42:5083–5089. doi: 10.1002/2015GL064700. [DOI] [Google Scholar]
- 43.Scourfield MWJ, Parsons NR. Pulsating auroral patches exhibiting sudden intensity-dependent spatial expansion. J. Geophys. Res. 1971;76:4518–4524. doi: 10.1029/JA076i019p04518. [DOI] [Google Scholar]
- 44.Otsu N. A threshold selection method from gray-level histograms. Ieee. Trans. Syst. Man. Cybern. 1979;9:62–66. doi: 10.1109/TSMC.1979.4310076. [DOI] [Google Scholar]
- 45.Tagirov VR, et al. Auroral pulsations and accompanying VLF emissions. Ann. Geophys. 1998;17:66–78. doi: 10.1007/s005850050737. [DOI] [Google Scholar]
- 46.Anderson BR, et al. Spatial scale and duration of one microburst region on 13 August 2015. J. Geophys. Res. Space Phys. 2017;122:5949–5964. doi: 10.1002/2016JA023752. [DOI] [Google Scholar]
- 47.Agapitov O, et al. Chorus whistler wave source scales as determined from multipoint Van Allen Probe measurements. Geophys. Res. Lett. 2017;44:2634–2642. doi: 10.1002/2017GL072701. [DOI] [Google Scholar]
- 48.Miyoshi Y, et al. Energetic electron precipitation associated with pulsating aurora: EISCAT and Van Allen Probe observations. J. Geophys. Res. Space Phys. 2015;120:2754–2766. doi: 10.1002/2014JA020690. [DOI] [Google Scholar]
- 49.Nishimura Y, et al. Multievent study of the correlation between pulsating aurora and whistler mode chorus emissions. J. Geophys. Res. 2011;116:A11221. [Google Scholar]
- 50.Oguti T. recurrent auroral patterns. J. Geophys. Res. 1976;81:1782–1786. doi: 10.1029/JA081i010p01782. [DOI] [Google Scholar]
- 51.Summers D, Thorne RM, Xiao F. Relativistic theory of wave-particle resonant diffusion with application to electron acceleration in the magnetosphere. J. Geophys. Res. 1998;103:20487–20500. doi: 10.1029/98JA01740. [DOI] [Google Scholar]
- 52.Miyoshi Y, et al. Rebuilding process of the outer radiation belt during the 3 November 1993 magnetic storm: NOAA and Exos-D observations. J. Geophys. Res. 2003;108:1004. doi: 10.1029/2001JA007542. [DOI] [Google Scholar]
- 53.Means JD. Use of the three-dimensional covariance matrix in analyzing the polarization properties of plane waves. J. Geophys. Res. 1972;77:5551–5559. doi: 10.1029/JA077i028p05551. [DOI] [Google Scholar]
- 54.Semeter J, et al. Wave dispersion and the discrete aurora: New constraints derived from high-speed imagery. J. Geophys. Res. 2008;113:A12208. doi: 10.1029/2008JA013122. [DOI] [Google Scholar]
- 55.Thébault E, et al. International Geomagnetic Reference Field: the 12th generation. Earth Planets Space. 2015;67:79. doi: 10.1186/s40623-015-0228-9. [DOI] [Google Scholar]
Associated Data
This section collects any data citations, data availability statements, or supplementary materials included in this article.
Supplementary Materials
Description of Additional Supplementary Files
Data Availability Statement
The EMCCD image by PWING and chorus wave by Arase data that support the findings of this study are available from the ERG Science Center operated by ISAS/JAXA and ISEE/Nagoya University (https://ergsc.isee.nagoya-u.ac.jp/data_info/index.shtml.en).


