Abstract
The aim of this work was to develop a fully-coupled bolus-esophageal-gastric model based on the immersed boundary-finite-element (IB-FE) method to study the process of esophageal emptying across the esophagogastric junction (EGJ). The model included an esophageal segment, an ellipsoid-shaped stomach, a bolus, and a simple model of the passive and active sphincteric functions of the lower esophageal sphincter (LES). We conducted three sets of case studies: 1) the effect of a non-relaxing LES; 2) the influence of the tissue anisotropy in the form of asymmetrical right and left sided compliance of the LES segment; and 3) the influence of LES and gastric wall stiffness on bulge formation of the distal esophageal wall. We found that a non-relaxing LES caused sustained high wall stress along the LES segment and obstruction of bolus emptying. From the simulations of tissue anisotropy, we found that the weaker side (i.e. more compliant) of the LES segment sustained greater deformation, greater wall shear stress, and a greater high-pressure load during bolus transit. In the third set of studies, we found that a right-sided bulge in the esophageal wall tends to develop during esophageal emptying when LES stiffness was decreased or gastric wall stiffness was increased. Hence, the bulge may be partly due to the asymmetric configuration of the gastric wall with respect to the esophageal tube. Together, the observations from these simulations provide insight into the genesis of epiphrenic diverticula, a complication observed with esophageal motility disorders. Future work, with additional layers of complexity to the model, will delve into the mechanics of gastroesophageal reflux and the effects of hiatus hernia on EGJ function.
Keywords: Immersed boundary method, Esophageal diverticulum, Esophageal-gastric junction, Lower esophageal sphincter stiffness
1. Introduction
The esophagogastric junction (EGJ) is a complex structure consisting of the lower esophageal sphincter (LES), crural diaphragm, phrenoesophageal ligament, and gastric cardia that serves as the conduit between the esophagus and stomach (Mittal and Balaban 1997; Brasseur et al 2007; Roy et al 2012). During swallowing, the EGJ allows the passage of ingested food and liquid from esophagus to stomach, a process referred to herein as esophageal emptying (Lin et al 2014; Kwiatek et al 2012). Among EGJ constituents, the LES plays a central role in esophageal emptying. At rest, the LES normally maintains an active tone that serves as an antireflux barrier. During swallowing, the LES relaxes and opens to facilitate the passage of food (Mittal and Balaban 1997; Roy et al 2012). On the other hand, in pathological states such as achalasia, an incompletely relaxing LES obstructs the passage of food and fluid (Mittal and Balaban 1997; Pandolfino et al 2008). Hence, LES function during both esophageal emptying and reflux is of great clinical significance and research groups have attempted to mathematically model it. Ghosh et al. developed a two-dimensional model of esophageal emptying in normal subjects and in patients after fundoplication surgery (Ghosh et al 2005). However, they did not model the esophageal wall mechanics, instead solving the flow characteristics based only on luminal geometry. Yassi et al. studied the mechanical function of the EGJ based an anatomically accurate three-dimensional wall geometry (Yassi et al 2009). However, their study focused on the passive and active properties of the esophageal wall, and did not include a bolus. In the current study, we attempt to develop a bolus-esophageal-gastric model that incorporates the bolus, esophageal wall, gastric wall, and neurally controlled muscle activation. We also include a simple model to consider the passive and active function of the LES. Admittedly, the model is very simplified compared to the complicated physiology of the EGJ, but it holds the future potential to include additional biophysical structures, such as the crural diaphragm and phrenoesophageal ligament. Focusing on esophageal emptying, we present three groups of studies on the LES. In the first group, we compare esophageal emptying with a non-relaxing LES to the base case with normal relaxation. The second and third groups relate to distal esophageal diverticuli, also called epiphrenic diverticuli. An epiphrenic diverticulum is a pouch, or pocket, of stretched mucosa that evaginates through the muscular layers of the esophagus. The cause of epiphrenic diverticuli is poorly understood, although it is associated with esophageal motility disorders, such as achalasia and distal esophageal spasm (Soares et al 2010). We hypothesize that abnormalities of the material properties of the LES and gastric wall may also contribute to the formation of diverticuli. Specifically, we hypothesize that tissue anisotropy is a contributing factor. The anisotropy being referred to is unequal compliance of the right and left hand sides of the LES segment. We hypothesize that this asymmetry leads to further degradation, i.e. more biased material property, due to an increased pressure load on the compliant part. This will be tested in the second group of studies.
Another contributing factor to the formation of epiphrenic diverticuli may relate to the asymmetric anatomy of the EGJ. Specifically, we hypothesize that if the LES segment becomes compliant, a bulge tends to develop on the right side because of the asymmetric configuration of the stomach. A stiffer gastric wall may exacerbate this, as it enhances the asymmetric load on the LES during esophageal emptying. However, the impact of this effect may be modulated by the stiffness of the LES segment. This will be tested in our third group of studies.
2. Mathematical formulation
We used the immersed-boundary-finite-element (IB-FE) method, which is suitable for applications with fluid-structure interactions (Peskin 2002; Griffith and Luo 2017). This method adopts an Eulerian description of the momentum and continuity equations for fluid-structure systems, and a Lagrangian description of the deformation and stresses of the structure. The method was firstly introduced by (Griffith and Luo 2017), and also discussed in detail in our earlier work on esophageal transport model (Kou et al 2017). Hence, we provide only a brief description here. The governing equations are,
| (1) |
| (2) |
| (3) |
| (4) |
| (5) |
| (6) |
| (7) |
Eqs. (1) and (2) are the momentum equation and continuity equation, respectively, described in the Eulerian description. We assume that the immersed structure is of the same density, ρ and viscosity, μ as the fluid. This implies that the immersed structure is viscoelastic, rather than purely elastic. u and p are Eulerian velocity and pressure fields, respectively. Eqs. (3)-(6) are the fluid-structure interaction equations. fe and Fe are the Eulerian and Lagrangian elastic force densities, respectively. U denotes the reference configuration of the Lagrangian domain, whereas Ω denotes the Eulerian domain. Eq. (7) is the stress equation that depends on the material model of the immersed structure, where is the first Piola–Kirchhoff stress tensor associated with passive elasticity and active contraction of the immersed structure. In particular, we assume that an elastic potential exists that can characterize the passive and active mechanical properties of the immersed structure. We denote the elastic potential as Ψ, then
| (8) |
where, is the deformation gradient. Detailed derivation of the above IB-FE governing equations is provided in the appendix. More discussions related to numerical technique and implementation details can be found in the literature (Kou et al 2017; Griffith and Luo 2017). In the following section, we discuss only the details relevant to our bolus-esophageal-gastric model.
3. Bolus-esophageal-gastric model
3.1. Geometry
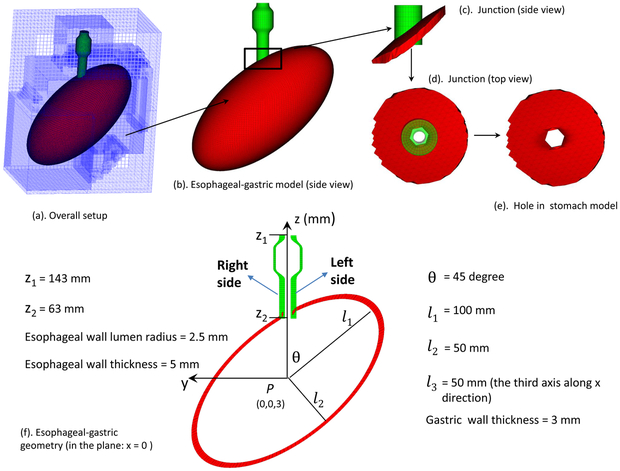
For simplicity, our model included only the distal esophagus, referred to as the esophageal segment, modeled as an 8-cm tube. The stomach was simplified as an ellipsoid as in (Roy et al 2012). The esophageal segment extended along the z-axis, from z= 143 mm to z= 63 mm, comprised of three layers: mucosa-submucosa (here collectively referred to as mucosa), circular muscle (CM), and longitudinal muscle (LM). The luminal radius was set at 2.5 mm at rest. The thickness of the mucosa, CM, and LM layers were 3 mm, 1 mm, and 1 mm, respectively, based on (Ghosh et al 2005, 2008). The bolus initially filled the upper end of the esophageal segment to simplify the modeling of bolus emptying. The initial geometry of the bolus was assumed to be a teardrop as in (Li and Brasseur 1993). The stomach is modeled as an ellipsoid with the center set as (0, 0, 3 mm) and its three axes, l1 = 100 mm, l2 = 50 mm, and l3 = 50 mm, respectively. The angle between the stomach’s major axis and the z-direction, anatomically referred to as the angle of His, was denoted as θ. Here θ is set to be 45 degree, within the range of experiment measurements (Roy et al 2012). The thickness of the stomach was 3 mm with a hole so that the stomach was connected to the esophageal segment to form the EGJ. The proximal end of the esophageal segment and the bottom of the stomach were fixed to account for external constraints. In order to use the IB-FE method, we immerse the esophageal segment and the stomach in a fluid box of dimensions, (−74 mm, 70 mm) × (−110 mm, 100 mm) × (−110 mm, 160 mm). A schematic of the overall setup is shown in Fig. 1.
Fig. 1.
Schematic of the computational domain for the bolus-esophageal-gastric model. The esophageal segment was connected to a hole of an ellipsoid-shaped stomach to form the EGJ. The LES was within the lower 30-mm of the esophageal segment, here referred to as the LES segment. The right (left) side of the LES segment is referred to as the part with a positive (negative) y-coordinate. The proximal part of the esophageal segment was initially filled with the bolus and the distal part with a thin liquid layer. The proximal end of the esophageal segment was fixed using the penalty method. The top surface of the rectangular computational domain had zero-velocity boundary conditions. All the other five surfaces had traction-free boundary conditions.
3.2. Material model
We modeled the bolus as a Newtonian fluid with a viscosity of 10 cP and density of 1 g/cm3 and assumed that the esophageal segment and the stomach were of the same viscosity and density as the bolus, implying that they were visco-elastic. We also needed to model the elastic properties of the esophageal segment and stomach, discussed below.
3.2.1. Esophagus: passive material model
For the esophageal segment, in-vitro experiments show that it can generally be characterized as a nonlinear anisotropic elastic or pseudo-elastic material. However, varied material models have been proposed among research groups (Yang et al 2006a,b; Natali et al 2009; Sokolis 2013; Stavropoulou et al 2009), in which the moduli of esophageal tissue vary from the order of tens of kPa to MPa. Recent in-vivo tests using the functional luminal imaging probe (FLIP) suggest that the modulus of esophageal tissue is likely at the order of kPa (Lin et al 2013). Based on that and our previous simulations (Kou et al 2017), we set the moduli of esophageal tissue layers at the order of kPa. Similar to our previous work (Kou et al 2017), we adopted the fiber-reinforced material model, in particular, the bi-linear model introduced by Yang et al. (Yang et al 2006a). To facilitate the derivation of the material model, we assumed that an elastic potential of the material exists, denoted as Ψ. It can be split into two parts: the elastic potential of the matrix Ψmatrix and the fiber Ψfiber. For our strain measurements, we let and denote the deformation gradient and the right Cauchy-Green tensor, respectively. is the first principle invariant of . The esophageal tube can be described in cylindrical coordinates s = (R, Θ, Z). We introduce the fiber angle to characterize the orientation of a family of fibers running in (Θ, Z) plane. The fiber angle is measured with respect to the circumferential orientation. Hence, if the fiber angle is α, then its fiber orientation is .
First is the mucosa (or mucosa-submucosa). Although the esophageal mucosa is generally considered to be a fiber-reinforced composite based on in-vitro experiments, the reported micro-structure and models vary among groups. Specifically, Sokolis (Sokolis 2013) reported that both elastin and collagen fibers were found in the mucosa and submucosa layer, with collagen fibers appearing as long wavy fibers in axial sections and fibers of shorten length in circumferential sections. They further proposed a material model with six families of fibers: two for elastin and four for collagen. Natali et al. (Natali et al 2009) reported that the mucosal layer was composed of connective tissue with collagen fibrils organized in a loose and random network. The submucosa consisted of two families of collagen fibers arranged as clockwise and anti-clockwise helices. Notably, the material model proposed in these two models are much stiffer than what has been observed in-vivo. During endoscopy, the collapsed lumen opens to a radius of several mm, under a minimal pressure. Clinical FLIP studies show that the stiffness of esophageal wall, especially the lateral stiffness, during distention is probably at the order of 100 Pa (or 1 mmHg). For example, in Figure 2 of Lin et al. (Lin et al 2013), the blue curve shows that pressure is close to zero, even when the esophageal lumen radius is around 3 mm (i.e. area is about 30 mm2) and luminal pressure is about 7 mmHg when the esophageal lumen radius is about 8 mm (i.e. area about 200 mm2). Hence, we adopt here a phenomenological approach to describe mechanical behavior of mucosa-submucosa based on in-vivo observations. As in our previous model on esophageal transport, here we consider the mucosal layer as a composite that is reinforced by a family of fibers along the axial direction. The material model is as below,
| (9) |
| (10) |
| (11) |
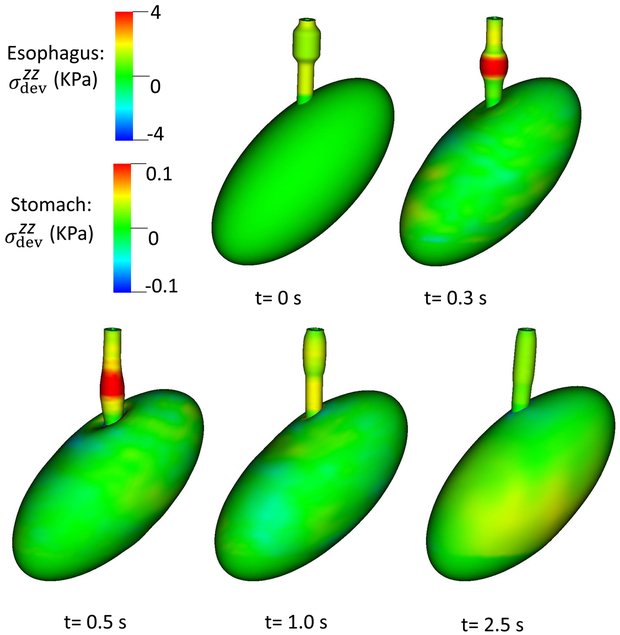
Fig. 2.
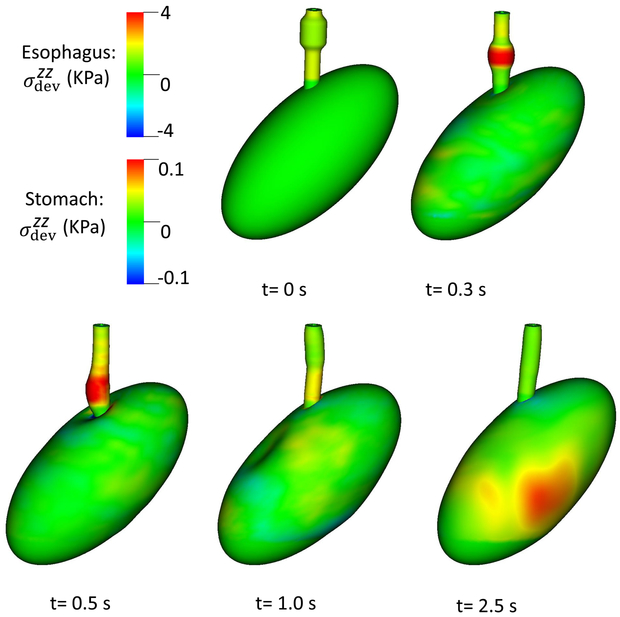
Overall deformation and axial stress of esophageal and gastric walls in for Case 1, the base case.
. because the fiber angle of the axial fibers in the mucosal layer is 90 degree (i.e. along the axial direction).
Within the family of fiber-reinforced material models, various forms of stress-strain relationships on esophageal muscle fibers have been proposed, such as the bi-linear form introduced by Yang et al. (Yang et al 2006a) and exponential form in (Natali et al 2009; Sokolis 2013). Here, we adopt the bi-linear form for simplicity. The discrepancy between a bi-linear model and an exponential model, depending on the parameters, will be likely large only when the structure is very largely deformed. In particular, the exponential model will yield more rapid increase of stress with the increase of stretch. For the CM layer, its material model is as below,
| (12) |
| (13) |
| (14) |
. . αCM is the fiber angle of the circular muscle fibers. λCM is the reference stretch ratio that is included to deal with circular muscle fiber contraction.
For the LM layer, its material model is as below,
| (15) |
| (16) |
| (17) |
. . αLM is the fiber angle of the longitudinal muscle fibers. Material parameters for the three layers are listed in Table 1.
Table 1.
Material parameters used in the passive material model of each esophageal layer.
| Material type | Material parameters | |||
|---|---|---|---|---|
| Mucosa | C0(kPa) | 0.4 | C1(kPa) | 0.4 |
| CM | C2(kPa) | 1.0 | C3(kPa) | 4.0 |
| αCM (Deg.) | 0 | |||
| LM | C5 (kPa) | 1.0 | C6(kPa) | 4.0 |
| αLM (Deg.) | 90 |
3.2.2. Esophagus: muscle activation
Two waves of muscle activation are involved in esophageal transport resulting in the sequential contraction and relaxation of CM and LM fibers (Pouderoux et al 1997; Mittal et al 2006). Motivated by the success and simplicity of our earlier model of muscle activation that worked by dynamically changing the reference stretch ratio of the corresponding muscle fibers, we did the same here. Specifically, let Z denote the vertical coordinate in the reference configuration of the esophageal segment. The distal end of the esophagus is at the origin Z = 0, and the proximal end is at Z = L. The reference stretch ratio of muscle fibers (λmuscle (Z, t); muscle = CM or LM) is given by,
| (18) |
where, c is propagation speed of the activation wave, t0 is the initiation time of activation, and ΔL is the contracting segment’s length in the reference configuration. Eq. (18) gives the reference stretch ratio of a fiber at rest, activation, and relaxation state, respectively. The equation also shows that the whole esophageal tube has a contracting segment with a vertical length ΔL, at any time. is referred to as the reduction ratio.
Esophageal emptying is associated with a pattern of muscle activation distinct from that of peristalsis in the more proximal esophagus (Kwiatek et al 2012). During esophageal emptying, the LES is initially stretched and elongated with the distal margin exhibiting an orad excursion averaging about 1.5 cm, indicative of prolonged axial shortening. This shortening also has the effect of stretching the relaxed LES segment. Following esophageal emptying, the stretched LES progressively contracts to its baseline length as the more proximal esophagus elongates (Kwiatek et al 2012). In contrast, during esophageal peristalsis, both CM contraction and LM shortening are sequential waves, with much less orad excursion evident at the distal margin of the esophagus. Consequently, in the current model we specified a propagating wave of CM contraction to propel the bolus similar to that in the previous model, but we specify a sustained LM contraction to reproduce the observed orad excursion at the distal margin during emptying. The parameters of the muscle activation model are listed in Table 2.
Table 2.
Model parameters for CM contraction and LM shortening. Here, we modeled CM contraction as a sequential traveling wave, but LM shortening as a sustained muscle activation wave along the whole esophageal segment.
| Muscle activation type | a0 | c (mm/s) | ΔL (mm) |
|---|---|---|---|
| CM contraction | 0.5 | 100 | 60 |
| LM shortening | 0.3 | 0 | 80 |
3.2.3. Esophagus: LES model
Anatomically, the LES can be considered a short distal segment of the esophagus with a sphincter mechanism composed of CM and LM that maintain a tonic contraction at rest functioning as an antireflux barrier. During swallowing, the LES relaxes to facilitate esophageal emptying. Functionally, the LES is best identified with manometry, there being no clear anatomic distinction between it and adjacent structures (Mittal and Balaban 1997). In terms of its passive material property, Ghosh et al. considered the LES segment to be stiffer than the adjacent esophageal segment (Ghosh et al 2008). In our model, we considered both passive and active properties of the LES. We refer to the distal 30 mm of the esophageal segment as the LES segment, and modeled the function of the LES by superposing an additional material model along the LES segment onto the material model for a typical esophageal segment. The additional material model included the passive property to account for the additional stiffness, and an active property to account for neurally controlled activation. For each tissue type, we characterized the mechanical property attributable to the LES by specifying an additional elastic potential,
| (19) |
where tissue = mucosa, CM, or LM. Ψtissue corresponds to the elastic potential of the tissue for a typical esophageal segment, given in Section 3.2.1. ΔΨtissue corresponds to the additional potential to account for the function (or additional mechanical property) of LES. For the mucosal layer in the LES segment,
| (20) |
For the CM layer in the LES segment,
| (21) |
| (22) |
| (23) |
where, . . αCM is the fiber angle of circular muscle fibers. ΔλCM is the reference stretch ratio that is included to deal with circular muscle fiber contraction. This is to model the LES resting tone.
For the LM layer in the LES segment,
| (24) |
| (25) |
| (26) |
where, . . αLM is the fiber angle of the longitudinal muscle fibers. ΔλLM is the reference stretch ratio that is included to deal with LM fiber contraction to model LES active resting tone.
Our current work focused on the LES. Hence, the above parameters of the LES model varied among cases as discussed in Section 4.
3.2.4. Stomach
Human stomach is a complicated structure with its material properties dependent on physiological conditions, location, direction, and layered structure (Roy et al 2012; Zhao et al 2008). In-vivo experiments show that the modulus of the gastric wall is on the order of several kPa for small deformations. For large deformations, the stiffness increases and the stress-strain curve is of an exponential form (Zhao et al 2008). In our model, the dynamics are mainly confined to the EGJ causing minimal gastric deformation. Hence, we adopt a simple neo-Hooken material model to consider the elasticity of the gastric wall expressed as,
| (27) |
This greatly simplified stomach model was used because the region of interest in this work was confined to the LES region. More refined models of structural mechanics can be found in the literature (Miftahof 2017; Carniel et al 2017).
3.3. Numerical parameters
Similar to our esophageal transport model, the bolus-esophageal-gastric model had multiple length scales. The modeled esophageal lumen was around 2.5 mm, while the stomach’s major axis was about 150 mm. We needed to resolve the esophageal lumen in order to achieve bolus transport. Here we used an adaptive fluid mesh with two levels. The mesh size of the finer level was set as hx = hy = hz = h = 1.5 mm. The mesh-size of the coarser level was 6 mm along x, y, and z directions. The esophageal segment was discretized by eight-node hexahedral finite elements. The number of elements for each esophageal layer is listed in Table 3. The gastric wall was discretized by six-node prism finite elements. We first used three-node triangle elements to discretize the surface of gastric wall, then protruded the surface to form the gastric wall. The mesh size for the gastric wall was around 3 mm. The time step Δt needed to satisfy stability constraints from both the fluid and solid systems. Based on empirical tests, we choose Δt = 0.1 ms. The total physical time for the simulation was about 2.5 s. The code was compiled based on IBAMR: An adaptive and distributed-memory parallel implementation of the immersed boundary method (Griffith and Luo 2017).
Table 3.
Grid number along (R, Θ, Z) orientations, denoted as (nR, nΘ, nZ), for each esophageal layer in the reference configuration.
| Grid number | Mucosa | CM | LM |
|---|---|---|---|
| nR | 2 | 1 | 1 |
| nΘ | 32 | 32 | 32 |
| nZ | 40 | 40 | 40 |
4. Results
Here we present three groups of studies using our fully-coupled model. The first group of studies was on the influence of a non-relaxing LES during esophageal emptying, the second group was on the influence of LES segment anisotropy, and the third group was on the influence of gastric wall and tissue property on the LES segment. In the first two groups, we put C7 = 2 (kPa) in the elastic model of the gastric wall (i.e. eq. (27)). In the third group, we vary the stiffness of the gastric wall.
4.1. Case study: what if the LES does not relax?
4.1.1. Case 1: esophageal emptying with a relaxed LES
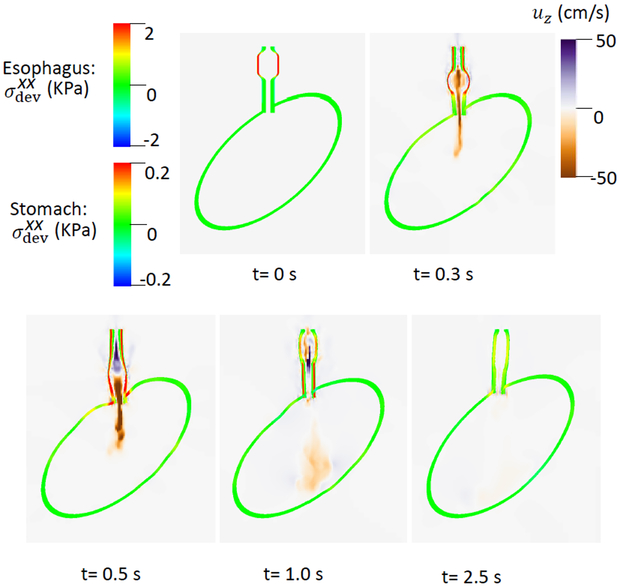
Case 1 was the base case in which the LES segment was a passively stiffer segment with no active tone in line with (Ghosh et al 2008). The parameters of the LES model are shown in Table 4, and the results are shown in Figs. 2 and 3. Fig. 2 shows the overall deformation and axial stress of esophageal and gastric walls. The esophageal segment had a large deformation, whereas the deformation of gastric wall was minimal, except near EGJ where the axial stress results from esophageal LM shortening.
Table 4.
Material parameters of the LES model in Case 1 (i.e. the base case).
| Material | Parameters | |||
|---|---|---|---|---|
| Mucosa | ΔC0(kPa) | 0.8 | ||
| CM | ΔC2(kPa) | 2.0 | ΔC3(kPa) | 0.0 |
| ΔλCM | 1.0 | |||
| LM | ΔC5(kPa) | 2.0 | ΔC6(kPa) | 0.0 |
| ΔλLM | 1.0 |
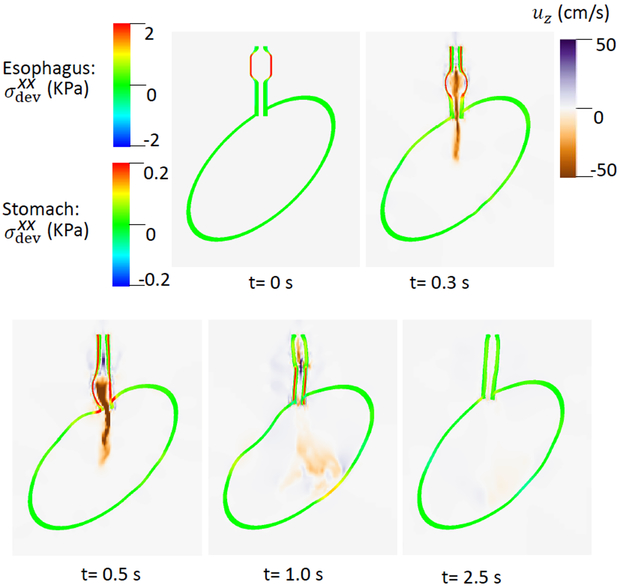
Fig. 3.
of the esophageal-gastric wall and the axial velocity held in the y-z plane in Case 1,the base case. Note that in the y-z plane, is also the deviatoric circumferential stress.
An axial stress results from LM shortening in the esophageal wall. Fig. 3 shows and the axial velocity of the bolus in the y-z plane. Notice that in the y-z plane is also the deviatoric circumferential stress resulting from esophageal CM contraction, which generates high luminal pressure and drives the bolus into the stomach, as seen in Fig. At 2.5 s, the CM contraction wave has passed the esophageal segment relaxes and esophageal emptying was good in this case.
4.1.2. Case 2: esophageal emptying with a non-relaxing LES
In Case 2, the LES is not relaxed, and the parameters for the LES model are shown in Table. 5. We included active tone in both the CM and LM layers by specifying a reference stretch ratio of less than 1.0. In Table. 5, is the Heaviside step function: and , if x ≥ 0. We included the Heaviside step function so that for the first two seconds the LES has a non-relaxing active tone.
Table 5.
Material parameters of the LES model in Case 2, a non-relaxed LES.
| Material | Parameters | |||
|---|---|---|---|---|
| Mucosa | ΔC0(kPa) | 0.8 | ||
| CM | ΔC2(kPa) | 2.0 | ΔC3(kPa) | |
| ΔλCM | 0.5 | |||
| LM | ΔC5(kPa) | 2.0 | ΔC6(kPa) | |
| ΔλLM | 0.5 |
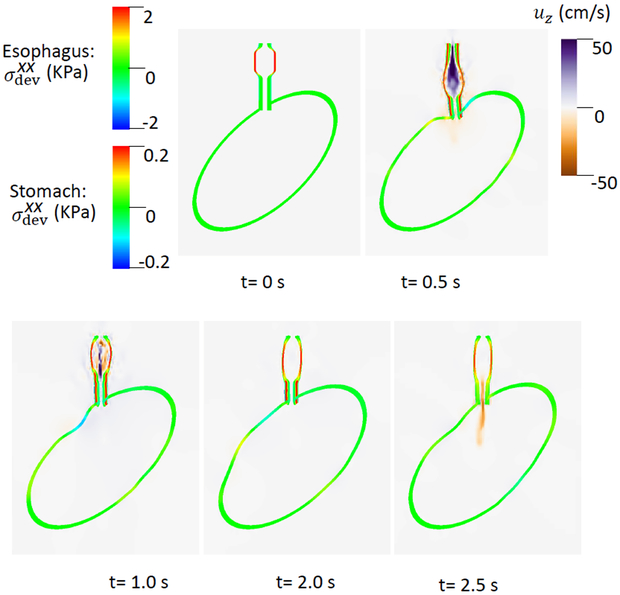
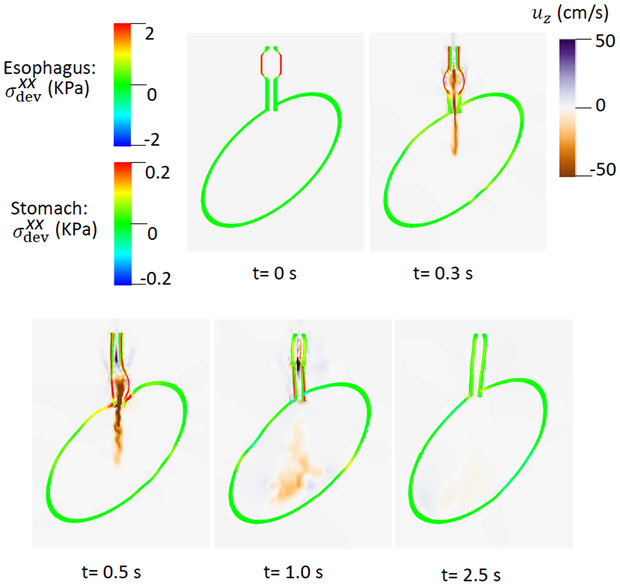
After two seconds, ΔC3 and ΔC6 became zero and the LES active tone vanished. As evident in Fig. 4, there was great circumferential stress along the LES segment during the first 2 seconds when the LES active tone was not relaxed and no apparent emptying occurred. In contrast, at time = 2.5 second, the circumferential stress vanished as the LES relaxed, and a large amount of emptying occurred. Cases 1 and 2 demonstrate the importance of LES relaxation during bolus emptying.
Fig. 4.
of the esophageal-gastric wall and the axial velocity held in the y-z plane in Case 2, a non-relaxed LES.
4.2. Case study: influence of tissue anisotropy
Tissue remodeling may result from factors such as tissue erosion from acidic reflux or surgery. Here we considered cases of asymmetrical changes in LES segment compliance. In Case 3, the right side of the LES segment became more compliant; in Case 4, the left side became more compliant. Note that we included only the passive property of the LES model, not active tone, to make it comparable with the base case (i.e. Case 1).
4.2.1. Case 3: right side of the LES is compliant
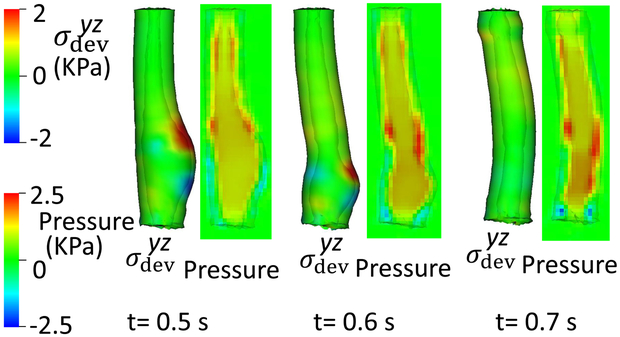
The material parameters for Case 3 with increased compliance on the right side of the LES segment, referred to here as a right-compliant LES, are shown in Table 6. We modeled this by specifying a spatially step-wise modulus in the LES model. Note that the right side had a positive y-coordinate, as seen in Fig. 1. Hence, on the right side of the LES segment (i.e. y > 0), . On the left side of the LES segment (i.e. y < 0), kPa. Simulation results are shown in Figs. 5 and 6. Evident in Fig. 5, when the moving bolus filled the LES segment (t = 0.5 s), the weaker part exhibited greater deformation. The axial velocity shown in Fig. 6 suggests that the weak side empties a larger fraction of the bolus.
Table 6.
Material parameters of the LES model in Case 3, a right-compliant LES.
| Material | Parameters | |||
|---|---|---|---|---|
| Mucosa | ΔC0(kPa) | 0.8 | ||
| CM | ΔC2(kPa) | ΔC3(kPa) | 0.0 | |
| ΔλCM | 1.0 | |||
| LM | ΔC5(kPa) | ΔC6(kPa) | 0.0 | |
| ΔλLM | 1.0 |
Fig. 5.
Overall deformation and axial stress of the esophageal and gastric walls in Case 3, a right-compliant LES.
Fig. 6.
of the esophageal-gastric wall and the axial velocity held in the y-z plane in Case 3, a right-compliant LES.
4.2.2. Case 4: left side of the LES is compliant
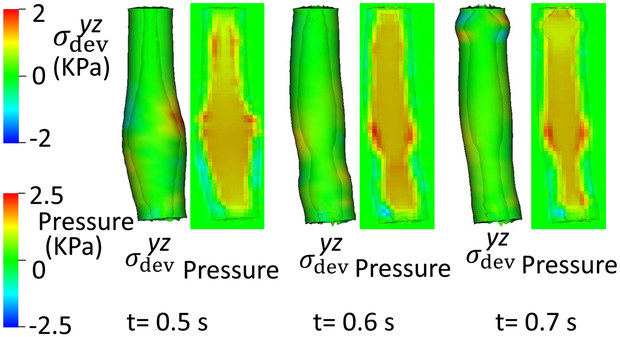
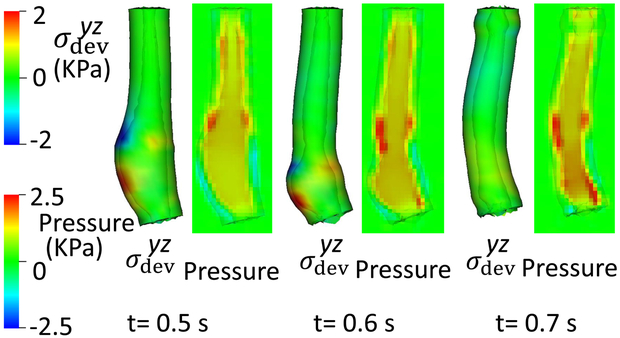
In Case 4, parameters shown in Table 7, the left side of the LES segment was weaker, referred to as a left-compliant LES. Compared with Case 3, we set ΔC2 = ΔC5 = 0 on the left side of the LES segment, on the right side. Similar to Case 3, the weaker side shows greater deformation when the bolus filled the LES segment (Fig. 7) and again, the weaker part seemed to empty a greater fraction of bolus suggesting that the weaker side likely sustained greater pressure loading during emptying. To further examine that, we plotted the esophageal wall deformation and luminal pressure for Cases 1, 3, and 4 when a large amount of bolus transited LES segment (Fig. 8). Evident in the figure, the weaker (i.e. more compliant) side of LES segment sustains not only greater deformation, but also a greater pressure load during bolus transit. Since weaker tissue sustaining a greater pressure load tends to become weaker yet, this implies that asymmetrical compliance might lead to degradation cycles, becoming increasingly asymmetrical and potentially leading to diverticulum formation (Tedesco et al 2005).
Table 7.
Material parameters of the LES model in Case 4, a left-compliant LES.
| Material | Parameters | |||
|---|---|---|---|---|
| Mucosa | ΔC0(kPa) | 0.8 | ||
| CM | ΔC2(kPa) | ΔC3(kPa) | 0.0 | |
| ΔλCM | 1.0 | |||
| LM | ΔC5(kPa) | ΔC6(kPa) | 0.0 | |
| ΔλLM | 1.0 |
Fig. 7.
of the esophageal-gastric wall and the axial velocity held in the y-z plane in Case 4, a left-compliant LES.
Fig. 8.
Esophageal wall deformation and pressure field when the bolus transits the LES segment, (a) Case 1: the base case; (b) Case 3: a right-compliant LES; (c) Case 4: a left-compliant LES.
4.3. Case study: influence of anatomy, the gastric wall stiffness, and the LES stiffness
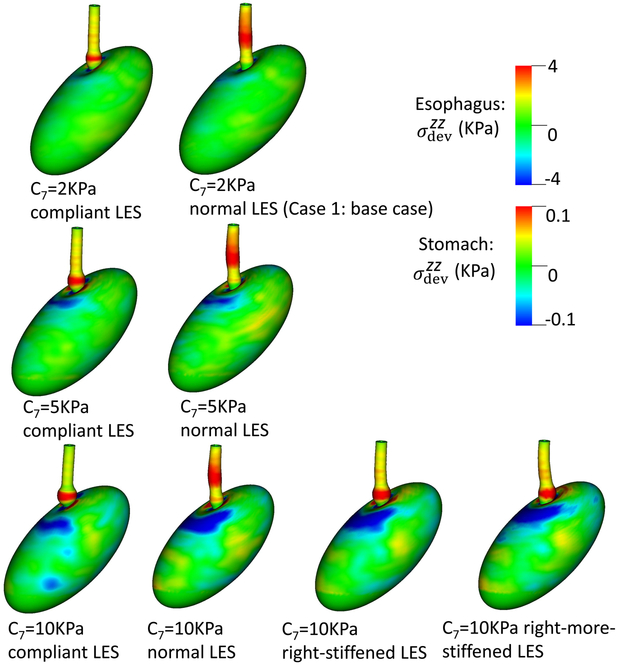
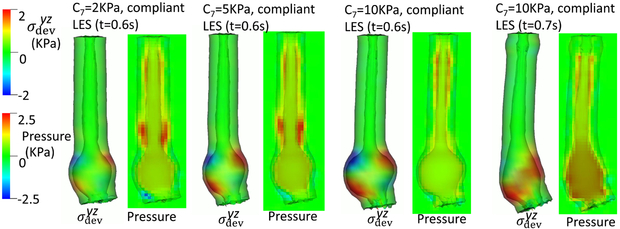
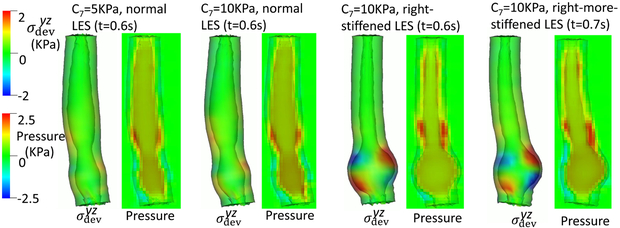
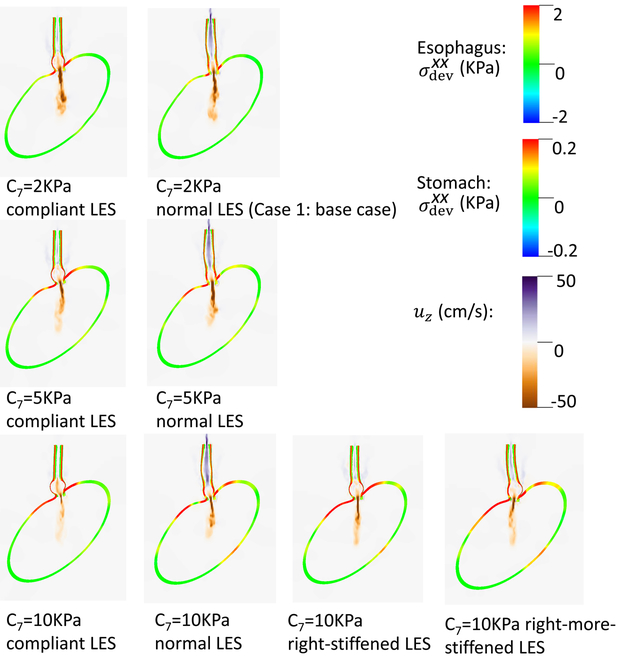
The third group of studies pertained to bulge development consequent from asymmetrical anatomy of the EGJ. In these studies, we varied the material properties of the gastric wall and LES segment. For the material property of the gastric wall, we considered three cases: C7 = 2 (kPa), C7 = 5 (kPa), and C7 = 10 (kPa). For the material property of the LES segment, we consider four cases: normal, a compliant LES, a right-stiffened LES where the right-side of the LES is slightly stiffened, and a right-more-stiffened LES where the right-side of the LES is greatly stiffened. The normal LES is the same as in Case 1. The other three cases differ in ΔC2 and ΔC5, as shown in Table 4.
Figs. 9- 11 illustrate the results of these simulations. With a compliant LES, a right-sided bulge was seen at time = 0.6 s and was most pronounced in the case with C7 = 10 kPa (i.e. the stiffest gastric wall). However, if the LES was normal (i.e. with a high passive stiffness), no bulge was seen. This implies that a stiff LES segment improves the ability to sustain a biased load from asymmetric anatomy, whereas a stiff gastric wall exacerbates the effect of a biased load on the esophageal segment during emptying. This might explain why a right-sided bulge is clinically more common. This might also suggest that increasing the stiffness on right-side of the LES may have favorable impact. Figs. 9- 11 show that a slight increase of stiffness on the right-side of LES (i.e. a right-stiffened LES) might help to reduce the right bulge. But a great increase (i.e. a right-more-stiffened LES) might lead to a bulge on the left. In conclusion, anatomical factors could play a role for bulge development by the opposing effects of stiffness in the LES segment and gastric wall.
Fig. 9.
Overall deformation and the axial stress of the esophageal and gastric wall at time = 0.6 second for different cases.
Fig. 11.
Esophageal wall deformation and pressure field when the bolus fills the LES segment for different cases.(a): Cases with a compliant LES; (b): Cases with a normal, right-stiffened, or right-more-stiffened LES.
5. Conclusions
In conclusion, we developed a fully-coupled bolus-esophageal-gastric model to study esophageal emptying based on the IB-FE method. The model included an esophageal segment, an ellipsoid-shaped stomach, and a bolus. We also devised a simple model to include the passive and active sphincteric function of the LES. In the first group of studies, we found that a non-relaxing LES led to high sustained wall stress along the LES segment during emptying and obstruction of bolus emptying. The second group of simulations showed that tissue anisotropy, manifested by asymmetrical compliance on the right and left sides of the LES segment, resulted in greater deformation, and greater wall shear stress during bolus transit through the LES segment. More importantly, this resulted in a greater pressure load on the weaker side suggesting that a degradation cycle might then ensue leading to epiphrenic diverticulum formation. The third group of simulations focused on the effect of asymmetrical anatomy and compliance of the LES on the development of a bulge in the esophageal wall. These simulations found that a right-sided bulge tended to develop with a compliant LES and that this was most pronounced with increased stiffness of the gastric wall, implying opposing effects between the LES and gastric wall stiffness and suggesting another factor related to the formation of epiphrenic diverticula.
The current model has limitations. First, it does not consider the influence of other EGJ structures, specifically the crural diaphragm and proximal stomach that includes clasp and sling muscle fiber complex. Based on intraluminal ultrasound and micro-computed tomography studies, Vegesna et al. suggest these structures to be crucial to the EGJ anti-reflux mechanism (Vegesna et al 2013). Secondly, we simplify the process of bolus transport by beginning with the bolus in the esophageal segment and beginning to move once the muscle activation wave begins. In more realistic physiological conditions, the bolus is initially propelled distally by the oropharyngeal swallow and then decelerates in the distal esophagus prior to the onset of the esophageal contraction wave (peristalsis). Third, we specify a sequential CM contraction wave with a propagation velocity greater than observed in clinically in order to reduce computational costs. However, we remark that this is our first attempt to have a fully-coupled bolus-esophageal-gastric model with a minimal number of physical parameters. Fourth, we assume the esophagus to be a hollow circular cylindrical tube with finite radius at rest. However, the actual anatomy is more complex with a highly collapsed lumen, curvature, and regional variation in thickness. Applying the model to specific subjects or specific disease states will need to be subject-specific to better understand the related pathophysiology. This will be a future direction of research.
Fig. 10.
of the esophageal-gastric wall and the axial velocity held at time = 0.6 second in the y-z plane, for different cases.
Table 8.
ΔC2 and ΔC5 for the four cases of the LES model used in Section 4.3. Other parameters of the LES model are the same as in Table 4 far Case 1 which is the base case.
| Cases | Normal LES |
Compliant LES |
Right-stiffened LES |
Right-more-stiffened LES |
|---|---|---|---|---|
| ΔC2(kPa) | 2.0 | 0 | ||
| ΔC5(kPa) | 2.0 | 0 |
Acknowledgments
Funding This work was supported by Public Health Service grants DK079902 (to J.E.P.) and DK056033 (to P.J.K).
Appendix: Mathematical description of IB-FE governing equations
Here, we provide detailed derivation of the IB-FE governing equations that are introduced in Section 2. Let x = (x1, x2, …) ∈ Ω denote fixed Cartesian coordinates. , d = 2 or 3, denotes the fixed domain occupied by the entire fluid-structure system. We use s = (s1, s2, …) ∈ U to denote the Lagrangian coordinates attached to the immersed structure, where U denotes the Lagrangian domain in the reference configuration. We let χ(s, t) ∈ Ω denote the physical position of material point s at time t. We denote the physical region occupied by the structure and fluid at time t as Ωs(t) = χ(U, t) ⊆ Ω and Ωf(t) = Ω \ Ωs(t), respectively. Since we consider here that the structure is immersed in the fluid, the fluid-structure interface can be denoted as ∂Ωs(t). The boundary of the whole domain, Ω is denoted as ∂Ω. Also, we consider that the fluid-structure system possesses a uniform mass density ρ, and a uniform dynamic viscosity μ. This simplification implies that the immersed structure is neutrally buoyant and viscoelastic rather than purely elastic. Then, the governing equations in the fluid domain, Ωf(t) are,
| (28) |
| (29) |
where σf is the fluid stress.
We consider the immersed structure is incompressible, whose stress is denoted as σs. Thus, governing equations in the structure domain, Ωs(t) are
| (30) |
| (31) |
The interface conditions on the fluid-structure interface, ∂Ωs(t) are
| (32) |
| (33) |
where n is the outward normal unit vector to ∂Ωs(t), outward being away from the domain Ωs(t) of the structure. The idea of the immersed boundary method is to separate the “fluid-like” components in the governing equations of the structure domain. Therefore, we rewrite eq. (30) as below,
| (34) |
where is the “fluid-like” stress that takes the same constitutive law as the fluid stress, σf. .
fs is introduced to denote all the right-hand side of eq. (34).
At the fluid-structure interface, eq. (32) can also be written as
| (35) |
where σf is the fluid stress in the fluid side, and is the “fluid-like” stress in the solid side.
We introduce a global velocity field, u(x, t), such that u(x, t)∣Ωf(t) = uf(x, t), and u(x, t)∣Ωs(t) = us(x, t). u(x, t) is continuous based on eq. (33). We consider the fluid as an incompressible Navier-Stokes fluid and the structure as incompressible visco-elastic material, then
| (36) |
| (37) |
| (38) |
where p is the pressure to enforce the incompressibility condition, σe the elastic stress in the structure. Then, we obtain below governing equations, in which we omit the dependency of u and p on (x, t) for brevity.
In the entire domain, Ω
| (39) |
| (40) |
where fs∣Ωs(t) is only non-zero in the structure domain, Ωs(t).
At the fluid-structure interface, ∂Ωs(t)
| (41) |
| (42) |
In the structure domain, Ωs(t)
| (43) |
Above equations show that the structure influences the fluid system through two forcing terms: ∇ · σe in the structure domain, and σe · n at the interface. Utilizing the delta function to transfer the structural influences from the Lagrangian system to the Eulerian system, we obtain the immersed boundary formulation as below (See more rigorous derivation in (Kou et al 2017)).
In the entire domain, Ω
| (44) |
| (45) |
| (46) |
where δ(x) is the d-dimensional delta function. fe is referred to as the Eulerian force density that is none-zero in the structural domain only. σe is the elastic stress that depends on the specific material model of the structure.
It is convenient to use the first Piola-Kirchhoff stress tensor to describe the stress of the Lagrangian structure. The first Piola-Kirchhoff stress tensor is defined as below.
| (47) |
for any smooth region V ⊂ U. N and n are the outward unit normal along ∂V and χ(V, t), respectively. Based on the divergence theorem, eq. (47) also implies,
| (48) |
To facilitate the communication between the Eulerian variables and the Lagrangian variables, we also introduce the Lagrangian force density, Fe, as below,
| (49) |
Fe needs to include both the internal and transmission force density. Substitute eqs. (47)-(48) into eq. (46), and employ the weak form to obtain,
| (50) |
for any Lagrangian test function V(s) defined on U. Notice that eq. (50) is also a projection, which projects the Lagrangian force density Fe(s, t) into the function space defined by V(s). Thus, to obtain the Lagrangian velocity field of the structure from the Eulerian velocity field, we utilize a similar projection as below,
| (51) |
| (52) |
where Ue(s, t) is an intermediate Lagrangian velocity field. The final Lagrangian velocity field is a projection of the intermediate Lagrangian velocity field into the function space defined by V(s).
Based on eqs. (49)-(52), and previous eqs. (44) and (45), we obtain the IB-FE governing equations that are introduced in Section 2.
| (53) |
| (54) |
| (55) |
| (56) |
| (57) |
| (58) |
| (59) |
where, eq. (59) is the elastic stress equation that computes based on the material model of the structure. The above equations are solved based on a coupled finite-element/finite difference method. Details can be found in the literature (Kou et al 2017; Griffith and Luo 2017).
Footnotes
Conflicts of Interest John E. Pandolfino discloses consulting and educational association with Medtronic, Sandhill Scientific and Ironwood Pharmaceuticals, and stock options with Crospon. Wenjun Kou, Peter J. Kahrilas and Neelesh A. Patankar declare that they have no conflict of interest.
Contributor Information
Wenjun Kou, Department of Medicine, Feinberg School of Medicine, Northwestern University, 676 North Saint Clair Street, 14th Floor, Chicago, Illinois 60611, USA.
John E. Pandolfino, Department of Medicine, Feinberg School of Medicine, Northwestern University, 676 North Saint Clair Street, 14th Floor, Chicago, Illinois 60611, USA
Peter J. Kahrilas, Department of Medicine, Feinberg School of Medicine, Northwestern University, 676 North Saint Clair Street, 14th Floor, Chicago, Illinois 60611, USA
Neelesh A. Patankar, Department of Mechanical Engineering, Northwestern University, 2145 Sheridan Road, Evanston, Illinois 60208, USA, Tel.: 847-491-3021, Fax: 847-491-3915, n-patankar@northwestern.edu
References
- Brasseur JG, Ulerich R, Dai Q, Patel DK, Soliman A, Miller LS (2007) Pharmacological dissection of the human gastro-oesophageal segment into three sphincteric components. The Journal of physiology 580(3):961–975 [DOI] [PMC free article] [PubMed] [Google Scholar]
- Carniel EL, Frigo A, Fontanella CG, De Benedictis GM, Rubini A, Barp L, Pluchino G, Sabbadini B, Polese L (2017) A biomechanical approach to the analysis of methods and procedures of bariatric surgery. Journal of biomechanics 56:32–41 [DOI] [PubMed] [Google Scholar]
- Ghosh SK, Kahrilas PJ, Zaki T, Pandolfino JE, Joehl RJ, Brasseur JG (2005) The mechanical basis of impaired esophageal emptying postfundoplication. American Journal of Physiology-Gastrointestinal and Liver Physiology 289(1):G21–G35 [DOI] [PubMed] [Google Scholar]
- Ghosh SK, Kahrilas PJ, Brasseur JG (2008) Liquid in the gastroesophageal segment promotes reflux, but compliance does not: a mathematical modeling study. American Journal of Physiology-Gastrointestinal and Liver Physiology 295(5):G920–G933 [DOI] [PMC free article] [PubMed] [Google Scholar]
- Griffith BE, Luo X (2017) Hybrid finite difference/finite element immersed boundary method. International Journal for Numerical Methods in Biomedical Engineering 33(12):e2888–n/a, DOI 10.1002/cnm.2888 [DOI] [PMC free article] [PubMed] [Google Scholar]
- Kou W, Griffith BE, Pandolfino JE, Kahrilas PJ, Patankar NA (2017) A continuum mechanics-based musculo-mechanical model for esophageal transport. Journal of Computational Physics 348(Supplement C):433 – 459 [DOI] [PMC free article] [PubMed] [Google Scholar]
- Kwiatek MA, Nicodème F, Pandolfino JE, Kahrilas PJ (2012) Pressure morphology of the relaxed lower esophageal sphincter: the formation and collapse of the phrenic ampulla. American Journal of Physiology-Gastrointestinal and Liver Physiology 302(3):G389–G396 [DOI] [PMC free article] [PubMed] [Google Scholar]
- Li M, Brasseur JG (1993) Non-steady peristaltic transport in finite-length tubes. Journal of Fluid Mechanics 248:129–129 [Google Scholar]
- Lin Z, Nicodème F, Boris L, Lin CY, Kahrilas PJ, Pandolfino JE (2013) Regional variation in distal esophagus distensibility assessed using the functional luminal imaging probe (flip). Neurogastroenterology & Motility 25(11) [DOI] [PMC free article] [PubMed] [Google Scholar]
- Lin Z, Yim B, Gawron A, Imam H, Kahrilas PJ, Pandolfino JE (2014) The four phases of esophageal bolus transit defined by high-resolution impedance manometry and fluoroscopy. American Journal of Physiology-Gastrointestinal and Liver Physiology 307(4):G437–G444 [DOI] [PMC free article] [PubMed] [Google Scholar]
- Miftahof RN (2017) Biomechanics of the human stomach. Springer [Google Scholar]
- Mittal RK, Balaban DH (1997) The esophagogastric junction. New England Journal of Medicine 336(13):924–932 [DOI] [PubMed] [Google Scholar]
- Mittal RK, Padda B, Bhalla V, Bhargava V, Liu JM (2006) Synchrony between circular and longitudinal muscle contractions during peristalsis in normal subjects. American Journal of Physiology-Gastrointestinal and Liver Physiology 290(3):G431–G438 [DOI] [PubMed] [Google Scholar]
- Natali AN, Carniel EL, Gregersen H (2009) Biomechanical behaviour of oesophageal tissues: Material and structural configuration, experimental data and constitutive analysis. Medical Engineering & Physics 31(9):1056–1062 [DOI] [PubMed] [Google Scholar]
- Pandolfino JE, Kwiatek MA, Nealis T, Bulsiewicz W, Post J, Kahrilas PJ (2008) Achalasia: a new clinically relevant classification by high-resolution manometry. Gastroenterology 135(5):1526–1533 [DOI] [PMC free article] [PubMed] [Google Scholar]
- Peskin CS (2002) The immersed boundary method. Acta numerica 11:479–517 [Google Scholar]
- Pouderoux P, Lin S, Kahrilas PJ (1997) Timing, propagation, coordination, and effect of esophageal shortening during peristalsis. Gastroenterology 112(4):1147–1154 [DOI] [PubMed] [Google Scholar]
- Roy S, Fox M, Curcic J, Schwizer W, Pal A (2012) The gastro-esophageal reflux barrier: biophysical analysis on 3d models of anatomy from magnetic resonance imaging. Neurogastroenterology & Motility 24(7):616–e269 [DOI] [PubMed] [Google Scholar]
- Soares R, Herbella FA, Prachand VN, Ferguson MK, Patti MG (2010) Epiphrenic diverticulum of the esophagus. from pathophysiology to treatment. Journal of Gastrointestinal Surgery 14(12):2009–2015 [DOI] [PubMed] [Google Scholar]
- Sokolis DP (2013) Structurally-motivated characterization of the passive pseudo-elastic response of esophagus and its layers. Computers in Biology and Medicine 43(9):1273–1285 [DOI] [PubMed] [Google Scholar]
- Stavropoulou EA, Dafalias YF, Sokolis DP (2009) Biomechanical and histological characteristics of passive esophagus: Experimental investigation and comparative constitutive modeling. Journal of Biomechanics 42(16):2654–2663 [DOI] [PubMed] [Google Scholar]
- Tedesco P, Fisichella PM, Way LW, Patti MG (2005) Cause and treatment of epiphrenic diverticula. The American Journal of Surgery 190(6):902–905 [DOI] [PubMed] [Google Scholar]
- Vegesna AK, Sloan JA, Singh B, Phillips SJ, Braverman AS, Barbe MF, Ruggieri MR, Miller LS (2013) Characterization of the distal esophagus high-pressure zone with manometry, ultrasound and micro-computed tomography. Neurogastroenterology & Motility 25(1):53–e6 [DOI] [PMC free article] [PubMed] [Google Scholar]
- Yang W, Fung TC, Chian KS, Chong CK (2006a) 3D mechanical properties of the layered esophagus: experiment and constitutive model. Journal of Biomechanical Engineering 128(6):899–908 [DOI] [PubMed] [Google Scholar]
- Yang W, Fung TC, Chian KS, Chong CK (2006b) Directional, regional, and layer variations of mechanical properties of esophageal tissue and its interpretation using a structure-based constitutive model. Journal of Biomechanical Engineering 128(3):409–418 [DOI] [PubMed] [Google Scholar]
- Yassi R, Cheng L, Rajagopal V, Nash M, Windsor J, Pullan A (2009) Modeling of the mechanical function of the human gastroesophageal junction using an anatomically realistic three-dimensional model. Journal of Biomechanics 42(11):1604–1609 [DOI] [PMC free article] [PubMed] [Google Scholar]
- Zhao J, Liao D, Chen P, Kunwald P, Gregersen H (2008) Stomach stress and strain depend on location, direction and the layered structure. Journal of Biomechanics 41(16):3441–3447 [DOI] [PubMed] [Google Scholar]


