Abstract
Epileptic networks are characterized by two outputs: brief interictal spikes and rarer, more prolonged seizures. Although either output state is readily modeled in silico and induced experimentally, the transition mechanisms are unknown, in part because no models exhibit both output states spontaneously. In silico small-world neural networks were built using single-compartment neurons whose physiological parameters were derived from dual whole-cell recordings of pyramidal cells in organotypic hippocampal slice cultures that were generating spontaneous seizure-like activity. In silico, neurons were connected by abundant local synapses and rare long-distance synapses. Activity-dependent synaptic depression and gradual recovery delimited synchronous activity. Full synaptic recovery engendered interictal population spikes that spread via long-distance synapses. When synaptic recovery was incomplete, postsynaptic neurons required coincident activation of multiple presynaptic terminals to reach firing threshold. Only local connections were sufficiently dense to spread activity under these conditions. This coalesced network activity into traveling waves whose velocity varied with synaptic recovery. Seizures were comprised of sustained traveling waves that were similar to those recorded during experimental and human neocortical seizures. Sustained traveling waves occurred only when wave velocity, network dimensions, and the rate of synaptic recovery enabled wave reentry into previously depressed areas at precisely ictogenic levels of synaptic recovery. Wide-field, cellular-resolution GCamP7b calcium imaging demonstrated similar initial patterns of activation in the hippocampus, although the anatomical distribution of traveling waves of synaptic activation was altered by the pattern of synaptic connectivity in the organotypic hippocampal cultures.
SIGNIFICANCE STATEMENT When computerized distributed neural network models are required to generate both features of epileptic networks (i.e., spontaneous interictal population spikes and seizures), the network structure is substantially constrained. These constraints provide important new hypotheses regarding the nature of epileptic networks and mechanisms of seizure onset.
Keywords: epilepsy, ictogenesis, model, propagation, seizure, wavefront
Introduction
Epilepsy is a disease characterized by an increased probability of seizures and brief, interictal population spikes (Tao et al., 2005; Karoly et al., 2016; Hassan et al, 2017). Thus, to understand epilepsy, we need to know the mechanisms by which epileptic networks transition between two output states: interictal spiking and the generation of seizure activity (Jouny et al., 2005; Blauwblomme et al., 2014; Staley, 2015; Milanowski and Suffczynski, 2016). The most widely accepted mechanistic hypothesis is a shift in the balance of excitation and inhibition (Dichter and Ayala, 1987; Treiman, 2001). This idea is based on classic pharmacological experiments (Matsumoto and Marsan, 1964; Ayala et al., 1973), but the inhibitory-to-excitatory shift is a statement of a potentially necessary experimental condition, not a mechanism (Staley, 2015), and recent modeling suggests that a homogeneous reduction in this ratio cannot explain all the behaviors of pathological networks (O'Donnell et al., 2017).
Ictogenesis (i.e., the transition from the interictal to ictal state) is difficult to study. Seizures are so named because these state transitions are abrupt, infrequent, and unpredictable. This makes them unsuitable for study with modern cellular activity-dependent imaging techniques (Muldoon et al., 2015). Conceptual computational models of epileptic neural networks can serve as important tools for understanding ictogenesis (O'Leary et al., 2015) because all network parameters at the time of ictogenesis can be stored and then studied in detail.
Sophisticated computational models of epileptic behavior have been developed (Lytton, 2008; Wendling et al., 2016). One class of computer models is exemplified by Epileptor. This class of models produces oscillating output based on small sets of differential equations (Jirsa et al., 2014; Naze et al., 2015; Cowan et al., 2016). Interictal-to-ictal transitions are driven by changes in noise input and/or the value of slowly changing variables. These models provide important insights into theoretical aspects of interictal-to-ictal transitions. The strength of these models is the condensation of massive numbers of network features into a handful of variables. This condensation enables important theoretical insights but also limits the degree to which these models can guide experimental studies of synaptic mechanisms of ictogenesis (O'Leary et al., 2015).
In distributed computer models, individual neurons are modeled and connected into networks (Traub and Miles, 1991; Markram et al., 2015). These models permit the study of the effect of network topology on the excitability of biophysically realistic distributed neural networks (Santhakumar et al., 2005; Morgan and Soltesz, 2008; Sabolek et al., 2012). Transitions between interictal spiking and ictal states have not been systematically studied using distributed neural networks. Changes in external stimuli drove transitions from burst to tonic mode in a computational model of the thalamus (Barardi et al., 2016). Reduction in excitatory strength drove the emergence of seizure-like activity in a distributed model of cortical networks (van Drongelen et al., 2005, 2007; Barardi et al, 2016). In these studies, ictal transitions occurred after alterations of model parameters or inputs; the network activity itself does not trigger spontaneous seizures. Brain states and network inputs change in vivo, so these are realistic approaches. However, interictal-to-ictal transitions can occur in the absence of state changes and external inputs, for example, in isolated preparations (Buzsáki et al., 1989; Gutnick et al., 1989; McBain et al., 1989; Dyhrfjeld-Johnsen et al., 2010; Berdichevsky et al., 2012), and we adopted this approach to gain a more general insight into interictal-to-ictal transitions.
The current work is a proof-of-concept study to test whether spontaneous transitions between interical spiking and ictal activity can occur in a distributed neural network model in the absence of external input (i.e., simply as a consequence of ongoing activity at synapses that undergo activity-dependent depression and recovery) (Dobrunz and Stevens, 1997; Staley et al., 1998, 2001). Rewiring of neuronal circuits is a well-established mechanism of epilepsy following brain trauma (Tauck and Nadler, 1985; Prince et al., 2012), but the details of the connectivity engendered by this rewiring are largely unknown. We therefore simulated different synaptic connectivity strategies to determine whether there were particular connectomes that were more likely to engender spontaneous transitions between interictal and ictal activity.
A variety of wiring strategies can be used to connect neurons (Behrens and Sporns, 2012; Alivisatos et al., 2013; Oh et al., 2014; Reimann et al., 2015). Small-world connectivity, in which most connections are local and some are long-distance, has been most frequently associated with epilepsy (Netoff et al., 2004; Kitano and Fukai, 2007; Lillis et al., 2015). Alternative connectivity strategies include scale-free (most neurons have few connections, but a minority, termed hub cells, have many), local (all connections are to near neighbors), and random (no effect of distance on connectivity probability) (Feldt et al., 2011; Bullmore and Sporns, 2012). In this proof-of-concept study, interactions between synaptic properties (strength, activity-dependent depression, and recovery), synaptic connectivity, and network dimensions drove interictal-to-ictal transitions.
Materials and Methods
Network architecture.
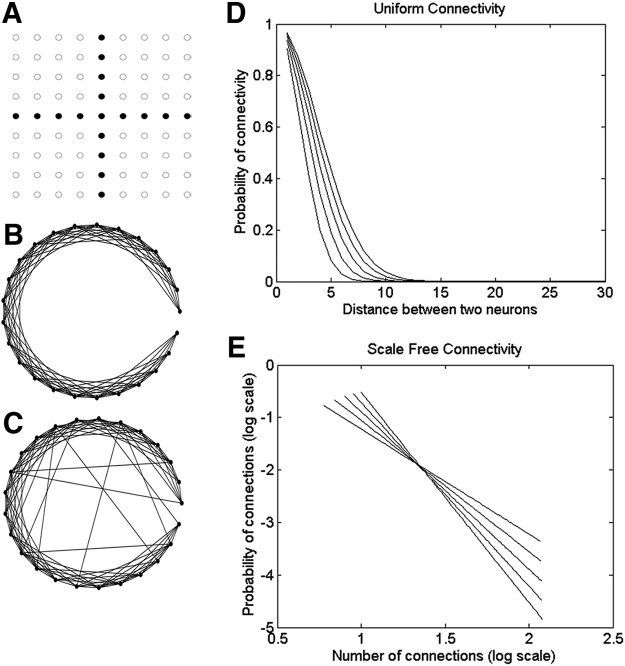
The model is a 2D single-layer neural network that approximates the sprouted hippocampal slice culture. In this preparation, there are ∼10,000 neurons (Liu et al., 2017). The network therefore consisted of 10,000 neurons spread over a 100 × 100 grid, of which 9600 are pyramidal neurons, interspersed with 400 interneurons. Principal cell and interneuron subtypes were not distinguished. The interneurons are distributed uniformly over the network, and the pattern of synaptic connections between them depends on the connectivity scheme adopted. The synaptic strengths, or weights, for all synapses are chosen at random from a uniform distribution between 0 and 1, and were not changed during the simulations. An exemplary fraction of the network, sans connections, is shown in Figure 1A.
Figure 1.
Network architectures. A, Example of a fraction of the 100 × 100 neuron network. Black nodes represent inhibitory neurons. White nodes represent excitatory neurons. Connections between neurons depend on connectivity pattern adopted. However, there are no recurrent connections between inhibitory neurons. B, C, Differences in uniform versus small-world connectivity patterns. A circular distribution of neurons is used for purposes of illustration. B, Uniform connectivity model, where the connection probability drops exponentially with distance (measured in numbers of neurons from source). C, Small-world connectivity model where 10% of connections are long range. D, Connection probability versus distance for the uniformly connected networks that were tested. E, Scale-free network curves that were tested, showing the number of connections versus number of neurons in log scale.
Network connectivity.
In 130 paired whole-cell recordings from hippocampal slice cultures, 11% of the neurons were synaptically coupled (Table 1). Because the pairs were tested for connectivity in either direction (i.e., 260 connections were tested), this represents a connectivity probability of 6%. In a network of 10,000 cells, this represents ∼600 synaptic connections per neuron, which is close to what was found in more detailed studies of cortical neurons (Markram et al., 2015). Simulating the full complement of neuronal connections would entail 10,000 neurons × 600 connections/neuron. This would require 6 million synaptic updates per 1 ms time increment, which was well beyond our computational capacity. The total number of inhibitory and excitatory synapses was therefore kept constant at the maximum feasible number of ∼400,000. This represents ∼40 inputs and 40 outputs per neuron. Although this is a simplification, it represents ∼25% of the number of connections that were sufficiently strong to trigger an action potential in the postsynaptic cells (3.1%/2 × 10,000 neurons = 160 inputs per cell vs the 40 that were modeled).
Table 1.
Electrophysiological parameters from dual whole-cell recordings
| Parameter | Median | SD | N |
|---|---|---|---|
| Resting membrane potential, mV | −71 | 5.6 | 64 |
| Action potential threshold, mV | −49 | 5.4 | 64 |
| Resting membrane potential–action potential threshold, mV | 20.5 | 7.4 | 64 |
| Input resistance, mΩ | 169 | 62 | 64 |
| Capacitance, pF | 129.4 | 38.2 | 23 |
| Time constant, ms | 13.5 | 3.1 | 23 |
| EPSP amplitude, mV | 3 | 4.5 | 12 |
| Tested CA1 pairs | — | — | 130 |
| Fraction coupled pairs | — | — | 6% |
| Fraction pairs (with postsynaptic action potentials) | — | — | 1.6% |
Three models of network connectivity were tested. In the first model (the uniform connectivity model), every neuron is synaptically connected to neurons in its neighborhood, with the connection probability falling exponentially with distance (Traub and Miles, 1991; Sabolek et al., 2012) (Fig. 1B). The terms “neighborhood” and “local connections” refer to connections to neurons that are within a distance of 5 neurons in the grid shown in Figure 1A. Every neuron was connected using the same strategy. The drop in probability of connectivity with distance for the uniform connectivity schemes that were tested is shown in Figure 1D, and the associated parameters are listed in Table 2.
Table 2.
Model parameters
| Parameter | Explanation | Value |
|---|---|---|
| E | Resting membrane potential, mV | Initial value = 0 |
| T | Action potential threshold, mV | Initial value = 1 |
| gK | Ratio of K conductance over resting K conductance value | Initial value = 1 |
| GE | Excitatory synaptic conductance | Initial value = 0 |
| GI | Inhibitory synaptic conductance | Initial value = 0 |
| λ | Time constant for action potential threshold decay, ms | 15 |
| c | Coefficient of sensitivity for action potential threshold adaptation | 0.75 |
| τ | Time constant for decay in K conductance, ms | 20, excitatory; 10, inhibitory |
| b | Increment in gK conductance after spiking | 20, excitatory; 10, inhibitory |
| Te1 | Excitatory conductance alpha function parameter | 0.2 |
| Te2 | Excitatory conductance alpha function parameter | 10 |
| Ti1 | Inhibitory conductance alpha function parameter | 0.2 |
| Ti2 | Inhibitory conductance alpha function parameter | 20 |
In the second model, the small-world network model (Watts and Strogatz, 1998), the majority of connections are within the neuron's neighborhood. A certain percentage of those synapses are then rewired, connecting to neurons chosen at random from outside the neighborhood (Fig. 1C). In the dual whole-cell recordings, we did not find an appreciable relationship between physical distance and the probability of shared synaptic connections (see Fig. 5C), so no distance dependence was included in the distribution of long-distance connections. The values for percentage of rewired long-range connections per neuron that were tested were 10%, 20%, 30%, 40%, and 50%.
Figure 5.
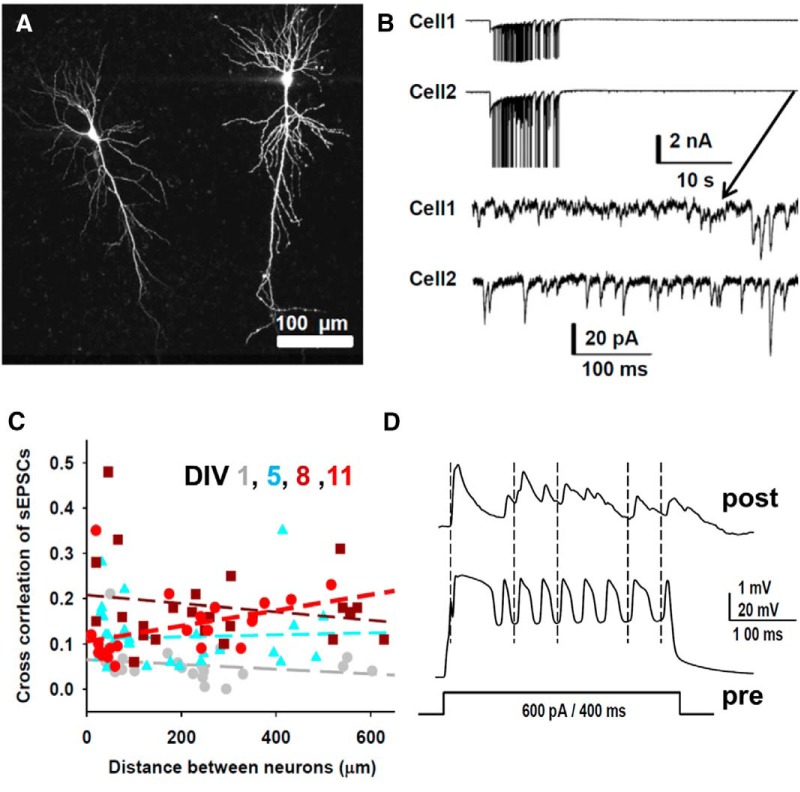
Dual whole-cell recordings in the hippocampal organotypic slice culture. A, Two filled cells demonstrating extensive apical and basal dendrites that extend across the physical dimensions of the slice from a dual whole-cell recording on DIV 5 in which pipettes contained AlexaFluor-594 (10 μm). B, Seizure activity in dual whole-cell recordings at DIV 11 (ictal data were not used for correlation). sEPSCs recorded 30 s after seizures (bottom, zoomed in recordings) were used for correlations. C, sEPSC correlations between neurons increased from 0.05 on DIV0 to 0.2 on DIV 15–19, consistent with increased connectivity as suggested in A. However, the correlation between neurons did not decrease with distance. The average cross-correlations are as follows: 0.05 ± 0.01 (DIV 1, gray dots, n = 22 pairs), 0.12 ± 0.01 (DIV 5, cyan triangles, n = 32 pairs), 0.18 ± 0.02 (DIV 8, dark red squares, n = 24 pairs), and 0.14 ± 0.02 (DIV 11, red dots, n = 21 pairs). D, Recording from a pair of CA3–1 pyramidal neurons that were considered to be synaptically connected based on the temporal correlation between action potentials in the presynaptic neuron (“pre”; action potentials widened by cesium pipette solution) and excitatory evoked responses evoked from resting membrane potential in the postsynaptic neuron (“post”; also recorded with cesium pipette solution).
For both uniform connectivity and small-world connectivity, the number of input as well as output connections per neuron followed approximately a Gaussian distribution, with a mean of 35–40 connections and SD of 4–7 connections.
A number of real-world networks fall into the third category of models: scale-free networks. In scale-free networks, the synaptic connections of the neurons follow a power law (Fig. 1E) and can be constructed using the algorithm of Barabasi and Albert (1999). As the neurons in the current network are arranged in a lattice, the algorithm by Rozenfeld et al. (2002) was used to construct scale-free networks. Figure 1E demonstrates the range of scale-free network configurations that were tested. In the configurations tested, every neuron had 5–10 connections at the minimum, and 115–120 connections at the maximum. Once again, the probability of connections dropped with distance, with the vast majority of connections formed between neurons 5–10 steps of each other on the grid.
Neuron model.
The neuron model we used is a modified version of the Macgregor integrate and fire neuron (MacGregor and Oliver, 1974). Equations governing the model are detailed previously (MacGregor and Oliver, 1974; Swiercz et al., 2006, 2007). They are reproduced as follows:
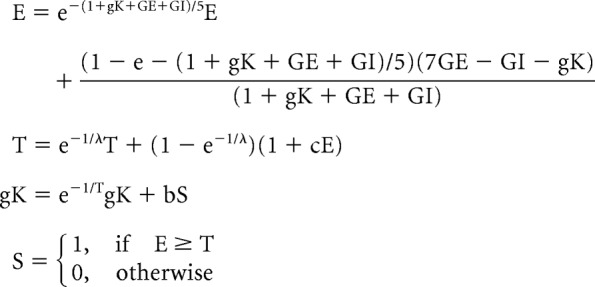 |
Here, E is the change in membrane potential from resting membrane potential, T is the threshold for generation of action potential, gK is the excess potassium conductance over resting potassium conductance value, and S is the indicator of output spikes. The parameters evaluated (Table 2) include the data from 130 dual whole-cell recordings (see Fig. 5; Table 1).
For any given neuron, the incoming synaptic weights as well as neurotransmitter vesicles released onto the respective synapses are used to compute the excitatory and inhibitory synaptic conductances (Cios et al., 2004). The excitatory conductance GE and inhibitory conductance GI are computed as follows:
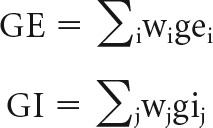 |
In the above set of equations, i represents all incoming excitatory synapses, and j represents all incoming inhibitory synapses. w represents the corresponding synaptic weights. ge and gi are the sum of products over time of α functions with the number of excitatory and inhibitory neurotransmitter vesicles released onto synapses. That is,
 |
In the above equations, glutamate(t) and gaba(t) represent glutamate and GABA vesicles released at time t. The summation over time happens over the interval from current instance to 150 ms before the current instance of time. The biexponential α functions for excitatory and inhibitory synapses, αe and αi, are adapted from Cios et al. (2004) and described by the following:
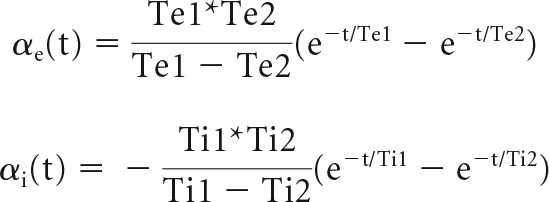 |
The parameters used are tabulated in Table 2 and are based on Table 1 and Rothman and Silver (2014).
Excitatory, inhibitory, and potassium conductances all contribute to the neuron's transmembrane potential. When the membrane potential exceeds the action potential threshold, an action potential is generated (without detailed modeling of sodium conductances). Every time an action potential is generated, the neuron's potassium conductance is incremented by a fixed value, hyperpolarizing the membrane potential away from action potential threshold so that the neuron ceases firing. The potassium conductance then decays exponentially over time to the steady-state value (Hodgkin and Huxley, 1952; Traub and Miles, 1991).
Single neuron dynamics.
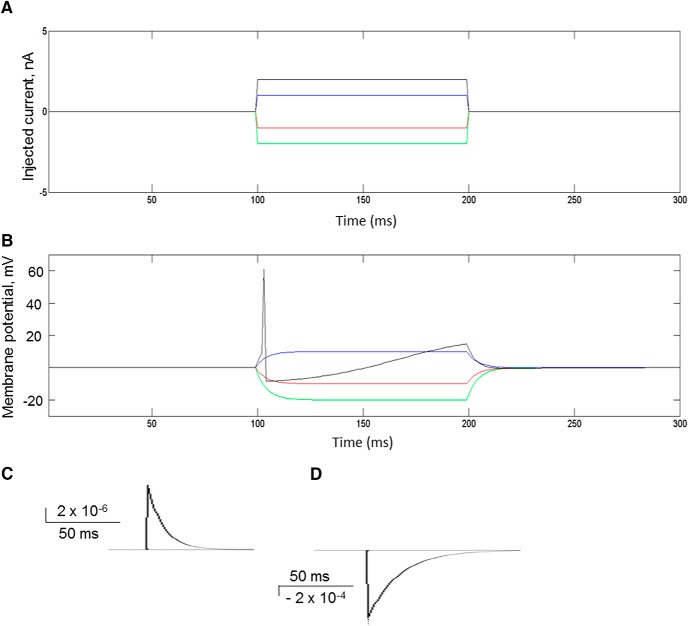
The responses of a single excitatory neuron to various values of external stimulating current are shown in Figure 2A, B. As the external inward current increases, the transmembrane potential E also increases until the action potential threshold is reached and the neuron fires. The time course of excitatory and inhibitory conductance responses of the neuron to synaptic release of 1 neurotransmitter vesicle is shown in Figure 2C.
Figure 2.
A, Injected current pulse. B, Response of a single excitatory neuron to injected current pulses in (A). C, D, Excitatory and inhibitory response curves of the excitatory neurons in response to synaptic release of a single transmitter vesicle.
The release of glutamate and GABA at excitatory and inhibitory synapses contributes to the excitatory and inhibitory conductances of the postsynaptic neuron. Three to five simultaneously released glutamate vesicles will bring a resting neuron to action potential threshold (Table 1). The number of glutamate vesicles required to reach action potential threshold is affected by the current value of the membrane potential, the strength of the synapse, and concurrent activation of GABAA receptors and potassium conductances.
Synaptic depression and recovery.
Further synaptic details were added to the Macgregor model of the neuron. The neurons release neurotransmitter vesicles containing GABA or glutamate into the synapses when they fire action potentials. Glutamate vesicles were also released spontaneously, independently of action potentials (McBain and Dingledine, 1992). These sources of glutamate-mediated synaptic activity were summarized in the glutamate release probability value. There was no fluctuation in the spontaneous glutamate release probability over the course of a simulation, and no other inputs or externally modulated membrane currents were applied to the neurons.
Activity-dependent as well as spontaneous release of glutamate leads to a depletion of available glutamate vesicles, which in turn leads to short-term synaptic depression (Roy et al., 2014). The glutamate vesicles are then replenished over time (Rizzoli and Betz, 2005). The dynamics of replenishment and depletion were described respectively by the following:
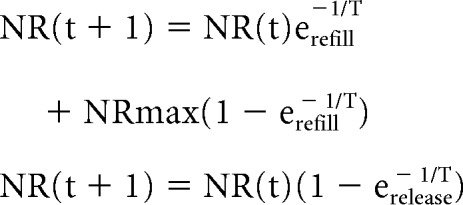 |
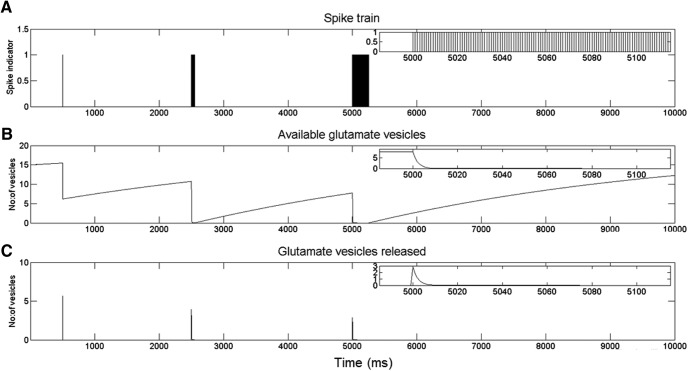
NR is the number of available glutamate vesicles for release, and NRmax is the maximum number of releasable glutamate vesicles. NRmax was drawn at random, for every synapse, from a uniform distribution with a maximum of 30 (Stevens and Tsujimoto, 1995). The time constant for release, τrelease, and the time constant for replenishment, τrefill, is 1 ms and 5 s, respectively (Staley et al., 1998, 2001). Figure 3 illustrates the activity-dependent depression and recovery of the response of a synapse to incoming spike trains of varying durations.
Figure 3.
Activity-dependent depression and recovery of synaptic responses. The response of a synapse to incoming spike trains of varying durations and timing is shown. The synapse has 20 releasable glutamate vesicles (NRmax = 20). At t = 0, there are 15 vesicles available for release, so NR(0) = 15. A, The pattern of incoming action potentials to the axon terminal. Insets, Activity at an expanded time scale. B, Glutamate available for release at the synapse after transmitter release based on the action potentials in A. C, The number of glutamate vesicles released at the synapse in response to the incoming spike train.
Every neuron in the network is assumed to have a finite number of releasable glutamate vesicles. The initial value of releasable glutamate vesicles at the beginning of the simulation was set to be a random fraction of the maximum possible at every synapse.
In the case of inhibitory neurons, a single GABA vesicle is released every time the neuron fires an action potential, with no activity-dependent depression. Glutamatergic inputs to interneurons underwent synaptic depression and recovery with the same kinetics as pyramidal cell inputs.
The model does not include subcellular compartments; G-protein-linked receptors; sustained conductances underlying plateau potentials; ion accumulation and transport; or principal cell or interneuron subtypes.
Experimental design and statistical analysis: computation model
Population activity.
The field potential of the network is calculated from the center of the grid, based on an approximately exponential decay of the contribution of an individual neuron to the local field potential with physical distance (Lindén et al., 2011). The potential values of the neurons were therefore multiplied by a 2D exponential function located at the center of the grid (the virtual extracellular electrode position), and summed, to obtain the net field potential of the network. Frequency dependence of volume conduction was not modeled. The equation had a space constant of 2 neurons on the grid. The relevant equation is as follows:
 |
In the above equation, i and j are the row and column indices of the neurons along the grid, respectively; N is the number of rows and columns in the grid; and ic and jc are the row and column indices of the neuron in the center of the grid. σ is the space constant.
Interictal spikes are defined as simultaneous (i.e., within the same 1 ms time interval) action potential firing in ∼5% of neurons at its peak, such that the field potential generates a voltage transient of at least 0.3 mV (Dzhala and Staley, 2003). Seizures are defined as repeated field potentials of at least 0.2 mV at a frequency of at least 2 Hz for a period of at least 10 s (Fisher et al., 2005), involving simultaneous action potential firing in ∼0.5% of neurons.
Spike propagation velocity.
The propagation velocity of the spiking wavefront was computed as follows: let i denote the group of spiking neurons in iteration (t), and let j denote the group of spiking neurons in iteration (t + 5). For every spiking neuron in iteration (t), the minimum distance to a spiking neuron in iteration (t + 5) is computed. The average of those minimum distances is then computed, and is then divided by iterations passed, to compute the velocity as follows:
 |
In the above equation, n is the total number of spiking neurons in iteration (t), m is the total number of spiking neurons in iteration (t + 5), and k is the number of iterations that passed between the two time frames under consideration: 5 in this case.
Simulation procedure.
Our network was programmed in C++ and heavily parallelized, and run on a Linux Cluster. Time increments in the model were 1 ms. A 5 min network simulations, or ∼300,000 1 ms iterations, took ∼1 day to run. In each time step, for every neuron, neurotransmitter release, both spontaneous and activity-dependent, was computed. Transmembrane potential and other parameters of every neuron were then updated. Neuronal spiking triggers activity-dependent glutamate release in the next time step and the various stages were repeated. Our code will be made available in model DB.
Neurophysiology
Organotypic slice cultures.
Organotypic slice cultures were prepared from P6-P8 C57BL/6 mice of either sex using the roller tube technique (Gähwiler, 1981) for electrophysiology and the membrane insert technique (Stoppini et al., 1991) for imaging. The protocols were approved by the Massachusetts General Hospital Subcommittee on Research Animal Care. Briefly, isolated hippocampi were cut into 400 μm slices on a McIlwain tissue chopper (Mickle Laboratory Engineering). Roller tube slices were then placed on glass coverslips in roller tube cultures as previously described (Dyhrfjeld-Johnsen et al., 2010; Lillis et al., 2015). Following slicing, and before placing slices on the membrane insert, membrane slices were incubated for 1 h in a viral incubation solution containing 5 μl of AAV-hSyn-GCaMP7b (Addgene 104489) in 2 ml of Gey's balanced salt solution with 3 mm kynurenate, and bubbled with 95% O2/5% CO2. Slices were then transferred to membrane inserts (PICMORG50; Millipore), which were placed in glass-bottomed six-well plates (P06-1.5H-N, CellVis). Both culture configurations were incubated at 5% CO2, 36°C in Neurobasal-A growth medium supplemented with 2% B27, 500 μm GlutaMAX, and 0.03 mg/ml gentamycin (all from Invitrogen). Growth medium was changed every 3–4 d.
Electrophysiology.
On the recording day, organotypic slice cultures were transferred to a submerged recording chamber and perfused with oxygenated (95% O2/5% CO2) ACSF (2.5 ml/min, 35 ± 0.5°C) containing the following (in mm): 119 NaCl, 1.25 NaH2PO4, 3 KCl, 26 NaHCO3, 11 glucose, 2.5 CaCl2, and 2 MgSO47H2O, pH 7.4, for 30 min before electrophysiological recording. Recording electrodes were pulled from borosilicate glass capillaries (Sutter Instruments) using a micropipette puller (model P-97, Sutter Instruments) with resistance 4–7 mΩ when filled with internal solution containing the following (in mm): 120 potassium (N = 23; Table 1) or cesium gluconate (N = 64; Table 1), 5 MgCl2, 0.6 EGTA, 30 HEPES, 4 Mg-ATP, 0.4 Na2-GTP, 10 phosphocreatine-Tris, 5 QX-314 and 0.01 AlexaFluor-594 hydrazide (Invitrogen), 290 mOsm, pH adjusted at 7.2 with CSOH. Dual whole-cell patch-clamp recordings were made from a pair of CA1 pyramidal neurons with visualization using infrared differential interference contrast optics and a camera on an upright Nikon Eclipse FN1 microscope. Signal acquisition was performed using a Multiclamp amplifier (Multiclamp 700B, Molecular Devices) with Clampex 10 software (Molecular Devices). Signals were sampled at 10 kHz and filtered at 2 kHz. Data were stored on a PC for off-line analysis after digitization using an A/D converter (Digidata 1440A, Molecular Devices). The resting membrane potential of neurons was measured in current-clamp mode within 5 s of establishing whole-cell recordings to minimize the effect of internal solution on intrinsic properties of neurons, and other passive properties were measured immediately thereafter. Membrane potential was corrected for a liquid junction potential of −10 mV (potassium gluconate) or −13.7 mV (cesium gluconate). Neurons with resting membrane potential <−60 mV after correction of liquid junction potentials were discarded. Neuronal input and access resistances were repetitively monitored during the experiment. Cells with changes of input and access resistance changes of >20% were excluded from analysis.
Neurophysiology
Experimental design and statistical analysis: electrophysiology.
sEPSCs were collected at a holding potential of −70 mV, which is close to the calculated IPSC reversal potential. sIPSCs were also measured in the same neuron by raising the holding potential to 0–10 mV, a potential close to the EPSC reversal potential, to minimize the amplitude of concurrent sEPSCs. Postsynaptic currents were detected using custom software (DClamp; https://sites.google.com/site/dclampsoftware/home). Cross-correlation of sEPSCs between two neurons was calculated using the peak time points of sEPSCs by MATLAB (RRID:SCR_001622).
To detect a synaptic connection between a pair of patched neurons, an action potential burst was induced by a 600 pA, 400 ms current injection into first one, and later the other, neuron of the pair in current-clamp configuration. The responses from the neuron injected with current (presynaptic neuron), and the postsynaptic neurons were measured by Clampfit 10.2 (Molecular Devices).
Anatomical imaging.
After at least 1 h electrophysiological recording, the same slice cultures were then transferred to a custom-built scanning microscopes for two-photon image collection. Two-photon images were acquired using custom-designed software and the scan head from a Radiance 2000 MP (Bio-Rad), equipped with a 20× 0.95 NA water-immersion objective (Olympus), and photomultiplier tubes with appropriate filters for YFP (545/30) and CFP (450/80). A Spectra-Physics Mai Tai laser, set to 810 nm, was used for two-photon excitation. Serial images of AlexaFluor-594 hydrazide-filled neurons were collected with 2 mm steps. The imaging was reconstructed by ImageJ (RRID:SCR_003070) offline (Fig. 5A).
Calcium imaging.
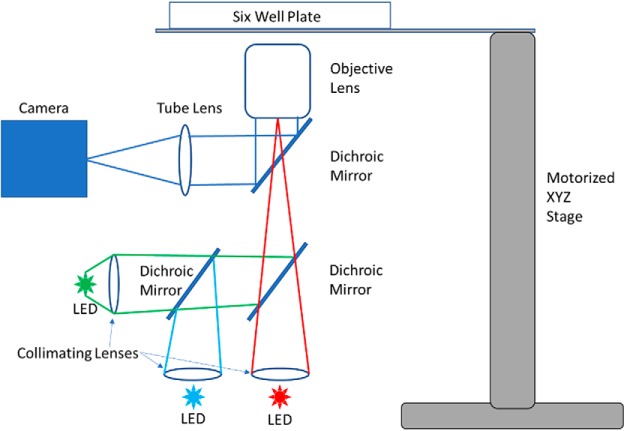
After at least 5 d in culture, when GCaMP expression was sufficient, and spontaneous seizures had typically begun, slices were transferred to the imaging system. The imaging system is a custom-inverted microscope constructed inside of a CO2 incubator (Fig. 4). The microscope comprises an Olympus MVPLAPO 2 XC objective (0.5 NA and magnification of 3.33× when coupled with the 150 mm lens tube), a multipeak 2-inch filter set (89402, Chroma), custom LED excitation sources (OSTAR Projection power, OSRAM), and a CMOS camera (GS3-U3-51S5M-C, FLIR). Slices were positioned using a motorized stage, equipped with a multiwell plate mount, enabling automated sequential recording of up to six slice cultures.
Figure 4.
Schematic of imaging system. A custom microscope built inside a CO2 incubator comprises LED excitation light sources, a camera, a 4× 0.5 NA objective, and a motorized 3-axis stage. Together, these components enable high resolution from a large FOV (encompassing the entire slice culture) and sequential, automated acquisition from up to six samples.
Experimental design and statistical analysis: calcium imaging.
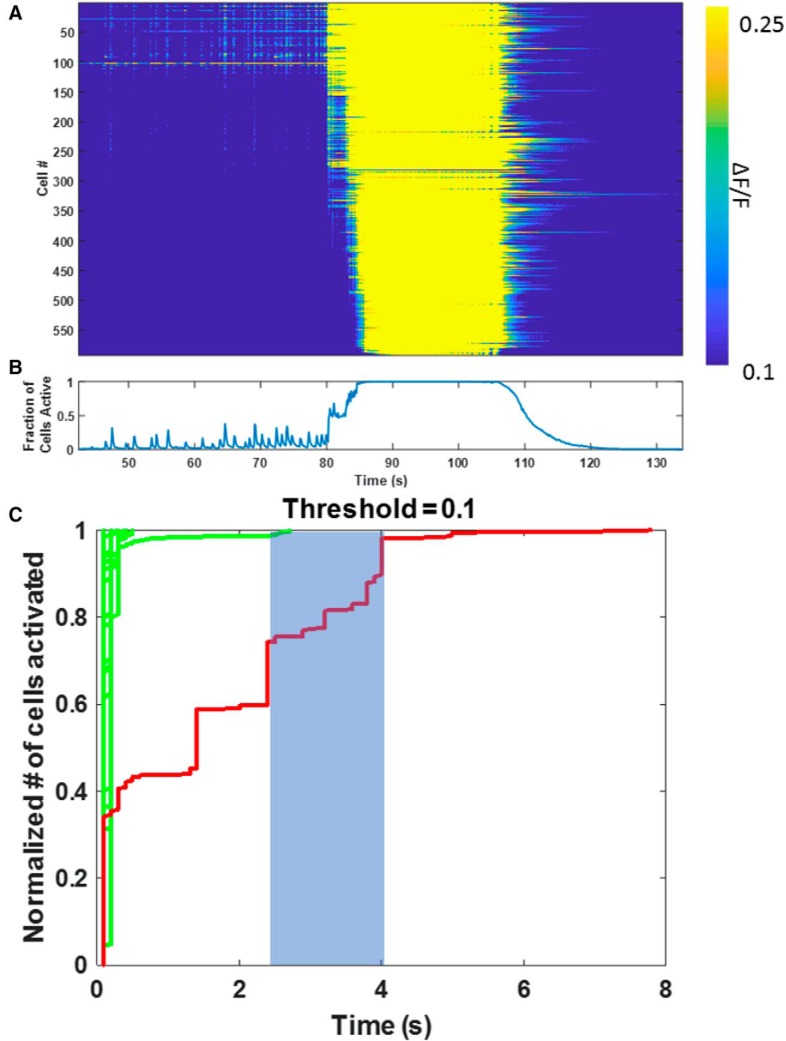
Each slice was imaged for 4 min at 10 Hz, which essentially guaranteed that a seizure onset was captured in each movie. The entire movie was baseline-subtracted, and an SD projection was calculated to highlight the active neurons. The Fiji (RRID:SCR_003070) plugin TrackMate (Tinevez et al., 2017) was used to automatically identify ROIs corresponding to ∼600 cells. Calcium traces were extracted as ΔF/F for the average of all pixels falling within an ROI. Sorted raster plots and onset time trajectories (see Fig. 12) were calculated by finding the time at which each cell first crossed a threshold of ΔF/F = 10% during epileptiform events, which were classified as described above for the model.
Figure 12.
Rate of propagation of ictal versus interical activity: calcium imaging. A, Raster plots of the time at which neurons activated during spikes and a seizure. A total of 600 neurons were imaged using GCaMP7b and arranged in the raster plot according to the time at which they activated (crossed a threshold of 10% ΔF/F) during the onset of the spontaneous seizure beginning at 80 s into the recording. B, Network average of neuronal calcium signals. C, Raster plots of sequential interictal spikes and seizure shown in A and B, arranged according to time of increase in calcium during each individual event. Red represents seizure. Green represents spikes. Initial rates of activation are similar for spikes and seizures. However, the rate at which activity propagates after the initial activation is much slower for both the seizure and the nonpropagated spike activity, consistent with the modeling shown in Figure 7.
Results
Epileptiform activity in isolated organotypic hippocampal slice cultures
Cultured hippocampal organotypic slices developed spontaneous epileptic activities beginning late in the first day after slicing, which can be detected by chronic calcium imaging observation (Lillis et al., 2015) and field potential electrophysiological recording (Dyhrfjeld-Johnsen et al., 2010). To establish some bounds on neuronal electrophysiological parameters, connectivity, and epileptiform activity in this preparation, we performed 130 dual whole-cell patch-clamp recordings on CA3 and CA1 pyramidal neurons (Fig. 5A). Whole-cell patch-clamp recording revealed epileptic activities at the single neuron level (Fig. 5B). Two minute recordings of sEPSCs were collected 30 s after seizures, when polysynaptic activity was minimal (Fig. 5B). To establish a measure of connectivity, the cross-correlation of incoming sEPSCs between neurons was calculated. Figure 5C shows that cross-correlation of sEPSCs gradually increased with age in culture. There was no consistent relationship between physical distance between the recorded neurons and correlation across the range of 10–625 μm distance, where 625 μm was the maximum distance between CA neurons in this preparation. Connectivity was also estimated between these pairs of whole-cell patched neurons also by triggering action potentials with depolarizing current injections into neurons (Fig. 5D). Action potentials were broadened by the effects of cesium in the recording solution, which should increase transmitter release probability. The responses of the presynaptic neuron and postsynaptic neuron were analyzed offline. When action potentials in the presynaptic neuron burst reproducibly induced postsynaptic EPSPs in the postsynaptic cells with a latency of <2 ms, the neurons were considered to be connected in that direction (Fig. 5D). In 130 pairs of dual whole-cell recordings, 14 pairs were connected (∼11%). Four pairs (3.1%) had sufficiently strong synaptic connectivity to induce action potentials in the postsynaptic neuron. Pairs were tested bidirectionally (each neuron was tested as the presynaptic and postsynaptic member of the pair), so the connectivity probabilities in Table 1 are one-half of these values. These properties and the other electrophysiological parameters of the recorded neurons listed in Table 1 were used as starting points for the computational networks in which we explored ictogenesis.
Epileptiform activity in the computational model
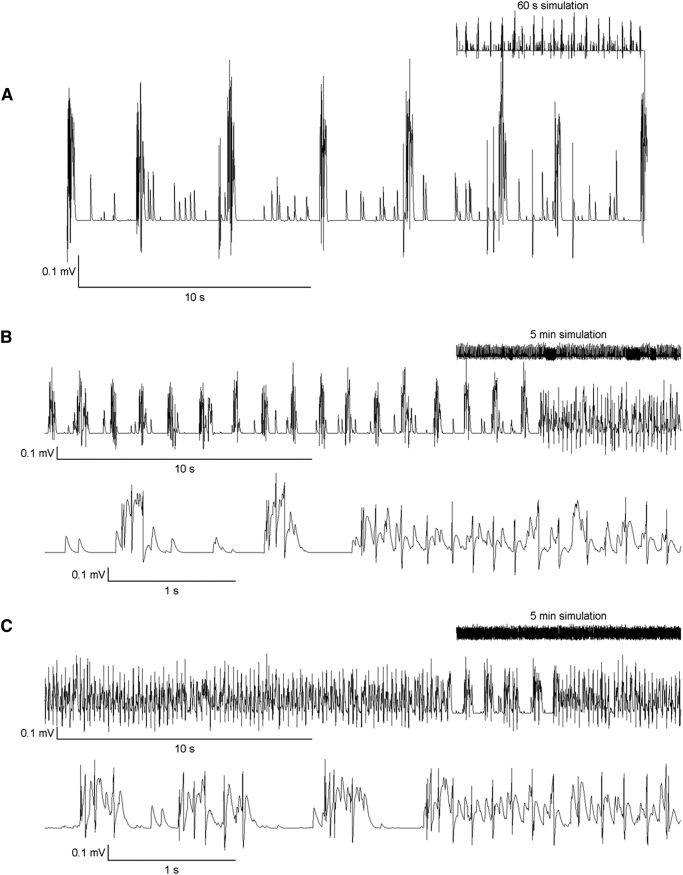
A wide range of connectivity and neuronal parameters could be used to create 10,000 neuron networks that generated spontaneous interictal spikes (Table 3; Fig. 6A). Networks generated spontaneous seizures under a more restricted range of tested parameters (Table 3). Networks generated both interictal and ictal activities under the most restricted set of parameters. A very extensive series of simulations was required to find the initial network structures and neuronal parameters that reproducibly generated both interictal and ictal activity in multiple networks that were created using the same parameters (Table 3; Fig. 6B,C).
Table 3.
Network connectivity and excitabilitya
| Spikes | Seizures | |
|---|---|---|
| Connectivity | ||
| Uniform, 2σ2 = 10 | Yes | No |
| Uniform, 2σ2 = 15 | Yes | No |
| Uniform, 2σ2 = 20 | Yes | No |
| Uniform, 2σ2 = 25 | Yes | No |
| Uniform, 2σ2 = 30 | Yes | No |
| Small-world, p = 10 | Yes | No |
| Small-world, p = 20 | Yes | Yes |
| Small-world, p = 30 | Yes | No |
| Small-world, p = 40 | Yes | No |
| Small-world, p = 50 | Yes | No |
| Scale-free, λ = 2.0 | Yes | No |
| Scale-free, λ = 2.5 | Yes | No |
| Scale-free, λ = 3.0 | Yes | No |
| Scale-free, λ = 3.5 | Yes | No |
| Scale-free, λ = 4.0 | Yes | |
| Spontaneous release probability | ||
| 1 × 10⁻⁵ | Yes | Yes |
| 5 × 10⁻⁵ | Yes | Yes |
| 1 × 10⁻⁴ | Yes | Yes |
| 5 × 10⁻⁴ | Yes | Yes |
| 1 × 10⁻³ | Yes | No |
aFor the connectivity table, spontaneous release probability per second = 0.05. For the spontaneous release probability table, connectivity = small-world, with 25% of connections long-distance. The term long-distance refers to connections to neurons that are >5 neurons away from the index neuron. Uniform connectivity, σ = SD of the Gaussian connectivity probability distribution, connectivity probability being the probability of connecting to a neuron at increasing distance from index neuron. Small-world connectivity, p = percentage of long-distance connections. Scale-free connectivity, λ = exponential in power law for scale-free networks. In scale-free networks, the probability P(k) that a node in the network has k connections to other nodes in the network follows a power law: P(k) ∼ k−λ. Five independent simulations were run for each of the listed configurations.
Figure 6.
Interictal and ictal activity in the artificial neural network. A, A simulation with low spike frequency and no seizures: lower values of NRmax (15), spontaneous release probability (0.01), and recovery rate (glutamate replenishment time = 8 s) were the contributing factors. Inset, The voltage scale is the same as that of the main figure. B, C, Interictal-to-ictal transitions. The frequency of seizure-like behavior is proportional to the spontaneous release probability of glutamate. B, Spontaneous glutamate release probability = 0.01. C, Spontaneous glutamate release probability = 0.05.
Nonepileptiform activity was manifest as random action potentials in individual neurons driven by spontaneous, stochastic glutamate release. Epileptiform network activity was manifest as continuous, advancing traveling waves of spiking neurons, as has recently been described in cortical recordings from epileptic patients (Smith et al., 2016) and disinhibited experimental cortical in vivo recordings (Rossi et al., 2017). This pattern is described in more detail below.
The calculated field potential during seizures ranged from 0.2 to 0.4 mV. These values are within the range of what has been recorded in vitro in the organotypic slice preparation (Gutnick et al., 1989; Dyhrfjeld-Johnsen et al., 2010), although the best means to calculate the field potential from the activity of an in silico network are still being developed (Lindén et al., 2011; Mazzoni et al., 2015). The duration of seizures ranged from the minimum of 10 to 45 s, similar to seizure duration in isolated preparations in vitro (Berdichevsky et al., 2013). On average, 57 neurons fired per millisecond during a seizure, with an SD of 22 (computed for 3 seizures obtained in 5 independent simulations). In simulations with seizures, 1 or 2 seizures were observed per minute of simulation time. Lower frequencies of spikes and seizures could be generated using specific values of network parameters. For example, lower values of spontaneous glutamate release probability, lower values for NRmax, and higher values for replenishment time constant, τrefill, all resulted in lower spike and seizure frequency. Figure 6A illustrates a simulation with no seizures, and low spike frequency.
Onset patterns of interictal activity
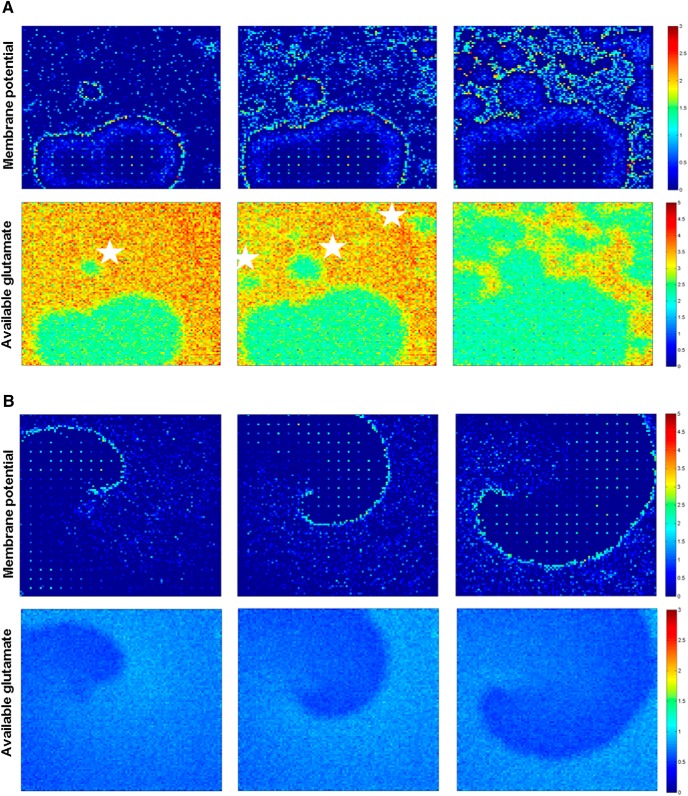
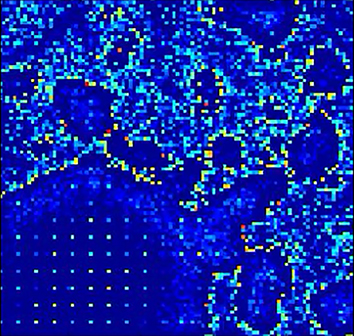
Figure 7A depicts the progress of action potential firing in neurons during an interictal spike episode that generated field potentials, such as those shown in Figure 6A. The images show the grid of neurons, with every pixel value representing the transmembrane potential of the corresponding neuron. An interictal spike originated when a local group of neurons started to fire simultaneously. These groups could be recognized when at least 10–20 neurons within a local grid of 10 × 10 cells began firing. The activity then spread radially from the group to synaptically connected neurons. The interictal activity was often complex with >1 peak per spike discharge (Fig. 6A). The duration for 246 complex interictal spikes from 5 independent simulations had a mean value of 396 ms and a SD of 130 ms. This duration is longer than for a single spike or sharp wave (<200 ms by definition) but well within the typical duration of a complex interictal spike discharge (de Curtis and Avanzini, 2001). The output synapses of the neurons became depressed as releasable glutamate was depleted by repeated action potential firing and consequent glutamate release. This led to reduced excitatory input to postsynaptic neurons, reduction of action potential firing, and termination of the interictal spike. After the output synapses of the neurons recovered, low-level random synaptic activity and action potential firing resumed. This took several seconds in simulations with low spike frequency, as has been observed experimentally (Staley et al., 1998, 2001; Le Duigou et al., 2014). Eventually, another group of neurons began to fire simultaneously, initiating the next interictal spike (Movie 1).
Figure 7.
Spread of epileptiform activity through the network. A, Top panels, Plots of membrane potential of each neuron in the network illustrate action potential propagation during interictal spiking activity in a 100 × 100 principal cell and 20 × 20 interneuron network with small-world connectivity (the interneuron grid is visible in frames due to high levels of inputs). Illustrated frames are 5 ms apart. The organized wavefront visible in the first panel is not sustained due to rapid spread of activity via long-distance connections (white stars). Bottom, Glutamate available for release per synapse in the network during spiking activity shown in top panels. B, Top row, Action potential propagation during seizure activity. Every frame is 50 ms apart. Bottom row, Glutamate available for release per synapse in the network during seizure activity shown in top row.
Neuronal spiking activity during interictal spike activity. Color represents membrane potential for each cell: warmer color tone represents more depolarized. The video is shown at 0.03× real-time. The rapid propagation of the interictal spike wavefront is further accelerated by long-range projections, which initiate new wavefronts, rapidly synchronizing the entire network.
Onset patterns of seizure activity
Seizures arose from epochs of interictal activity (Fig. 6B,C). Ictogenesis was not triggered by stochastic peaks of spontaneous glutamate release; both spikes and seizures began with similar network-mean rates of glutamate release. The rate of glutamate release (representing action potential-independent release) (McBain and Dingledine, 1992) just before a seizure was also not unique: glutamate release in the 100 ms before a seizure was not significantly different than in any other period. For 3 seizures obtained in 5 independent simulations, the mean value of spontaneous glutamate release per millisecond, 100 ms before the seizure, was 8.9 × 10⁻³ (SD 4.3 × 10⁻³). For 6 randomly chosen spikes in those very same simulations, the mean value of spontaneous glutamate release was 8.6 × 10⁻³ (SD 4.4 × 10⁻³) per millisecond, comparable with those of seizures in the same simulations.
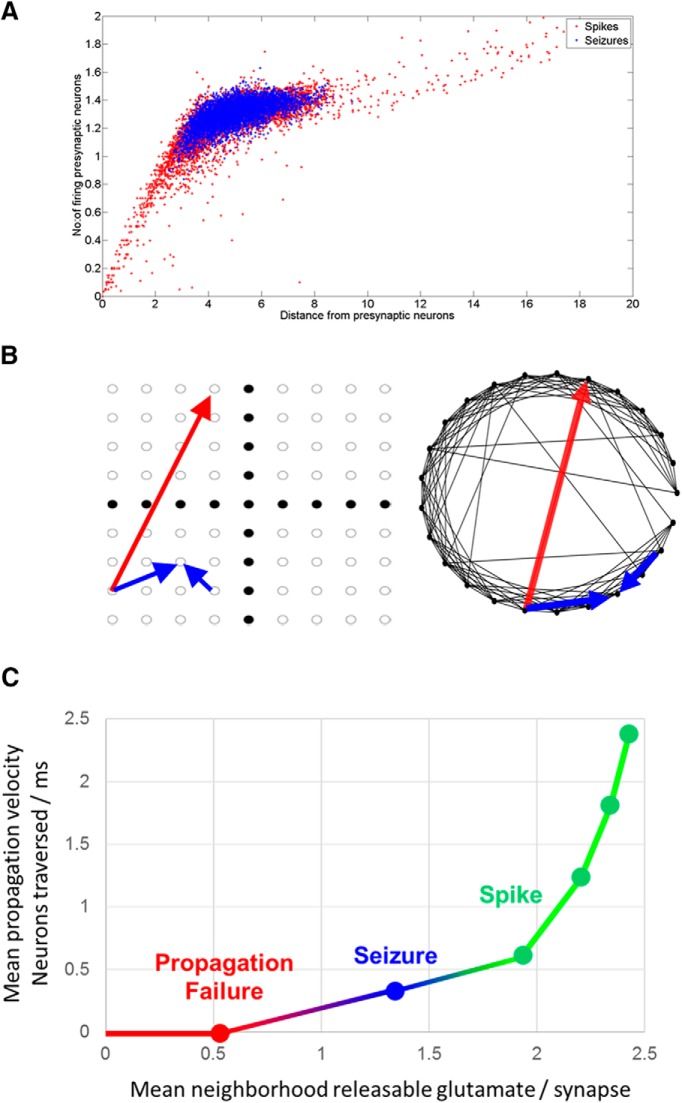
Fig. 7B demonstrates the progress of action potential firing in network neurons during a spontaneous seizure episode. Seizures only occurred when the network was partially depressed from prior interictal spike activity. Under these conditions, the activity of more than one presynaptic neuron was necessary to activate the postsynaptic neuron (Fig. 8A). Long-distance connections were too sparse to activate distant neurons (Fig. 8B), so activity did not jump to distant areas of the network, as occurred during interictal spikes that were generated when synapses were less depressed (Fig. 7A, starred areas). The requirement for activation by multiple presynaptic neurons constrained activity to local spread. This was because, in small world networks, only local synaptic connectivity was sufficiently high to engender the simultaneous activity of multiple presynaptic neurons (Fig. 8B). This constraint organized seizure activity into traveling waves (Fig. 7B; Movie 2).
Figure 8.
Relationship between synaptic depression, conduction velocity, and epileptiform activities. A, The number and distance of firing presynaptic neurons for neurons that fired during seizures and spikes in a particular simulation. For seizures, the firing presynaptic neurons were located within its neighborhood. For spikes, the firing presynaptic neurons were located all over the network. B, Schematic of the varying influence of long-distance versus local connections on the spread of epileptiform activity. Using the network layouts from Figure 1, the red arrow represents a long-distance synaptic connection in a small-world network that spreads activity when synaptic depression is low and a single synapse can activate a postsynaptic neuron. In contrast, when synapses are more depressed, more than one synapse is necessary to activate a postsynaptic neuron. Under these conditions, only the local connections (blue) are sufficiently dense to support coincident activation of >1 synapse. This constrains activity to local propagation, which is slower than via long-distance connections. C, Relationship between releasable glutamate at presynaptic terminals of neurons in the neighborhood (neighborhood being neurons within a 3 × 3 grid of the spiking neuron under consideration) and velocity of propagation of the spiking wavefront. Fast propagation velocity, supported by high mean releasable glutamate levels, produced rapid activation of the network (spike, green). Slow propagation, caused by lower amounts of releasable glutamate, led to a collapse of the wavefront (propagation failure, red). A narrow band of propagation velocity, resulting from moderate amounts of releasable glutamate, produced sustained reentrant waves (seizure, blue).
Neuronal spiking activity during seizure activity. As in Movie 1, color represents membrane potential for each cell and the video is shown at 0.03× real-time. This movie takes place immediately following the spiking in Movie 1. The rapidly synchronizing spikes are replaced by a slow traveling wave, which did not initiate additional distal wavefronts due to synaptic depression.
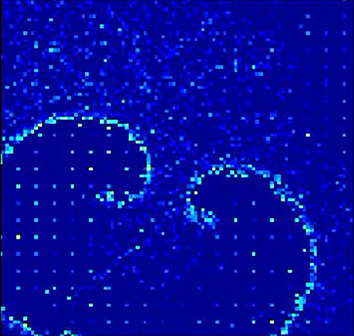
The wavefronts of active neurons during the sustained seizure activity followed a logarithmic spiral pattern. Logarithmic spirals are patterns that appear frequently in natural phenomena (Hagan, 1982); they are self-similar spirals at every point of which the angle between the tangent and the radial line remains constant. This is in agreement with the wave-like and spiral-like patterns that have been recorded from the cortex during experimental seizures (Huang et al., 2004; Viventi et al., 2011; González-Ramírez et al., 2015).
Spike propagation velocity and available glutamate
The propagation velocity of the spiking wavefront was dependent on the average number of glutamate vesicles available for release in the neuronal neighborhood (Fig. 8C). The higher the amount of releasable glutamate, the faster the spiking wavefront moved across the network. The amount of releasable glutamate in the network was higher during a spike when compared with a seizure; the spiking wavefront therefore moves much faster during an interictal spike than during a seizure. The mean velocity of 5 spikes across 3 simulations was 0.64 neurons/ms (SD 0.2), compared with the mean velocity value of a seizure of 0.3971 neurons/ms. In a depressed network, cooperative, or nearly simultaneous, release at multiple synapses was required to generate a postsynaptic action potential. In small-world networks, the probability of such cooperative release falls rapidly with distance, so the propagation is local and slow in partially recovered areas. In fully recovered networks, sufficient glutamate is released from the sparse long-distance connections to trigger action potentials, so that the network activity jumps ahead of the activation wavefront and rapidly activates the entire network (Figs. 7A, 8C).
Spontaneous glutamate release probability
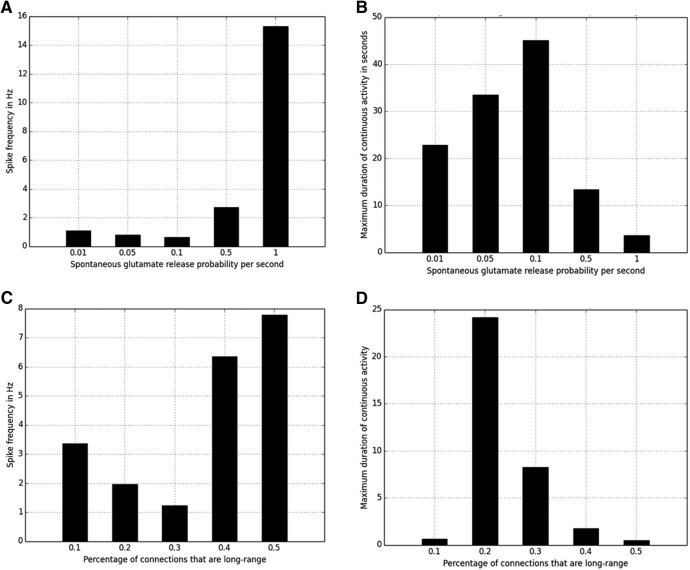
The frequency of interictal spike events increased with spontaneous glutamate release probability at individual synapses. Five independent simulations with 60,000 1 ms iterations were run for each value of the probability of glutamate release. In Figure 9A, the change in network behavior with increase in the probability of spontaneous glutamate release at each synapse in the network is shown. Interictal spike frequency was proportional to the spontaneous glutamate release probability. Seizure duration was also proportional to glutamate release probability for low to moderate values of release probability. Seizure duration fell at higher levels of release probability due to enhanced synaptic depression (Fig. 9B).
Figure 9.
Spontaneous glutamate release probability and occurrence of seizures for small-world networks. A, Maximum duration of continuous activity in seconds versus spontaneous glutamate release probability value. B, Average frequency of spikes in Hz versus spontaneous glutamate release probability value. The frequency of spikes was computed over five 60 s simulations for each spontaneous glutamate release probability value. C, Percentage of random long-range connections in small-world connectivity scheme and occurrence of seizures. Maximum duration of continuous activity in seconds versus percentage of long-range connections. D, Average frequency of spikes in Hz versus percentage of long-range connections. The frequency of spikes was computed over five 60 s simulations for each long-range connectivity percentage.
Effects of synaptic connectivity
Both interictal spikes and spontaneous transitions to and from seizures were only observed in networks with small-world connectivity. In these networks, 25% of the connections of every neuron in the network were long range. Networks with varying degree of long-range connections were then tested. The total number of connections was kept approximately the same, ∼400,000, or 40 per neuron, across various simulations; 10%, 20%, 30%, 40%, and 50% of total connections were long-distance in different tests of small-world connectivity. Five independent simulations with 60,000 1 ms iterations were run for each percentage value. Spike frequency was highest in the networks with highest densities of long-range connections (Fig. 9C). Seizures were most likely when 20% of connections were long range. Increasing or decreasing the percentage of long-range connections from the 20% value resulted in shorter periods of synchronous activity that did not reach the 10 s minimum for seizure activity (Fig. 9D). Networks with 30% of long-range connections resulted in periods of sustained activity that were ≥5 s, but none was ≥10 s.
Similarly, for uniform connectivity, the total number of connections was kept constant at ∼400,000, and 5 different values of neighborhood sizes were tested. Neighborhood size refers to the SD of the Gaussian distribution of local connectivity (Table 2). Five independent simulations with 60,000 1 ms iterations were run for each curve shown in Figure 1D. None of the tested neighborhood sizes resulted in seizures.
Scale-free networks have a large number of neurons with a small number of connections, and a few neurons with a large number of connections. For this connectivity strategy, 5 different slopes of the log number of connections versus log number of neurons curve were tested (Fig. 1E). Five independent simulations with 60,000 1 ms iterations were run for each slope value. None of the tested network configurations resulted in seizures.
Effect of disinhibition
For network configurations that produced seizures and spikes, we also ran simulations where the release of GABA into the network was blocked. No discernible difference was observed in network behavior, and the network continued to generate seizures and spikes. We then assessed glutamate release onto interneurons and found that activity-dependent depression of glutamatergic inputs profoundly depressed interneuron activity during spikes and seizures.
Effect of spatial rearrangement
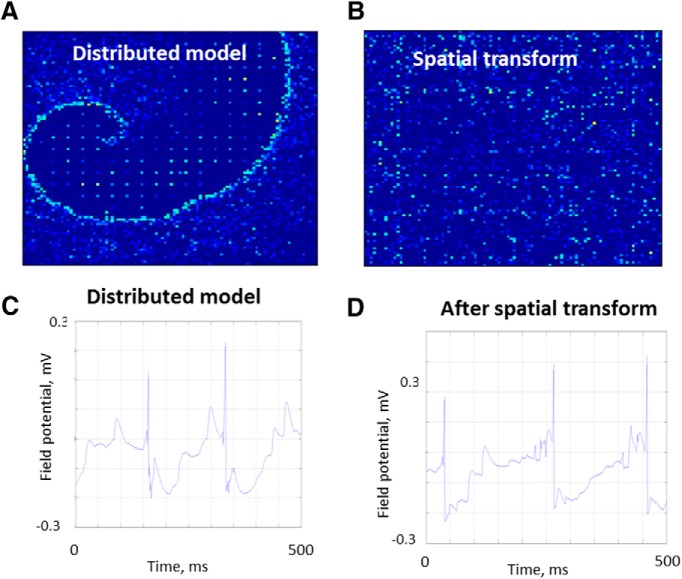
Neurons in the hippocampus are not arranged in checkerboard fashion (Fig. 1A). In paired recordings, there was no relationship between physical distance and synaptic correlation (Fig. 5C). This spatial heterogeneity may explain why spiral seizure wavefronts have not been noticed in this widely used preparation. Figure 10 demonstrates that, if synaptic connectivity is kept constant but the physical locations of the neurons are scrambled, the spiral waveform (Fig. 10A) is lost (Fig. 10B). However, the effect on the field potential is much more modest: epileptiform activity persists, with only a phase shift (Fig. 10C vs 10D). This result supports the idea that, at least within the anatomical constraints of this simulation experiment, electrographic epileptiform activity is not dependent on the physical location of the neurons. This is in sharp contrast to the dependence on synaptic connectivity. From this, we can conclude that anatomical spiral waves are not necessary to generate electrographic epileptiform activity.
Figure 10.
Observing spiral seizure structure: field potentials. A, Membrane potentials (white represents action potential; blue represents resting membrane potential) at seizure onset in network model, as in Figure 3. B, Same time point, after network locations of neurons were scrambled (transformed). Synaptic connectivity was not scrambled. C, D, Scrambling the network location as in B changes the phase, but otherwise has minor effects on local field potentials.
As a second test of these ideas, we used wide-field single-photon calcium imaging of the entire hippocampal organotypic slice culture preparation after 5 DIV, when the culture was generating spontaneous seizure activity (Dyhrfjeld-Johnsen et al., 2010; Berdichevsky et al., 2012; Lillis et al., 2015). Ictal wavefronts were not demonstrable by calcium imaging (Fig. 11A). However, the physical location of the neurons could be rearranged to demonstrate spiral ictal onset, and this onset persisted through the subsequent seizure onset (Fig. 11B,C). Once ictal activity was initiated, the neuronal calcium level remains high throughout the seizure, and it is no longer possible to discern traveling waves with this fluorophore. These data also support the idea that the pattern of synaptic connectivity and the progression of ictal activity relative to synaptic recovery are important determinants of ictal onset, but the physical location of neurons is not.
Figure 11.
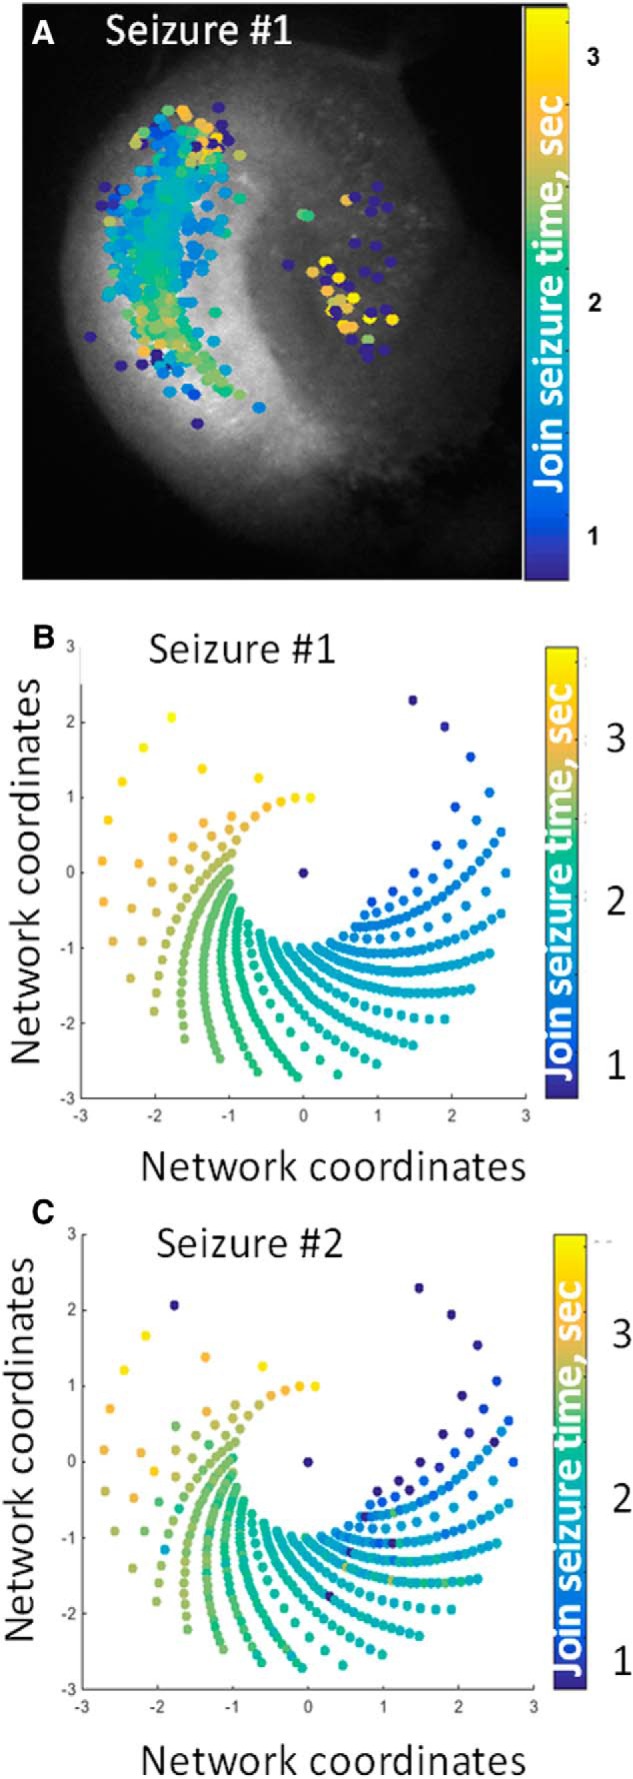
Observing spiral seizure structure: calcium imaging. A, Time of onset of ictal Ca2+ increase in individual neurons in an organotypic hippocampal slice culture that was generating spontaneous seizure activity (Lillis et al., 2015). B, The anatomical location of neurons in A were transformed using onset time to create a logarithmic spiral pattern similar to the network model (Fig. 7). Each spiral blade represents a unique onset time, i. Cells were evenly placed on the blade for 0 < t < 1 using the equations x = etcos(t − 0.2(i − 1)) and y = etsin(t − 0.2(i − 1)) C, Using the identical neural network locations for the next spontaneous seizure yields a similar ictal onset pattern.
As another test of the biological feasibility of this mechanism of ictal onset, we recorded the rate at which neurons activated during interictal spikes and seizures. The number of neurons whose calcium increased above resting levels and remained elevated was used as an assay of neurons that had begun to participate in epileptiform activity. Figure 8C predicts that spike activity should spread more rapidly than seizure activity (i.e., that the rate at which neurons join ictal spikes should be higher than the rate at which seizure activity spreads through the network). Figure 8C also predicts that propagation failure should be even slower than seizure activity spread. Figure 12 demonstrates that the initial rate at which neurons join spikes and seizures is very high, and that subsequently the rate falls off dramatically. This is consistent with the predictions of Figure 8C and the simulations that show progressive reduction in activity propagation velocity as seizure activity begins (Movies 1, 2). Several spikes terminated with slow nonpropagated activity, consistent with the velocity of propagation failure in Figure 8C.
As a further test of the predictions of the ictal traveling wave model, we quantified the relationship between the predicted ictal network path length for the ictogenic wave velocity and the degree of recovery shown in Figure 8C. For monoexponential recovery with a recovery time constant of 5 s, 500 ms is required to restock an average of 1.5 releasable vesicles at synaptic terminals that contain an average of 15 release sites, assuming that the synapse is completely depressed (no releasable vesicles) at the onset of recovery. For the ictogenic velocity of 0.5 neurons/ms shown in Figure 8C, the ictal pathlength should be ∼250 synapses to provide sufficient time (500 ms) for the synapses to replenish sufficiently. In other words, the ictal wavefront needs to sequentially activate 250 neurons before returning to the origin to reactivate the process again; 250 neurons is a reasonable pathlength given the geometry of 100 × 100 neurons. The movies demonstrate ictal periods of ∼500 ms (i.e., 2 Hz).
In ictal onsets recorded in Figure 12C, the ictal onset time from 3 to 4 s (shaded for clarity), during which ∼20% of the population activates, is most informative. The subpopulations that activate before 3 s do so abruptly, indicating much more rapid, pre-ictal activity patterns (Fig. 8B,C); 20% of the slice population is ∼2000 neurons (Liu et al., 2017), corresponding to an activation rate of ∼2 neurons/ms. This is ∼4 times faster than the velocities in the simulations. However, the ictal velocity is calculated differently in the simulations; it is calculated as the shortest possible synaptic distance between the currently and previously active neurons. In the calcium imaging data, we do not have a way to know which neurons lie on this shortest ictal pathway, and which neurons are extraneous to that pathway, so we count all newly active neurons. The additional activation of neurons that lie off the shortest ictal pathway contribute to the velocity that is calculated as neurons per millisecond, resulting in a higher apparent conduction velocity.
While ictal wavefronts may not be demonstrable by cellular calcium imaging in the hippocampus, the principals of ictogenesis discovered in silico (active wavefront velocity in partly recovered small-world networks matching the rate of recovery and the dimensions of the network) appear to apply to hippocampal ictogenesis in vitro, although the physical distribution of the neurons precludes observation of spiral waves seen in more spatially homogeneous neocortical preparations (Rossi et al., 2017).
Discussion
These simulations demonstrate that distributed neural networks can generate both spikes and spontaneous seizures without external inputs or parameter adjustments. Seizures only occurred in partially refractory networks. Potassium conductances and GABA synapses are present in our model, but in the networks tested here, activity-dependent synaptic depression was the dominant mechanism of refractoriness. Synaptic depression constrained seizure activity to a spiral wavefront of neurons firing action potentials. Wavefronts occurred because cooperative glutamate release at many presynaptic terminals was necessary to activate a postsynaptic neuron, and with small-world connectivity only local neurons contributed significantly to this cooperative release (Fig. 8B). Wavefronts were quite thin, as has been observed in human patients (Smith et al., 2016). In our simulations, interictal and ictal wavefronts of neurons firing action potentials were <10 neurons thick.
High levels of releasable glutamate vesicles available at recurrent excitatory synapses (i.e., minimal synaptic depression in the network) correlated with fast propagation of the spiking wavefront as well as spread of activity by long-distance synaptic connections (Figs. 7A, starred areas; Fig 8B,C). These processes led to rapid recruitment of the entire network into an interictal spike. A low level of releasable glutamate at synapses in the network (i.e., widespread synaptic depression) was associated with a quiescent state, with scattered action potentials but neither seizures nor interictal spiking; synchronous activity might start local but died out due to propagation failure (Fig. 8C). A slightly higher level of releasable glutamate (i.e., greater, but still incomplete, synaptic recovery) was associated with the slowest sustainable propagation of the wavefront of activity, and continuously reentrant, seizure-like behavior (Figs. 7B, 8C). In these models, a “barely recovered” network, with just enough glutamate to sustain firing of the spiking wavefront, was most conducive to seizure-like behavior.
A similar conclusion can be drawn from the results of simulations in which spontaneous glutamate release probabilities were varied. Networks with high glutamate release probabilities burst frequently. Networks with frequent release of glutamate also generated the most seizures per unit time because network recovery from each burst transitions through a partially recovered state that is prone to generating a seizure. The pro-ictal effect of an interictal spike is strongly supported by the well-established “pre-ictal” or “sentinel” activity that precedes human seizures by an interval of 1 to several seconds (Huberfeld et al., 2011). The variability in the interval between the sentinel spike and seizure in human recordings has not been explained previously but is most consistent with the increased probability of ictogenesis in partially recovered network states that we observed in our simulations.
The first insight into ictogenesis obtained from networks that spontaneously transition between interictal and ictal states is that wavefronts of neuronal activity must propagate sufficiently slowly through partially recovered synapses that the synapses ahead of the active wavefront have time to recover before the arrival of the wave of neuronal activation. This is analogous to fibrillation activity in cardiac tissue, where wavefront propagation matches recovery from a refractory state and thereby engenders sustained reentrant activity (Comtois et al., 2005). This critical propagation velocity depends on the dimensions of the network, the number of incoming glutamate vesicles necessary to trigger an action potential, and the rate of recovery of the network. The networks studied here could generate both spikes and seizures because the propagation velocity could vary as a function of the degree of recovery of the local synapses (Fig. 8C). This key relationship arose from the requirement for cooperative presynaptic activation of the postsynaptic neuron by multiple partially recovered synapses. Long-distance connections were too sparse to use cooperative action, so activity could not jump ahead of the wavefront of activation. Because only local neurons were likely to be connected to the postsynaptic neuron and firing, cooperative activation was local and therefore slower than activity propagated via long-distance synaptic connections. This effect may underlie the intriguing finding that reducing glutamatergic synaptic strength resulted in ictal activity in a smaller distributed model of neocortex (van Drongelen et al., 2005, 2007).
In our simulations, we did not find seizures in networks connected uniformly, or in a scale-free manner that was not also small-world. In both of these connectivity schemes, for the parameters we tested, bursting by a group of neighboring neurons did not initiate propagating bursts in neurons located farther away. The spiking wavefront propagated in a smooth manner, until it encountered the edges of the network. This behavior did not create pathways of recovered neurons that enabled reentry of the spiking wavefront into the network, and hence did not generate seizures.
The model presented here is conceptual and hypothetical. The network is based on experimental data, but there are many elements of real neural networks that are not included (see Materials and Methods). Nevertheless, the interictal-to-ictal transitions described here share five important features with clinical and experimental experience. First, seizures may be much less probable than spikes (Staba et al., 2014; Karoly et al., 2016) because of the narrow range of synaptic recoveries that make reentrant activity possible, versus the broad range of synaptic recoveries that engender spikes (Fig. 8C). Second, seizure activity occurs in partially recovered networks, so the velocity of ictal propagation must be slower than interictal propagation through networks that are more fully recovered (Figs. 8C, 12C). Third, to be partly depressed, the network must have undergone a recent activation to support seizure activity. Such activation could be provided by pre-ictal spikes and rhythmic activities that precede seizures in human recordings (Ralston, 1958; Fisher et al., 1992; Bartolomei et al., 2004; Huberfeld et al., 2011). Fourth, the spiral wavefronts seen in these simulations have been recorded in the neocortex (Rossi et al., 2017), where the physical neuronal distribution is closer to the distribution of neurons in our 2D model. Fifth, the model generated activity with the temporal characteristics of spikes (homogeneously brief) and seizures (two orders of magnitude longer, and of variable duration) established by clinical and experimental observations (Afra et al., 2008; Kim et al., 2011; Staba et al., 2014).
The number of parameters explored over the several years of work on this project still represents only a tiny fraction of the parameter space of a 10,000 neuron network, and the number of parameters used to describe each neuron was also simplified. The synaptic connectivity in the model (40 one-way inputs and 40 one-way outputs) represents a simplification factor of 4 in connectivity if only the strongest synapses are considered, and a factor of 15 if all synapses regardless of strength are considered. These simplifications may reduce the accuracy of the simulations (Horwitz, 2003), although the simplified network generates the fundamental result of ictal spiral waves that have recently been recorded in experimental and human seizures (Viventi et al., 2011; González-Ramírez et al., 2015; Smith et al., 2016; Rossi et al., 2017). Further, the simulations were run in a 2D network. These simplifications were used for practical reasons. Expanding the number of synapses or network dimensions would have been prohibitive in terms of computational time and resources. Our experimental experience with epileptic networks is based on acute and organotypic hippocampal networks that are largely 2D. The 2D networks also facilitated the visualization of network activity. Larger and 3D networks comprised of more realistically heterogeneous neurons and synapses (Markram et al., 2015) would provide a more realistic number of paths for propagation of ictal wavefronts, which would likely expand the variety of ictogenic conditions. However, we would expect that these more complex networks would still demonstrate that seizure probability is dependent on synaptic depression and recovery, coalescence of spiking activity into traveling wavefronts, the propagation velocity of these wavefronts, and network dimensions.
Neurons in biological networks are not laid out in a grid as in Figure 1. Imaging of the activity of individual neurons will therefore lead to more complex ictal activity patterns that may not look like logarithmic spirals (Fig. 11). However, in real networks with these more complex anatomical synaptic distributions, the spread of ictal activity is still congruent with the relationship we describe between the dimensions of the network, the velocity of spread, and the rate of synaptic recovery (Fig. 12). Spatial rearrangement of synaptic connectivity demonstrates consistent spiral waves in the calcium imaging data (Fig. 11). More regular patterns of synaptic connectivity in the neocortex, particularly after imposition of homogenizing conditions, such as the blockade of inhibition (Sabolek et al., 2012), produce more obvious ictal spiral waves (Viventi et al., 2011; González-Ramírez et al., 2015; Smith et al., 2016). We did not investigate the effects of network inhomogeneities, but it may very well be that local changes in the density of recurrent synapses, such as might occur in a damaged, gliotic hippocampal network (Blümcke et al., 1999; Thom, 2014), would slow the propagation of the wavefront of neural activity and thereby increase the probability of ictogenic reentrant activity.
Electrical brain stimulation is now being used to prevent seizures, although the mechanisms are not known (Fisher and Velasco, 2014). Understanding the relationship between pre-ictal activity, the resulting induced refractoriness, and the consequent seizure probability (Fig. 8C) may provide the framework for developing more effective anticonvulsant stimulation strategies.
Our next steps are to transfer the insights gained from this model to biological experiments in an isolated preparation that undergoes spontaneous interictal-to-ictal transitions, such as the organotypic hippocampal slice culture preparations (Lillis et al., 2015) to develop strategies to interrupt or prevent ictogenesis.
Footnotes
This work was supported by National Institutes of Health Grants R01NS086364 and 2R37NS077908-05A1.
The authors declare no competing financial interests.
References
- Afra P, Jouny CC, Bergey GK (2008) Duration of complex partial seizures: an intracranial EEG study. Epilepsia 49:677–684. 10.1111/j.1528-1167.2007.01420.x [DOI] [PubMed] [Google Scholar]
- Alivisatos AP, Chun M, Church GM, Deisseroth K, Donoghue JP, Greenspan RJ, McEuen PL, Roukes ML, Sejnowski TJ, Weiss PS, Yuste R (2013) The brain activity map. Science 339:1284–1285. 10.1126/science.1236939 [DOI] [PMC free article] [PubMed] [Google Scholar]
- Ayala GF, Dichter M, Gumnit RJ, Matsumoto H, Spencer WA (1973) Genesis of epileptic interictal spikes: new knowledge of cortical feedback systems suggests a neurophysiological explanation of brief paroxysms. Brain Res 52:1–17. 10.1016/0006-8993(73)90647-1 [DOI] [PubMed] [Google Scholar]
- Barabasi AL, Albert R (1999) Emergence of scaling in random networks. Science 286:509–512. 10.1126/science.286.5439.509 [DOI] [PubMed] [Google Scholar]
- Barardi A, Garcia-Ojalvo J, Mazzoni A (2016) Transition between functional regimes in an integrate-and-fire network model of the thalamus. PLoS One 11:e1061934. 10.1371/journal.pone.0161934 [DOI] [PMC free article] [PubMed] [Google Scholar]
- Bartolomei F, Wendling F, Régis J, Gavaret M, Guye M, Chauvel P (2004) Pre-ictal synchronicity in limbic networks of mesial temporal lobe epilepsy. Epilepsy Res 61:89–104. 10.1016/j.eplepsyres.2004.06.006 [DOI] [PubMed] [Google Scholar]
- Behrens TE, Sporns O (2012) Human connectomics. Curr Opin Neurobiol 22:144–153. 10.1016/j.conb.2011.08.005 [DOI] [PMC free article] [PubMed] [Google Scholar]
- Berdichevsky Y, Dzhala V, Mail M, Staley KJ (2012) Interictal spikes, seizures and ictal cell death are not necessary for post-traumatic epileptogenesis in vitro. Neurobiol Dis 45:774–785. 10.1016/j.nbd.2011.11.001 [DOI] [PMC free article] [PubMed] [Google Scholar]
- Berdichevsky Y, Dryer AM, Saponjian Y, Mahoney MM, Pimentel CA, Lucini CA, Usenovic M, Staley KJ (2013) PI3K-Akt signaling activates mTOR-mediated epileptogenesis in organotypic hippocampal culture model of post-traumatic epilepsy. J Neurosci 33:9056–9067. 10.1523/JNEUROSCI.3870-12.2013 [DOI] [PMC free article] [PubMed] [Google Scholar]
- Blauwblomme T, Jiruska P, Huberfeld G (2014) Mechanisms of ictogenesis, Ed 1 Amsterdam: Elsevier. [DOI] [PubMed] [Google Scholar]
- Blümcke I, Zuschratter W, Schewe JC, Suter B, Lie AA, Riederer BM, Meyer B, Schramm J, Elger CE, Wiestler OD (1999) Cellular pathology of hilar neurons in Ammon's horn sclerosis. J Comp Neurol 414:437–453. [DOI] [PubMed] [Google Scholar]
- Bullmore E, Sporns O (2012) The economy of brain network organization. Nat Rev Neurosci 13:336–349. 10.1038/nrn3214 [DOI] [PubMed] [Google Scholar]
- Buzsáki G, Bayardo F, Miles R, Wong RK, Gage FH (1989) The grafted hippocampus: an epileptic focus. Exp Neurol 105:10–22. 10.1016/0014-4886(89)90167-2 [DOI] [PubMed] [Google Scholar]
- Cios KJ, Swiercz W, Jackson W (2004) Networks of spiking neurons in modeling and problem solving. Neurocomputing 61: 99–119. 10.1016/j.neucom.2004.03.007 [DOI] [Google Scholar]
- Comtois P, Kneller J, Nattel S (2005) Of circles and spirals: bridging the gap between the leading circle and spiral wave concepts of cardiac reentry. Europace 7:10–20. 10.1016/j.eupc.2005.05.011 [DOI] [PubMed] [Google Scholar]
- Cowan JD, Neuman J, van Drongelen W (2016) Wilson-Cowan Equations for Neocortical Dynamics. J Math Neurosci 6:1. 10.1186/s13408-015-0034-5 [DOI] [PMC free article] [PubMed] [Google Scholar]
- de Curtis M, Avanzini G (2001) Interictal spikes in focal epileptogenesis. Prog Neurobiol 63:541–567. 10.1016/S0301-0082(00)00026-5 [DOI] [PubMed] [Google Scholar]
- Dichter MA, Ayala GF (1987) Cellular mechanisms of epilepsy: a status report. Science 237:157–164. 10.1126/science.3037700 [DOI] [PubMed] [Google Scholar]
- Dobrunz LE, Stevens CF (1997) Heterogeneity of release probability, facilitation, and depletion at central synapses. Neuron 18:995–1008. 10.1016/S0896-6273(00)80338-4 [DOI] [PubMed] [Google Scholar]
- Dyhrfjeld-Johnsen J, Berdichevsky Y, Swiercz W, Sabolek H, Staley KJ (2010) Interictal spikes precede ictal discharges in an organotypic hippocampal slice culture model of epileptogenesis. J Clin Neurophysiol 27:418–424. 10.1097/WNP.0b013e3181fe0709 [DOI] [PMC free article] [PubMed] [Google Scholar]
- Dzhala VI, Staley KJ (2003) Transition from interictal to ictal activity in limbic networks in vitro. J Neurosci 23:7873–7880. 10.1523/JNEUROSCI.23-21-07873.2003 [DOI] [PMC free article] [PubMed] [Google Scholar]
- Feldt S, Bonifazi P, Cossart R (2011) Dissecting functional connectivity of neuronal microcircuits: experimental and theoretical insights. Trends Neurosci 34:225–236. 10.1016/j.tins.2011.02.007 [DOI] [PubMed] [Google Scholar]
- Fisher RS, Velasco AL (2014) Electrical brain stimulation for epilepsy. Nat Rev Neurol 10:261–270. 10.1038/nrneurol.2014.59 [DOI] [PubMed] [Google Scholar]
- Fisher RS, Webber WR, Lesser RP, Arroyo S, Uematsu S (1992) High-frequency EEG activity at the start of seizures. J Clin Neurophysiol 9:441–448. 10.1097/00004691-199207010-00012 [DOI] [PubMed] [Google Scholar]
- Fisher RS, van Emde Boas W, Blume W, Elger C, Genton P, Lee P, Engel J Jr (2005) Epileptic seizures and epilepsy: definitions proposed by the International League Against Epilepsy (ILAE) and the International Bureau for Epilepsy (IBE). Epilepsia 46:470–472. 10.1111/j.0013-9580.2005.66104.x [DOI] [PubMed] [Google Scholar]
- Gähwiler BH. (1981) Organotypic monolayer cultures of nervous tissue. J Neurosci Methods 4:329–342. 10.1016/0165-0270(81)90003-0 [DOI] [PubMed] [Google Scholar]
- González-Ramírez LR, Ahmed OJ, Cash SS, Wayne CE, Kramer MA (2015) A biologically constrained, mathematical model of cortical wave propagation preceding seizure termination. PLoS Comput Biol 11:e1004065. 10.1371/journal.pcbi.1004065 [DOI] [PMC free article] [PubMed] [Google Scholar]
- Gutnick MJ, Wolfson B, Baldino F Jr (1989) Synchronized neuronal activities in neocortical explant cultures. Exp Brain Res 76:131–140. [DOI] [PubMed] [Google Scholar]
- Hagan PS. (1982) Spiral waves in reaction-diffusion equations. SIAM J Appl Math 42:762–787. [Google Scholar]
- Hassan M, Merlet I, Mheich A, Kabbara A, Biraben A, Nica A, Wendling F (2017) Identification of Interictal Epileptic Networks from Dense-EEG. Brain Topogr 30:60–76. 10.1007/s10548-016-0517-z [DOI] [PubMed] [Google Scholar]
- Hodgkin AL, Huxley AF (1952) A quantitative description of membrane current and its application to conduction and excitation in nerve. J Physiol 117:500–544. 10.1113/jphysiol.1952.sp004764 [DOI] [PMC free article] [PubMed] [Google Scholar]
- Horwitz B. (2003) The elusive concept of brain connectivity. Neuroimage 19:466–470. 10.1016/S1053-8119(03)00112-5 [DOI] [PubMed] [Google Scholar]
- Huang X, Troy WC, Yang Q, Ma H, Laing CR, Schiff SJ, Wu JY (2004) Spiral waves in mammalian neocortex. J Neurosci 24:9897–9902. 10.1523/JNEUROSCI.2705-04.2004 [DOI] [PMC free article] [PubMed] [Google Scholar]
- Huberfeld G, Menendez de la Prida L, Pallud J, Cohen I, Le Van Quyen M, Adam C, Clemenceau S, Baulac M, Miles R (2011) Glutamatergic pre-ictal discharges emerge at the transition to seizure in human epilepsy. Nat Neurosci 14:627–634. 10.1038/nn.2790 [DOI] [PubMed] [Google Scholar]
- Jirsa VK, Stacey WC, Quilichini PP, Ivanov AI, Bernard C (2014) On the nature of seizure dynamics. Brain 137:2210–2230. 10.1093/brain/awu133 [DOI] [PMC free article] [PubMed] [Google Scholar]
- Jouny CC, Franaszczuk PJ, Bergey GK (2005) Signal complexity and synchrony of epileptic seizures: is there an identifiable preictal period? Clin Neurophysiol 116:552–558. 10.1016/j.clinph.2004.08.024 [DOI] [PubMed] [Google Scholar]
- Karoly PJ, Freestone DR, Boston R, Grayden DB, Himes D, Leyde K, Seneviratne U, Berkovic S, O'Brien T, Cook MJ (2016) Interictal spikes and epileptic seizures: their relationship and underlying rhythmicity. Brain 139:1066–1078. 10.1093/brain/aww019 [DOI] [PubMed] [Google Scholar]
- Kim D, Cho JW, Lee J, Joo EY, Hong SC, Hong SB, Seo DW (2011) Seizure duration determined by subdural electrode recordings in adult patients with intractable focal epilepsy. J Epilepsy Res 1:57–64. 10.14581/jer.11011 [DOI] [PMC free article] [PubMed] [Google Scholar]
- Kitano K, Fukai T (2007) Variability vs. synchronicity of neuronal activity in local cortical network models with different wiring topologies. J Comput Neurosci 23:237–250. 10.1007/s10827-007-0030-1 [DOI] [PubMed] [Google Scholar]
- Le Duigou C, Simonnet J, Teleñczuk MT, Fricker D, Miles R (2014) Recurrent synapses and circuits in the CA3 region of the hippocampus: an associative network. Front Cell Neurosci 7:262. 10.3389/fncel.2013.00262 [DOI] [PMC free article] [PubMed] [Google Scholar]
- Lillis KP, Wang Z, Mail M, Zhao GQ, Berdichevsky Y, Bacskai B, Staley KJ (2015) Evolution of network synchronization during early epileptogenesis parallels synaptic circuit alterations. J Neurosci 35:9920–9934. 10.1523/JNEUROSCI.4007-14.2015 [DOI] [PMC free article] [PubMed] [Google Scholar]
- Lindén H, Tetzlaff T, Potjans TC, Pettersen KH, Grün S, Diesmann M, Einevoll GT (2011) Modeling the spatial reach of the LFP. Neuron 72:859–872. 10.1016/j.neuron.2011.11.006 [DOI] [PubMed] [Google Scholar]
- Liu J, Saponjian Y, Mahoney MM, Staley KJ, Berdichevsky Y (2017) Epileptogenesis in organotypic hippocampal cultures has limited dependence on culture medium composition. PLoS One 12:e0172677. 10.1371/journal.pone.0172677 [DOI] [PMC free article] [PubMed] [Google Scholar]
- Lytton WW. (2008) Computer modelling of epilepsy. Nat Rev Neurosci 9:626–637. 10.1038/nrn2416 [DOI] [PMC free article] [PubMed] [Google Scholar]
- MacGregor RJ, Oliver RM (1974) A model for repetitive firing in neurons. Kybernetik 16:53–64. 10.1007/BF00270295 [DOI] [PubMed] [Google Scholar]
- Markram H, Muller E, Ramaswamy S, Reimann MW, Abdellah M, Sanchez CA, Ailamaki A, Alonso-Nanclares L, Antille N, Arsever S, Kahou GA, Berger TK, Bilgili A, Buncic N, Chalimourda A, Chindemi G, Courcol JD, Delalondre F, Delattre V, Druckmann S et al. (2015) Reconstruction and Simulation of Neocortical Microcircuitry. Cell 163:456–492. 10.1016/j.cell.2015.09.029 [DOI] [PubMed] [Google Scholar]
- Matsumoto H, Marsan CA (1964) Cortical cellular phenomena in experimental epilepsy: interictal manifestations. Exp Neurol 9:286–304. 10.1016/0014-4886(64)90025-1 [DOI] [PubMed] [Google Scholar]
- Mazzoni A, Lindén H, Cuntz H, Lansner A, Panzeri S, Einevoll GT (2015) Computing the local field potential (LFP) from integrate-and-fire network models. PLoS Comput Biol 11:e1004584. 10.1371/journal.pcbi.1004584 [DOI] [PMC free article] [PubMed] [Google Scholar]
- McBain C, Dingledine R (1992) Dual-component miniature excitatory synaptic currents in rat hippocampal CA3 pyramidal neurons. J Neurophysiol 68:16–27. 10.1152/jn.1992.68.1.16 [DOI] [PubMed] [Google Scholar]
- McBain CJ, Boden P, Hill RG (1989) Rat hippocampal slices 'in vitro' display spontaneous epileptiform activity following long-term organotypic culture. J Neurosci Methods 27:35–49. 10.1016/0165-0270(89)90051-4 [DOI] [PubMed] [Google Scholar]
- Milanowski P, Suffczynski P (2016) Seizures start without common signatures of critical transition. Int J Neural Syst 26:1650053. 10.1142/S0129065716500532 [DOI] [PubMed] [Google Scholar]
- Morgan RJ, Soltesz I (2008) Nonrandom connectivity of the epileptic dentate gyrus predicts a major role for neuronal hubs in seizures. Proc Natl Acad Sci U S A 105:6179–6184. 10.1073/pnas.0801372105 [DOI] [PMC free article] [PubMed] [Google Scholar]
- Muldoon SF, Villette V, Tressard T, Malvache A, Reichinnek S, Bartolomei F, Cossart R (2015) GABAergic inhibition shapes interictal dynamics in awake epileptic mice. Brain 138:2875–2890. 10.1093/brain/awv227 [DOI] [PubMed] [Google Scholar]
- Naze S, Bernard C, Jirsa V (2015) Computational modeling of seizure dynamics using coupled neuronal networks: factors shaping epileptiform activity. PLoS Comput Biol 11:e1004209. 10.1371/journal.pcbi.1004209 [DOI] [PMC free article] [PubMed] [Google Scholar]
- Netoff TI, Clewley R, Arno S, Keck T, White JA (2004) Epilepsy in small-world networks. J Neurosci 24:8075–8083. 10.1523/JNEUROSCI.1509-04.2004 [DOI] [PMC free article] [PubMed] [Google Scholar]
- O'Donnell C, Gonçalves JT, Portera-Cailliau C, Sejnowski TJ (2017) Beyond excitation/inhibition imbalance in multidimensional models of neural circuit changes in brain disorders. Elife 6:e26724. 10.7554/eLife.26724 [DOI] [PMC free article] [PubMed] [Google Scholar]
- O'Leary T, Sutton AC, Marder E (2015) Computational models in the age of large datasets. Curr Opin Neurobiol 32:87–94. 10.1016/j.conb.2015.01.006 [DOI] [PMC free article] [PubMed] [Google Scholar]
- Oh SW, Harris JA, Ng L, Winslow B, Cain N, Mihalas S, Wang Q, Lau C, Kuan L, Henry AM, Mortrud MT, Ouellette B, Nguyen TN, Sorensen SA, Slaughterbeck CR, Wakeman W, Li Y, Feng D, Ho A, Nicholas E, et al. (2014) A mesoscale connectome of the mouse brain. Nature 508:207–214. 10.1038/nature13186 [DOI] [PMC free article] [PubMed] [Google Scholar]
- Prince D, Parada I, Graber K (2012) Traumatic brain injury and posttraumatic epilepsy. In: Jasper's basic mechanisms of the epilepsies [Internet] (Noebels JL, Avoli M, Rogawski MA, Olsen RW, Delgado-Escueta AV, eds), Ed 4 Bethesda, MD: National Center for Biotechnology Information. [PubMed] [Google Scholar]
- Ralston BL. (1958) The mechanism of transition of interictal spiking foci into ictal seizure discharges. Electroencephalogr Clin Neurophysiol 10:217–232. 10.1016/0013-4694(58)90029-4 [DOI] [PubMed] [Google Scholar]
- Reimann MW, King JG, Muller EB, Ramaswamy S, Markram H (2015) An algorithm to predict the connectome of neural microcircuits. Front Comput Neurosci 9:120. 10.3389/fncom.2015.00120 [DOI] [PMC free article] [PubMed] [Google Scholar]
- Rizzoli SO, Betz WJ (2005) Synaptic vesicle pools. Nat Rev Neurosci 6:57–69. 10.1038/nrn1583 [DOI] [PubMed] [Google Scholar]
- Rossi LF, Wykes RC, Kullmann DM, Carandini M (2017) Focal cortical seizures start as standing waves and propagate respecting homotopic connectivity. Nat Commun 8:217. 10.1038/s41467-017-00159-6 [DOI] [PMC free article] [PubMed] [Google Scholar]
- Rothman JS, Silver RA (2014) Data-driven modeling of synaptic transmission and integration. Prog Mol Biol Transl Sci 123:305–350. 10.1016/B978-0-12-397897-4.00004-8 [DOI] [PMC free article] [PubMed] [Google Scholar]
- Roy RD, Stefan MI, and Rosenmund C (2014) Biophysical properties of presynaptic short-term plasticity in hippocampal neurons: insights from electrophysiology, imaging and mechanistic models. Front Cell Neurosci 8:141. [DOI] [PMC free article] [PubMed] [Google Scholar]
- Rozenfeld AF, Cohen R, Ben-Avraham D, Havlin S (2002) Scale-free networks on lattices. Phys Rev Lett 89:218701. 10.1103/PhysRevLett.89.218701 [DOI] [PubMed] [Google Scholar]
- Sabolek HR, Swiercz WB, Lillis KP, Cash SS, Huberfeld G, Zhao G, Ste Marie L, Clemenceau S, Barsh G, Miles R, Staley KJ (2012) A candidate mechanism underlying the variance of interictal spike propagation. J Neurosci 32:3009–3021. 10.1523/JNEUROSCI.5853-11.2012 [DOI] [PMC free article] [PubMed] [Google Scholar]
- Santhakumar V, Aradi I, Soltesz I (2005) Role of mossy fiber sprouting and mossy cell loss in hyperexcitability: a network model of the dentate gyrus incorporating cell types and axonal topography. J Neurophysiol 93:437–453. 10.1152/jn.00777.2004 [DOI] [PubMed] [Google Scholar]
- Smith EH, Liou JY, Davis TS, Merricks EM, Kellis SS, Weiss SA, Greger B, House PA, McKhann GM 2nd, Goodman RR, Emerson RG, Bateman LM, Trevelyan AJ, Schevon CA (2016) The ictal wavefront is the spatiotemporal source of discharges during spontaneous human seizures. Nat Commun 7:11098. 10.1038/ncomms11098 [DOI] [PMC free article] [PubMed] [Google Scholar]
- Staba RJ, Stead M, Worrell GA (2014) Electrophysiological biomarkers of epilepsy. Neurotherapeutics 11:334–346. 10.1007/s13311-014-0259-0 [DOI] [PMC free article] [PubMed] [Google Scholar]
- Staley K. (2015) Molecular mechanisms of epilepsy. Nat Neurosci 18:367–372. 10.1038/nn.3947 [DOI] [PMC free article] [PubMed] [Google Scholar]
- Staley KJ, Longacher M, Bains JS, Yee A (1998) Presynaptic modulation of CA3 network activity. Nat Neurosci 1:201–209. 10.1038/651 [DOI] [PubMed] [Google Scholar]
- Staley KJ, Bains JS, Yee A, Hellier J, Longacher JM (2001) Statistical model relating CA3 burst probability to recovery from burst-induced depression at recurrent collateral synapses. J Neurophysiol 86:2736–2747. 10.1152/jn.2001.86.6.2736 [DOI] [PubMed] [Google Scholar]
- Stevens CF, Tsujimoto T (1995) Estimates for the pool size of releasable quanta at a single central synapse and for the time required to refill the pool. Proc Natl Acad Sci U S A 192:846–849. 10.1073/pnas.92.3.846 [DOI] [PMC free article] [PubMed] [Google Scholar]
- Stoppini L, Buchs PA, Muller D (1991) A simple method for organotypic cultures of nervous tissue. J Neurosci Methods 37:173–182. 10.1016/0165-0270(91)90128-M [DOI] [PubMed] [Google Scholar]
- Swiercz W, Cios KJ, Staley K, Kurgan L, Accurso F, Sagel S (2006) A new synaptic plasticity rule for networks of spiking neurons. IEEE Trans Neural Netw 17:94–105. 10.1109/TNN.2005.860834 [DOI] [PubMed] [Google Scholar]
- Swiercz W, Cios K, Hellier J, Yee A, Staley K (2007) Effects of synaptic depression and recovery on synchronous network activity. J Clin Neurophysiol 24:165–174. 10.1097/WNP.0b013e318033756f [DOI] [PubMed] [Google Scholar]
- Tao JX, Ray A, Hawes-Ebersole S, Ebersole JS (2005) Intracranial EEG substrates of scalp EEG interictal spikes. Epilepsia 46:669–676. 10.1111/j.1528-1167.2005.11404.x [DOI] [PubMed] [Google Scholar]
- Tauck DL, Nadler JV (1985) Evidence of functional mossy fiber sprouting in hippocampal formation of kainic acid-treated rats. J Neurosci 5:1016–1022. 10.1523/JNEUROSCI.05-04-01016.1985 [DOI] [PMC free article] [PubMed] [Google Scholar]
- Tinevez J-Y, Perry N, Schindelin J, Hoopes GM, Reynolds GD, Laplantine E, Bednarek SY, Shorte SL, Eliceiri KW (2017) TrackMate: An open and extensible platform for single-particle tracking. Methods 115:80–90. 10.1016/j.ymeth.2016.09.016 [DOI] [PubMed] [Google Scholar]
- Thom M. (2014) Review: hippocampal sclerosis in epilepsy: a neuropathology review. Neuropathol Appl Neurobiol 40:520–543. 10.1111/nan.12150 [DOI] [PMC free article] [PubMed] [Google Scholar]
- Traub RD, Miles R (1991) Neuronal networks of the hippocampus. New York: Cambridge UP. [Google Scholar]
- Treiman DM. (2001) GABAergic mechanisms in epilepsy. Epilepsia 42:8–12. 10.1046/j.1528-1157.2001.042suppl.3008.x [DOI] [PubMed] [Google Scholar]
- van Drongelen W, Lee HC, Hereld M, Chen Z, Elsen FP, Stevens RL (2005) Emergent epileptiform activity in neural networks with weak excitatory synapses. IEEE Trans Neural Syst Rehabil Eng 13:236–241. 10.1109/TNSRE.2005.847387 [DOI] [PubMed] [Google Scholar]
- van Drongelen W, Lee HC, Stevens RL, Hereld M (2007) Propagation of seizure-like activity in a model of neocortex. J Clin Neurophysiol 24:182–188. 10.1097/WNP.0b013e318039b4de [DOI] [PubMed] [Google Scholar]
- Viventi J, Kim DH, Vigeland L, Frechette ES, Blanco JA, Kim YS, Avrin AE, Tiruvadi VR, Hwang SW, Vanleer AC, Wulsin DF, Davis K, Gelber CE, Palmer L, Van der Spiegel J, Wu J, Xiao J, Huang Y, Contreras D, Rogers JA, et al. (2011) Flexible, foldable, actively multiplexed, high-density electrode array for mapping brain activity in vivo. Nat Neurosci 14:1599–1605. 10.1038/nn.2973 [DOI] [PMC free article] [PubMed] [Google Scholar]
- Watts DJ, Strogatz SH (1998) Collective dynamics of “small-world” networks. Nature 393:440–442. 10.1038/30918 [DOI] [PubMed] [Google Scholar]
- Wendling F, Benquet P, Bartolomei F, Jirsa V (2016) Computational models of epileptiform activity. J Neurosci Methods 260:233–251. 10.1016/j.jneumeth.2015.03.027 [DOI] [PubMed] [Google Scholar]
Associated Data
This section collects any data citations, data availability statements, or supplementary materials included in this article.
Supplementary Materials
Neuronal spiking activity during interictal spike activity. Color represents membrane potential for each cell: warmer color tone represents more depolarized. The video is shown at 0.03× real-time. The rapid propagation of the interictal spike wavefront is further accelerated by long-range projections, which initiate new wavefronts, rapidly synchronizing the entire network.

Neuronal spiking activity during seizure activity. As in Movie 1, color represents membrane potential for each cell and the video is shown at 0.03× real-time. This movie takes place immediately following the spiking in Movie 1. The rapidly synchronizing spikes are replaced by a slow traveling wave, which did not initiate additional distal wavefronts due to synaptic depression.


