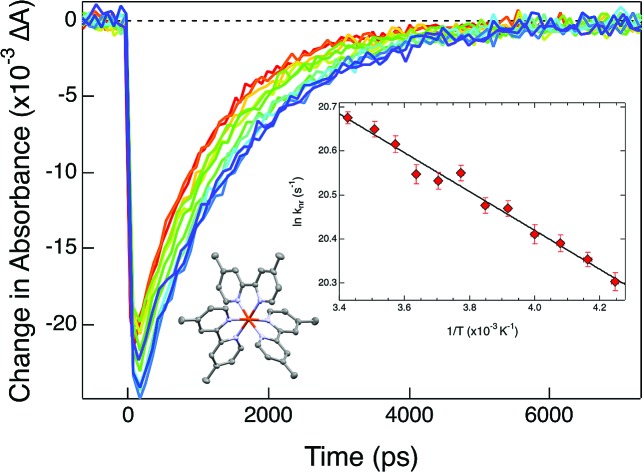
 In order to better define the nature of the nuclear coordinate associated with excited state dynamics in first-row transition metal chromophores, variable-temperature ultrafast time-resolved absorption spectroscopy has been used to determine activation parameters associated with ground state recovery in a series of low-spin Fe(ii) polypyridyl complexes.
Abstract
In an effort to better define the nature of the nuclear coordinate associated with excited state dynamics in first-row transition metal-based chromophores, variable-temperature ultrafast time-resolved absorption spectroscopy has been used to determine activation parameters associated with ground state recovery dynamics in a series of low-spin Fe(ii) polypyridyl complexes. Our results establish that high-spin (5T2) to low-spin (1A1) conversion in complexes of the form [Fe(4,4′-di-R-2,2′-bpy′)3]2+ (R = H, CH3, or tert-butyl) is characterized by a small but nevertheless non-zero barrier in the range of 300–350 cm–1 in fluid CH3CN solution, a value that more than doubles to ∼750 cm–1 for [Fe(terpy)2]2+ (terpy = 2,2′:6′,2′′-terpyridine). The data were analyzed in the context of semi-classical Marcus theory. Changes in the ratio of the electronic coupling to reorganization energy (specifically, Hab4/λ) reveal an approximately two-fold difference between the [Fe(bpy′)3]2+ complexes (∼1/30) and [Fe(terpy)2]2+ (∼1/14), suggesting a change in the nature of the nuclear coordinate associated with ground state recovery between these two types of complexes. These experimentally-determined ratios, along with estimates for the 5T2/1A1 energy gap, yield electronic coupling values between these two states for the [Fe(bpy′)3]2+ series and [Fe(terpy)2]2+ of 4.3 ± 0.3 cm–1 and 6 ± 1 cm–1, respectively, values that are qualitatively consistent with the second-order nature of high-spin/low-spin coupling in a d6 ion. In addition to providing useful quantitative information on these prototypical Fe(ii) complexes, these results underscore the utility of variable-temperature spectroscopic measurements for characterizing ultrafast excited state dynamics in this class of compounds.
Introduction
Transition metal-based compounds represent an important class of chromophores, with interest linked to questions concerning fundamental aspects of excited state dynamics to applications in areas ranging from solar energy conversion to organic synthesis.1,2 Complexes possessing intense charge-transfer absorption features have garnered the most attention due to the intrinsically redox-active nature of these sorts of excited states. [Ru(bpy)3]2+ (bpy = 2,2′-bipyridine) represents the prototype of such compounds, with a metal-to-ligand charge transfer (MLCT) state whose intramolecular charge separation allows it to act as either a photoreductant or photooxidant and a sufficiently long lifetime to enable it to engage in a bimolecular reaction chemistry.3 When combined with ability to use synthesis to modulate the excited state redox potentials, lifetimes, and spatial localization, it is no surprise that complexes of this general type have found utility across a range of disciplines.
Recent interest in the creation of molecular functionality based on earth-abundant materials has triggered efforts to develop analogs of compounds like [Ru(bpy)3]2+ but employing the more widely available metals of the first transition series. As is the case for ruthenium, metal polypyridyl complexes have provided a convenient platform for these efforts, with [Fe(bpy)3]2+ being one of the most well-studied as well as serving as an excellent template for illustrating fundamental principles underpinning d6 photophysics as they manifest in the first transition series.4 For this chromophore, absorption of visible light excites the low-spin 1A1 ground state into the singlet metal-to-ligand charge transfer (1MLCT) state, whereupon ultrafast intersystem crossing to the 3MLCT occurs in ∼20 fs.5 In contrast to their heavier group 8 congeners, whose 3MLCT states can last for several microseconds in deoxygenated solvents, deactivation out of the MLCT manifold occurs on the order of 100 fs with near-unit efficiency.6,7 These ultrafast non-radiative decay dynamics occur due to the presence of ligand field states that lie below the MLCT manifold (in contrast to [Ru(bpy)3]2+, in which these relative energetics are reversed). The lowest energy excited state – which for [Fe(bpy)3]2+ is the high-spin 5T2 state – is formed in less than 200 fs through a cascade of processes.8–11 Ground state recovery from this ligand field state occurs on the order of nanoseconds,12 the dynamics of which can be influenced to some extent by the solvent.13 This paradigm is being challenged recently through the work of Wärnmark and co-workers, who have exploited the strong σ-donating properties of N-heterocyclic carbene ligands to destabilize the ligand field states and realize 3MLCT lifetimes on the order of hundreds of picoseconds.14 This groundbreaking work notwithstanding, all known low-spin Fe(ii) polypyridyl chromophores undergo ultrafast charge transfer deactivation as just described.
Despite the knowledge that has been gained from time-resolved optical5 and X-ray measurements9 previously carried out on [Fe(bpy)3]2+, there remain a surprising number of unanswered fundamental questions about this model complex, for instance, although attempts have been made to estimate the driving force (ΔG0) between the ground state and lowest energy excited state (1A1/5T2), a range of values spanning nearly 1 eV (i.e., 2000–9000 cm–1) have been posited in the literature.15–18 The underlying reason for this ambiguity is understandable: whereas steady-state emission spectroscopy and/or electrochemistry can be used to estimate ΔG0 for charge transfer states, the non-emissive, ligand-field nature of the 5T2 → 1A1 transition renders the application of these methods ineffectual. Values for the reorganization energy (λ) that characterizes the 5T2 → 1A1 conversion – a parameter that contains information about the structural distortions relevant for the kinetics of ground state recovery – as well as the magnitude of the electronic coupling between the two electronic states (Hab) have also been estimated but not directly measured. For example, Sutin used the lifetime of the 5T2 excited state of [Fe(bpy)3]2+ in a Marcus-type analysis to suggest ΔG0 = –7300 cm–1, λ = 4800 and Hab = 20–200 cm–1 as reasonable parameters for describing the potential energy surfaces defining the compound's ground state recovery dynamics.15 Soon thereafter, Jortner and co-workers applied second-order perturbation theory to approximate Hab at 170 cm–1.18 Hauser and co-workers studied [Fe(bpy)3]2+ doped into a Zn(ii) lattice by variable-temperature time-resolved absorption spectroscopy.17 Using Jortner's estimate of the electronic coupling matrix element, these researchers determined the activation energy (Ea) of ground state recovery to be 364 cm–1 for a driving force of –2000 cm–1. As part of a study on a series of spin-crossover complexes, Conti et al. studied a low-spin Fe(ii) complex possessing a relatively long-lived excited state using variable-temperature nanosecond time-resolved transient absorption spectroscopy in solution.19 In contrast to the results of Jortner, the analysis presented by Conti indicated an electronic coupling constant of < 10 cm–1 for the 5T2 → 1A1 conversion, a significant difference given that the rate constant for nonradiative decay scales as the square of this matrix element. While the approach by Conti is promising, a direct application of their methods is not possible in the case of compounds like [Fe(bpy)3]2+ due to the fact that this molecule is not a spin-crossover complex (i.e., ΔG0 ≫ kBT) and therefore not susceptible to environmental perturbations that allow one to quantify these sorts of thermodynamic parameters.
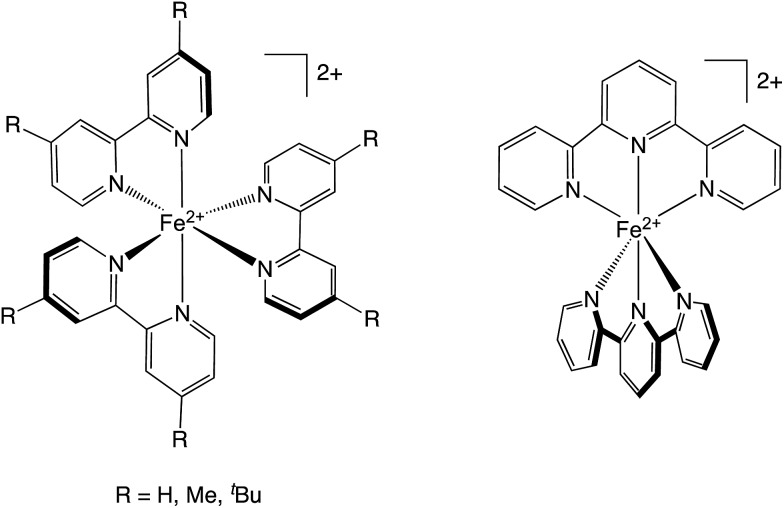
As part of a broader effort to better understand the energetics as well as the nature of the nuclear coordinate(s) that define the photo-induced intramolecular dynamics of low-spin Fe(ii)-based chromophores, we sought to develop a more quantitative picture of the solution-phase ground state recovery dynamics of [Fe(bpy)3]2+ and in so doing develop a general methodology for examining in greater detail the factors driving the kinetics of this class of compounds. In this report, we present the results of an ultrafast variable-temperature time-resolved absorption study of a series of Fe(ii) polypyridyl chromophores (Chart 1), describing for the first time the activation parameters associated with the ultrafast (i.e., sub-nanosecond) dynamics of this class of compounds. An analysis of the relaxation kinetics has served to quantify activation energies and frequency factors, which in turn provide insights into the electronic coupling and reorganization energy associated with the 5T2 → 1A1 conversion by correlating the experimental Arrhenius parameters to nonradiative decay theory. Specifically, the data indicate that the ligation motif (that is, a tris-bidentate versus bis-tridentate coordination environment) has a measurable effect on the specific vibrational modes that serve to define the nuclear coordinate for ground state recovery, suggesting that variable-temperature ultrafast spectroscopy combined with synthetic design can be a powerful tool for controlling the excited state dynamics of this class of chromophores.
Chart 1. The four complexes used in these studies. Left: [Fe(bpy′)3]2+ family, in which R = H for [Fe(bpy)3]2+, CH3 for [Fe(dmb)3]2+, and tert-butyl for [Fe(dtbb)3]2+. Right: [Fe(terpy)2]2+.
Experimental
Materials and synthesis
[Fe(bpy)3](PF6)2, (bpy = 2,2-bipyridine), [Fe(dmb)3](PF6)2 (dmb = 4,4′-dimethyl-2,2′-bipyridine), [Fe(dtbb)3](PF6)2 (dtbb = 4,4′-di-tert-butyl-2,2′-bipyridine), and [Fe(terpy)2](PF6)2 (terpy = 2,2′:6′,2′′-terpyridine) were prepared according to previously reported procedures.20–22 HPLC-grade acetonitrile was purchased from Sigma-Aldrich and used as received. Ground state absorption spectra were collected on a Varian Cary 50 UV-Vis spectrophotometer. Single crystal X-ray diffraction was collected on suitable crystals mounted on a Bruker APEX-II CCD diffractometer with CuKα radiation at the Center for Crystallographic Research at Michigan State University. Electrochemical data were collected using a CH Instruments Model CHI620D electrochemical workstation under inert atmosphere in an argon-filled glove box. A standard three-electrode setup was used to obtain Fe(ii/iii) potentials using both differential pulse voltammetry and cyclic voltammetry in acetonitrile (CH3CN) with 0.1 M tetrabutylammonium hexafluorophosphate (TBAPF6) as the supporting electrolyte, a Pt working electrode and a Ag reference electrode. TBAPF6 was purchased from Oakwood Chemical Company and recrystallized from ethanol twice before use. All potentials are referenced internally to the ferrocene/ferrocenium (Fc/Fc+) couple. Additional details can be found in the ESI.†
Ultrafast transient absorption spectroscopy
Ultrafast transient absorption (TA) spectroscopy measurements were carried out as previously described,23 with the following modifications: the Ti:sapphire oscillator (Coherent Mira 900) is now pumped by a diode-pumped solid state laser (Coherent Verdi V6) operating at 5.0 W. The output from the regenerative amplifier (Positive Light Spitfire) is split 70 : 30 to the pump and probe lines, respectively. The pump wavelength is tunable in the visible region by use of an optical parametric amplifier (Light Conversion TOPAS), the output of which is double-passed by retroreflectors mounted on a 1.2 m delay stage (Aerotech) controlled by Soloist CP software. This set-up affords 13 ns of delay between the pump and probe pulses. The detection scheme utilizes ∼10 nm UV/Vis bandpass notch filters (Thorlabs) to select the probe wavelength from the white light continuum, which is then focused onto a Si amplified photodiode (Thorlabs). The data reported herein correspond to a probe wavelength of 530 nm; however, ground state recovery dynamics were found to be independent of probe wavelength across the visible region of the spectrum.
For the data presented herein, excitation energy at the sample was ∼5 μJ which yielded signals in the linear response regime. Samples were prepared in CH3CN at concentrations to afford absorbance values of ∼0.7 AU in a 1 cm sample cryogenic cuvette (FireFlySci) at the excitation wavelength of 490 nm. No changes in the absorption spectra acquired before and after the variable-temperature experiments were evident. Pulse characterization was performed within the cryostat via optical Kerr effect (OKE) measurements on neat acetonitrile;24 pump-probe cross-correlation indicated an instrument response function of less than 300 fs. The data presented represent an average of 10 scans; fits of individual scans were statistically indistinguishable from the averaged data. Data fitting was performed using the Igor Pro software, and all error bars reported are the result of propagation of error across multiple data sets.
Variable-temperature measurements
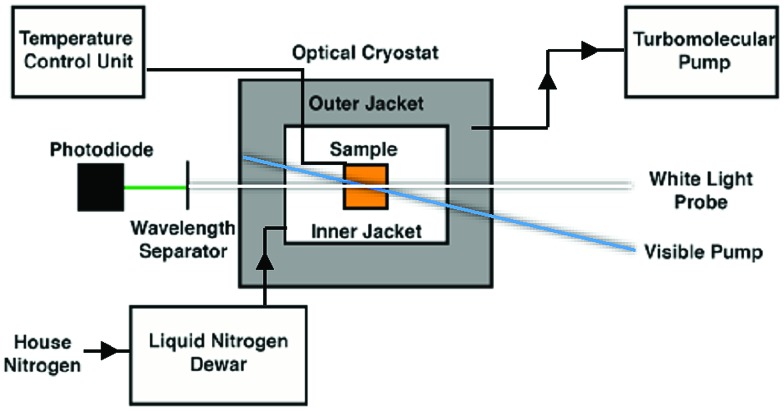
Variable-temperature data were acquired through the incorporation of an optical Dewar (Janis Research SuperTran-VT 100) into the sample region of the aforementioned setup. This apparatus allows access to a temperature range of 2–350 K; however, data acquisition relevant to this report was limited to 235–292 K, i.e., fluid solution samples. A liquid nitrogen storage Dewar (International Cryogenics, Inc.) is connected to the cryostat with a transfer line (Janis Research) that remains in place throughout data collection in order to ensure minimal cryogen loss over the course of the measurements. Importantly, this continuous-flow setup allows for the cryostat to remain stationary throughout data collection, thereby minimizing changes in the pump/probe overlap within the sample. The temperature of the sample within the cryostat is controlled and monitored via two sensors placed in the upper and lower chambers of the cryostat, connected to a Lake Shore Cryotronics temperature controller. The average of the readings from these two sensors is taken to be the sample temperature, affording an estimated accuracy of ± 1 K. A schematic of the variable-temperature ultrafast setup can be seen in Scheme 1. Data collection at each temperature takes approximately one hour, which ensures that sufficient time is allotted for thermal equilibration of the sample.
Scheme 1. Schematic overview of the variable-temperature apparatus used for time-resolved ultrafast transient absorption spectroscopy.
Results and discussion
Ground state properties
Electronic spectra
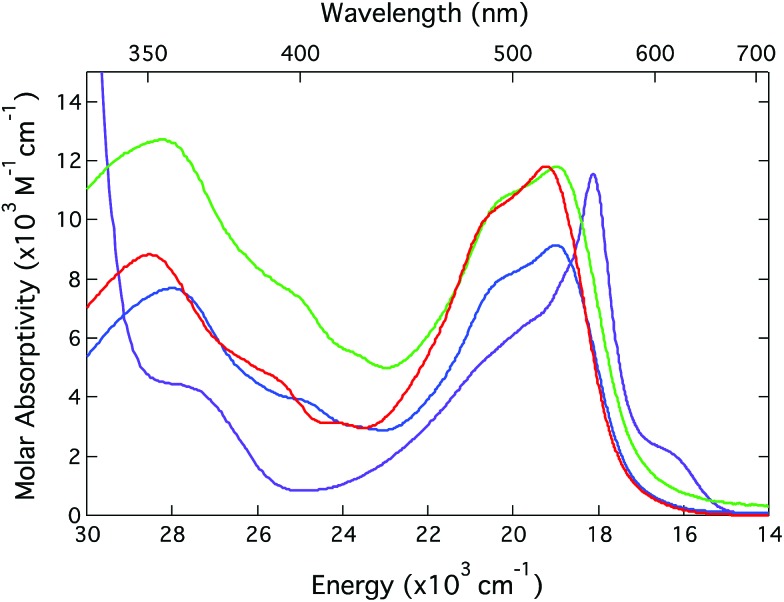
The electronic absorption spectra of all four complexes examined in this study are plotted in Fig. 1. The spectra are dominated in the mid-visible region by a strong absorption feature that is assigned to the 1A1 → 1MLCT transition(s) of the compounds. All three of the tris-bidentate complexes have nearly identical absorption profiles with the exception that the compounds having electron-donating groups at the 4,4′ positions of the bipyridine ligand are slightly red-shifted relative to the parent [Fe(bpy)3]2+ chromophore. This is easily understood given that the energy of an MLCT feature is roughly correlated to the sum of the absolute values of the energies of the first oxidation potential of the metal and first reduction potential of the ligand.4 In the present case, the negative shift in the Fe(ii/iii) couple slightly offsets the corresponding decrease in the ligand reduction potential, hence the red-shift in the absorption maximum (Table S1†).
Fig. 1. Ground state electronic absorption spectra of [Fe(bpy)3](PF6)2 (red), [Fe(dmb)3](PF6)2 (green),25 [Fe(dtbb)3](PF6)2 (blue), and [Fe(terpy)2](PF6)2 (purple). All spectra were acquired in CH3CN solution at room temperature.
The spectral profile of [Fe(terpy)2]2+ is quite different than the [Fe(bpy′)3]2+ family of compounds (although it possesses the same overall oscillator strength when one integrates the entire MLCT envelope). The sharp feature near 560 nm is characteristic of transition metal-terpyridine charge transfer complexes and is a reflection of a decrease in the relative nuclear displacements between the ground and excited state potential energy surfaces afforded by the conjugation of the ligand π-system across the three rings. The extent to which this may play a role in the ultrafast dynamics of these sorts of systems – in particular conversion from the MLCT state(s) to the lower-lying ligand field manifold – is an open question that is being pursued but is beyond the scope of the present study. Notwithstanding these differences, the gross similarities across the spectra of all four compounds allows for time-resolved optical studies to be carried out under essentially identical experimental conditions. This will simplify the process of making comparisons and should allow for any differences noted to be correlated to fundamental distinctions in the molecular origins of the observed dynamics.
Molecular structure
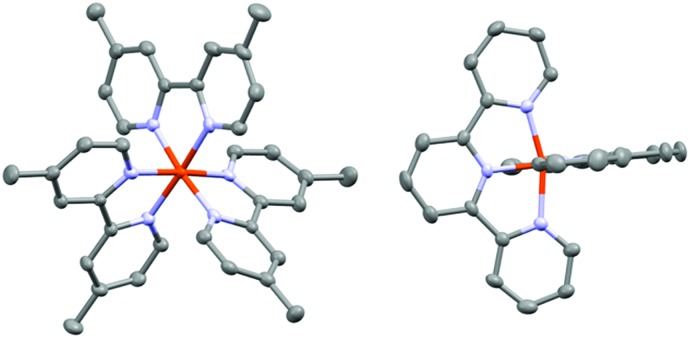
Since one of the goals of this work is an assessment of geometric factors that may couple to excited state dynamics, it is important to briefly examine the ground state geometries of the compounds in question. Single-crystal X-ray structures for [Fe(bpy)3]2+ and [Fe(dtbb)3]2+ have been previously reported:22,26 we therefore obtained structures for [Fe(dmb)3](PF6)2 and [Fe(terpy)2](PF6)2 (Fig. 2) in order to complete the series. Table 1 presents the bond distances and angles surrounding the central metal ion for all four compounds; complete details of the X-ray structure determinations for [Fe(dmb)3](PF6)2 and [Fe(terpy)2](PF6)2 can be found in the ESI.† Not surprisingly, the Fe–N bond distances across the series are typical for low-spin Fe(ii) complexes. In terms of the overall molecular geometry, [Fe(terpy)2](PF6)2 exhibits the largest deviation from pseudo-octahedral symmetry of all four complexes with regard to the metrics of the primary coordination sphere. Of particular note is the significant variance in the Fe–N bond distances, in which the axial bond distances are ∼1.88 Å whereas the equatorial Fe–N bonds are significantly longer at ∼1.98Å. This contrasts with the tris-bidentate complexes for which all of the Fe–N bond distances fall within a relatively narrow range of roughly ± 0.01 Å. These differences extend to the bond angles, with cis and trans N–Fe–N angles in [Fe(terpy)2]2+ spanning a range of nearly 20° (both of which are centered well below the 90° and 180° values characteristic of an Oh-symmetry complex). This is certainly not unexpected due to the tridentate nature of the ligand and the relatively small bite angle associated with a 5-membered metallochelate. Nevertheless, the greater degree of geometric distortion endemic to [Fe(terpy)2]2+ relative to the tris-bipyridyl complexes is important to note.
Fig. 2. Single-crystal X-ray structures of the cations of [Fe(dmb)3](PF6)2 (left) and [Fe(terpy)2](PF6)2 (right). Solvent molecules as well as the PF6– counterions have been omitted for clarity.
Table 1. Bond distances and angles for the [Fe(bpy′)3]2+ complexes and [Fe(terpy)2]2+.
| Complex | Fe–N distance (Å) | Cis N–Fe–N angle (°) | Trans N–Fe–N angle (°) | Ref. |
| [Fe(bpy)3](PF6)2 | 1.9670 ± 0.0004 | 81.86–94.31 | 174.61 | 17 |
| [Fe(dmb)3](PF6)2 | 1.967 ± 0.006 | 80.92–97.52 | 173.80–176.12 | This work |
| [Fe(dtbb)3](PF6)2 | 1.957 ± 0.001 | 81.06–95.84 | 172.62–175.5 | 18 |
| [Fe(terpy)2](PF6)2 | 1.881 ± 0.002 | 80.82–99.97 | 161.97–178.83 | This work |
| 1.976 ± 0.005 |
Variable-temperature ultrafast spectroscopy: experimental considerations
Although conceptually straightforward, the acquisition of variable-temperature time-resolved absorption data on sub-nanosecond time scales has associated with it a number of technical challenges. First, it is well established that ultrashort (sub-ns) laser pulses will broaden when propagating through refractive media.27 This phenomenon, known as chirp, arises due to the fact that the index of refraction of any material is wavelength-dependent; the larger spectral bandwidth endemic to ultrashort pulses causes group velocity dispersion wherein light of different wavelengths traverse the refractive media at different speeds. The net result is that a laser pulse of a given temporal width prior to passage through the refractive medium will be longer in duration on the other side. In this case, the introduction of an optical Dewar to an ultrafast setup adds more than 12 mm of additional fused Si glass to the beam path, which has the potential to greatly broaden the pulse duration. The extent to which the pulse will be broadened can be calculated if one knows the nature of the dispersive material, the amount of material through which the laser pulses must propagate, and the duration and bandwidth of the pulses in question. The pump and probe pulses used in this experiment were characterized by optical Kerr effect (OKE) measurements24 in a 1 mm path length cuvette without the cryostat and found to be on the order of 150 fs; in this regime, the amount of dispersion introduced by the windows of the cryostat and 1 cm path length cuvette is predicted to be negligible (Fig. S14†), a result that we confirmed by measuring the OKE response of the sample within the Dewar. For the systems examined for this report, we would not expect any meaningful effect of chirp on the kinetics given that the lifetimes of the complexes are four orders of magnitude larger than the predicted dispersion effect. To verify this, ground state recovery dynamics for all four complexes we will be discussing were acquired with the sample in the cryostat at room temperature as well as using our standard set-up for room temperature measurements. The data obtained in both configurations were identical. For dynamics occurring on faster time scales than we are considering here, the dispersion effect can be significant and will require additional considerations.
The effect of temperature on the index of refraction of the sample solution turns out to be a surprisingly significant issue to deal with from an experimental perspective. The temperature dependence of some common solvents – including acetonitrile – has been studied previously.28,29 Specifically, as the temperature decreases, the solvent's refractive index increases. This directly impacts the experiment in two important ways. First, the pump-probe overlap will change with temperature. The perturbation to the propagation of the pump through the sample will be more pronounced than that of the probe in our setup because the pump is oriented at an angle (5–10°) relative to the optical axis of the probe in an effort to minimize scatter reaching the detector. A good solution to this problem is to optimize overlap on the side of the cuvette away from the detector (i.e., where the beams first enter the sample): in this configuration, the probe beam traverses a relatively straight path to the detector, and any beam refraction in the pump due to solvent will occur after the beams have overlapped, thereby minimizing adverse effects on the data. Second, we found that the amount of pump scatter significantly increased with decreasing temperature. The physical origin of this is unclear. All of our measurements were carried out above the freezing point of the solvent, so the effect is not associated with the formation of nucleations within the solution. Pump scatter manifests as a negative signal superimposed on the solute's kinetics, which in turn artificially shortens the observed time constant. Since the magnitude of the effect varies with temperature, failure to account for this results in non-linear Arrhenius plots. The most straightforward way to address this issue would be the incorporation of a monochromator as part of a two-color setup in order to discriminate against pump scatter. The drawback to this approach is the significant loss in light throughput, which impacts sensitivity. Using our bandpass setup, we found that selecting probe wavelengths well-separated spectrally from the excitation wavelength (>50 nm) negated this problem.
Arrhenius parameters for [Fe(bpy′)3]2+ series
The kinetics for ground state recovery following 1A1 → 1MLCT excitation were measured as a function of temperature. At each temperature, the data were well-described by a single exponential model. The variable-temperature data were fit to a simple Arrhenius relationship,
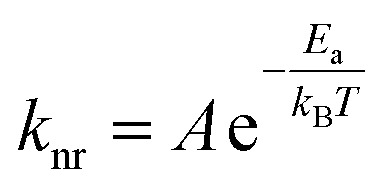 |
1 |
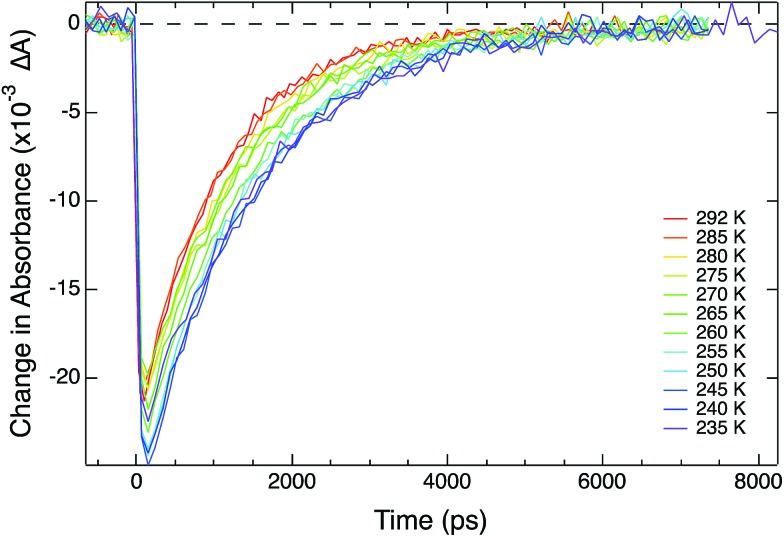
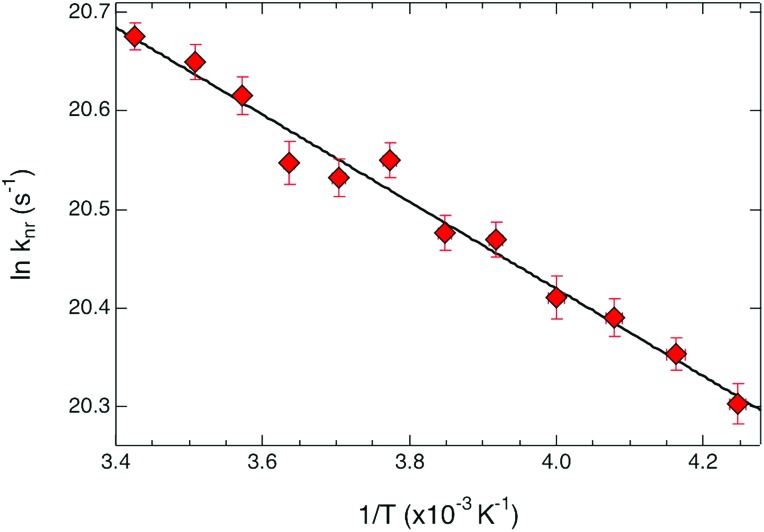
in which A is the pre-exponential factor, Ea is the activation energy, and kB is Boltzmann's constant. For all of the complexes reported herein, care was taken to ensure that the same anion (PF6–), solvent (CH3CN), and excitation and probe wavelengths (490 and 530 nm, respectively) were used for each complex, thereby minimizing any variations in outer-sphere contributions and allowing for a focused comparison of inner-sphere contributions to the observed dynamics. The data acquired on [Fe(bpy)3]2+ are shown in Fig. 3 and summarized in Table 2. The ground state recovery time constant of 1.05 ± 0.02 ns at 292 K increases to 1.52 ± 0.03 ns at 235 K, a ∼50% increase that indicates a small but nevertheless measurable barrier. This barrier was quantified through application of eqn (1) to yield an activation energy of 310 ± 15 cm–1 and a frequency factor of 230 ± 20 ps–1 (Fig. 4). The activation energy reported here is surprisingly similar to that reported by Hauser et al. considering the two measurements were acquired in different phases (i.e., ours in solution and those of Hauser in solid-state).17 We take this as a strong indication of the (largely) intramolecular nature of the barrier.
Fig. 3. Variable-temperature ground state recovery dynamics for [Fe(bpy)3]2+ in CH3CN solution at 530 nm following 1A1 → 1MLCT excitation at 490 nm. The time constant increases from 1.05 ± 0.02 ns at room temperature (red) to 1.52 ± 0.03 ns 235 K (purple).
Table 2. Electrochemical oxidation potentials, variable-temperature time-resolved absorption data, and corresponding Arrhenius parameters for [Fe(bpy′)3](PF6)2 and [Fe(terpy)2](PF6)2 in CH3CN solution.
| Complex | ΔEox (V) | Lifetime at 292 K (ns) | Lifetime a at 235 K (ns) | A (ps–1) | E a (cm–1) |
| [Fe(bpy)3](PF6)2 | 0.68 | 1.05 ± 0.02 | 1.52 ± 0.03 | 230 ± 20 | 310 ± 15 |
| [Fe(dmb)3](PF6)2 | 0.52 | 1.32 ± 0.02 | 2.01 ± 0.04 | 240 ± 20 | 345 ± 10 |
| [Fe(dtbb)3](PF6)2 | 0.53 | 1.07 ± 0.01 | 1.56 ± 0.02 | 230 ± 15 | 315 ± 15 |
| [Fe(terpy)2](PF6)2 | 0.72 | 5.2 ± 0.1 | 12.6 ± 1.7 | 150 ± 55 | 755 ± 70 |
aThe freezing point of CH3CN is 228 K.
Fig. 4. Arrhenius plot for ground state recovery dynamics of [Fe(bpy)3](PF6)2 in CH3CN solution. The solid line corresponds to a fit of the data to an Arrhenius model (eqn (1)), indicating an activation energy of 310 ± 15 cm–1 and an intercept (i.e., the rate constant in the limit of no barrier) of 230 ± 20 ps–1.
Analogous data were obtained for the two other 4,4′-di-substituted complexes in the [Fe(bpy′)3]2+ family and are summarized in Table 2. The relaxation kinetics for [Fe(dmb)3]2+ and [Fe(dtbb)3]2+ are generally similar to those obtained for [Fe(bpy)3]2+, however, some interesting features are apparent. Alkyl groups are expected to be electron-donating, a point reflected by the ca. 0.15 V decrease in the Fe(ii/iii) oxidation potential observed for both [Fe(dmb)3]2+ and [Fe(dtbb)3]2+ relative to [Fe(bpy)3]2+ (Table 2). Oxidation samples the t2g orbitals of the metal, but the multielectronic nature of term states makes it difficult to draw a correlation between shifts in redox potential and the ligand field strength that serves to define term state energies. That being said, we note that the data acquired on [Fe(dtbb)3]2+ are experimentally indistinguishable from those of [Fe(bpy)3]2+, both in terms of the measured Arrhenius barrier as well as the rate constant in the barrierless limit. This suggests that the energetics associated with the potential energy surfaces that define ground state recovery in these two complexes are basically identical. The other member of this series, [Fe(dmb)3]2+, presents a slightly different picture: whereas the intercept of the Arrhenius plot is identical to the other two tris-bidentate complexes, the measured barrier is slightly larger. Admittedly the difference is small given the error bars, but the differences in time constants for ground state recovery are well outside of experimental error. We take this as an indication that a subtle but observable difference exists in the energetics that serve to define the dynamics of [Fe(dmb)3]2+ relative to the other two compounds. Plots for the variable-temperature ground state recovery spectra and Arrhenius fittings for all of the compounds listed in Table 2 can be found in the ESI.†
Interpretation of variable-temperature data: the Marcus picture
The availability of the Arrhenius data just described allows us to examine in greater detail how best to describe this class of compounds in the context of a Marcus-type framework. To this end, one can derive simple relationships between the Arrhenius expression (eqn (1)) and a semi-classical formulation of Marcus theory (eqn (2)),
 |
2 |
where in the present context ΔG0 is the free energy difference between the high-spin and low-spin states (i.e., the driving force), λ is the reorganization energy associated with that conversion, and Hab is the coupling constant that defines the electronic communication between those two states. Comparing eqn (1) and (2) immediately affords us a connection between the two pre-exponential terms (eqn (3))
 |
3 |
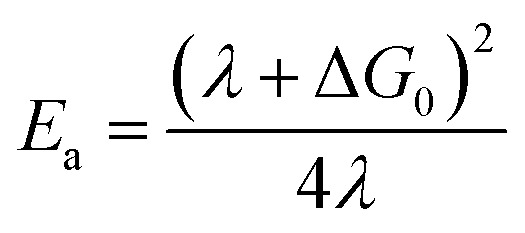
as well as the activation energy (eqn (4)),
 |
4 |
thereby allowing for the use of ultrafast variable-temperature data to obtain experimentally-grounded estimates of these various parameters.
We consider first the pre-exponential term. As stated above and shown in Table 2, the three tris-bidentate complexes exhibit the same frequency factor within experimental error. Using the value of A = 240 ± 20 ps–1 measured for [Fe(bpy)3]2+, rearrangement of eqn (3) yields Hab4/λ = 1/(30 ± 5). The values of Hab and λ obviously cannot be independently-determined from this expression, however, we can use informed estimates to obtain a range of values that these parameters must fall within to be consistent with experimental data. An initial calculation of Hab for high-spin to low-spin conversion in Fe(ii) spin-crossover systems was carried out by Jortner and co-workers based on a second-order perturbation theory treatment of spin–orbit coupling between the S = 0 and S = 2 states.18 Using Hab = 170 cm–1 obtained from that analysis, Hab4/λ = 1/(30 ± 5) affords a physically unrealistic value of ∼3 × 10⁶ eV (25 × 109 cm–1) for the reorganization energy. If we assume values for λ to be in the range of 0.25–2.5 eV (ca. 2000–20 000 cm–1) as proposed by various groups,15,30–32 the magnitude of the electronic coupling can only span from ca. 3–5 cm–1 and still be consistent with our experimental data. Indeed, an unrealistically low value of λ = 800 cm–1 yields Hab = 2.3 cm–1, whereas an unrealistically high value of λ = 20 000 cm–1 corresponds to Hab = 5.1 cm–1. This narrow range of possible values for Hab emerging from this analysis is due to the quartic relationship between Hab and λ stemming from eqn (3) and allows for a surprisingly high degree of confidence in the magnitude of Hab that can be obtained from these variable-temperature measurements.
Unfortunately, the same level of precision is not possible when extracting information about the driving force and reorganization energy associated with ground state recovery dynamics. The problem arises due to the fact that the experimentally-determined activation energy reflects a convolution of ΔG0 and λ, whereas the pre-exponential term convolves λ and Hab. Absent an independent determination of one of these three variables, this is an analytically unsolvable problem and therefore can only be addressed numerically, which in turn requires that certain assumptions be introduced.
The most direct means for assessing ground state/excited state energetic differences is emission spectroscopy. Unfortunately, the fact that the 1A1 and 5T2 terms are characterized by ΔS = 2 means that radiative coupling between these two states is effectively zero. For excited states that are charge transfer in nature, electrochemical methods can often be used to gauge excited state energetics even in cases where the state is non-emissive because the energy of the state is correlated to the redox properties of the components;4 however, since ligand field states derive from excited configurations within the d-orbital of the metal (and therefore do not have a redox-based equivalent descriptor), electrochemistry cannot provide the same insight into energetics for this class of excited states.
One approach for assessing relative ligand field-state energetics across a series is to use electrochemical information in conjunction with an assumed value for a reference compound. Given all of the previous work that has been carried out on [Fe(bpy)3]2+, we could in principle write the following expression,
 |
5 |
where we assume a driving force for ground state recovery in [Fe(bpy)3]2+ (ΔG0,[Fe(bpy)3]2+) and use the Fe(ii/iii) oxidation couple for [Fe(bpy)3]2+ as a reference. The difference between 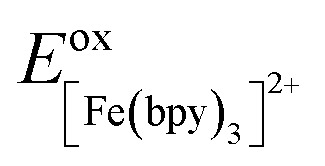 and Eoxcomplex is then taken from the assumed ΔG0 value to yield an approximate free energy difference for the complex of interest. This is implicitly how we inferred that the driving force of the lowest-energy excited state of [Fe(dcpp)2]2+ (dcpp = 2,6-di(2-carboxypyridyl)pyridine) is higher than that of [Fe(bpy)3]2+ in a previous report from our group.33 Although this approach can provide some level of comparative information, the use of eqn (5) is likely not a good indicator of the actual value of ΔG0. The oxidation potential for the Fe(ii/iii) couple is a direct measure of the energy required to remove an electron from the t2g set of orbitals on the metal center but does not give any indication of the energy of the
  orbitals relative to t2g: Eoxcomplex therefore contains only half of the information required to estimate the free energy difference between the 1A1 and 5T2 electronic states. Furthermore, electrochemical potentials are one-electron processes, in stark contrast to the multielectronic nature of the term states whose energies are of interest here. Attempting to draw a one-to-one correlation between these two situations ignores the influence of electron correlation effects that are exceedingly important in determining the energies of ligand field states, particularly in first-row metal complexes. Lastly, it should be borne in mind that the free energy change associated with high-spin to low-spin conversion in Fe(ii) complexes has a much more significant entropic contribution than what one typically encounters in most excited state processes. The effect is far more pronounced for spin-crossover compounds, in which the thermal accessibility of the two spin states implies that the magnitudes of ΔH0 and TΔS0 must be similar (and therefore more sensitive to the consequences of neglecting entropic factors).34 For compounds such as [Fe(bpy)3]2+, the energy difference between the 1A1 and 5T2 states is much greater than kBT; while this means that the driving force for high-spin to low-spin conversion will be dominated by the enthalpy change, it is important to be aware of the fact that equating ΔG0 with ΔH0 will always underestimate ΔG0 for these systems.35,36
Bearing this in mind, a value of ΔG0 = –7300 cm–1 originally cited by Sutin15 for [Fe(bpy)3]2+ falls well within the range that has been suggested over the years. We can therefore use this free energy difference as a reference point for obtaining estimates for the other Marcus parameters across our series of compounds. In order to factor in some degree of uncertainty in this value, we have included an error bar of ± 10% on the value of ΔG0 and propagated this through the analysis described below. The choice of the magnitude of uncertainty is somewhat arbitrary but does correspond to approximately one standard deviation across the range of values most commonly cited in the literature. At the same time, it is not so large as to obscure any differences between complexes in the Marcus analysis that the experimental data clearly establish. Further details concerning this issue can be found in the ESI.†
The first set of Marcus parameters we will discuss are those for [Fe(bpy)3]2+. The measured activation energy for this compound is 310 ± 15 cm–1: assuming ΔG0 = –7300 ± 730 cm–1, the two possible values for λ stemming from the quadratic nature of eqn (4) are 4800 ± 500 cm–1 and 11 000 ± 1000 cm–1. We note that the former value is essentially identical to the estimate provided by Sutin,15 however, since the two values obtained from eqn (4) place the dynamics of ground state recovery on either side of the apex of the Marcus curve, it is important to consider which value is more physically realistic in order to properly conceptualize the photophysical processes occurring in this system.
The high-spin to low-spin conversion in a d6 metal ion represents one of the largest intramolecular structural changes one can come across in the transition block: the change from a 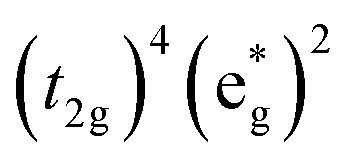 to
to 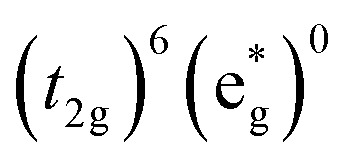 configuration results in a ∼15 cm3 mol–1 volume contraction of the compound37 due primarily (though not exclusively) to a ca. 10% reduction in metal–ligand bond length that accompanies depopulation of the σ* orbitals. Unfortunately, the only quantitative information available in the literature pertaining to reorganization energy in Fe-based complexes comes from self-exchange measurements. Since self-exchange is an electron transfer process, the measured reorganization energy would be expected to include outer-sphere contributions that will be significantly attenuated in the ground state recovery dynamics of [Fe(bpy)3]2+. Moreover, self-exchange in cases such as [Fe(H2O)6]2+/3+ or [Fe(CN)6]4–/3– do not involve a high-spin/low-spin conversion, which is obviously a critical factor in the present setting.
Information about reorganization energies associated with the excited states of [Ru(bpy)3]2+ are known,38 but we believe that a better comparison is afforded from self-exchange measurements of Co(iii) complexes where reduction of a low-spin d6 complex typically yields a high-spin species as the product. Hamann et al. have in fact recently published a study of the self-exchange parameters of various Co(iii) complexes in the context of their work on Co-based redox shuttles for use in dye-sensitized solar cells.39 These researchers report a reorganization energy associated with self-exchange of [Co(bpy)3]2+ of 3.21 eV. A detailed accounting of outer-sphere contributions enabled them to specify a value for the inner-sphere component of 2.63 eV, or ∼1.3 eV (∼10 500 cm–1) per Co ion. Although the force constants associated with ligand binding to Co(iii) are expected to be somewhat larger than for Fe(ii), the structural rearrangement in the Co(iii/ii) self-exchange is more analogous to that of the high-spin to low-spin conversion in Fe(ii) polypyridyls, making the 10 500 cm–1 value a more reasonable touchstone for [Fe(bpy)3]2+. We therefore assert that, within the limits imposed by our estimate of ΔG0, 11 000 ± 1000 cm–1 represents a reasonable value for the reorganization energy associated with ground state recovery in [Fe(bpy)3]2+ and places the dynamics of this system firmly within the Marcus normal region.
We can now use the results just described for [Fe(bpy)3]2+ as a reference point for interpreting the data we have obtained for the other two members of the [Fe(bpy′)3]2+ series. In order to do this, we must reconcile two somewhat conflicting pieces of information, namely the (essentially) identical oxidation potentials of the metal measured for [Fe(dmb)3]2+ and [Fe(dtbb)3]2+ and the differing activation parameters obtained for the two complexes from our variable-temperature measurements (Table 2). If we employ eqn (5), that is assume that the change in ΔG0 tracks the energy of the t2g orbitals as measured by the Fe(ii/iii) oxidation potential, one must also assume a reduction in the magnitude of the reorganization energy for [Fe(dtbb)3]2+ relative to [Fe(bpy)3]2+. Indeed, using eqn (5) and the measured activation energy for [Fe(dtbb)3]2+, a value of λ ≈ 9500 cm–1 is obtained. The electrochemical data clearly indicate that the metal center in [Fe(dtbb)3]2+ is more electron-rich than in [Fe(bpy)3]2+; although we would not expect 4,4′-tert-butyl substituents to play a role in the reorganization of the primary coordination environment about the Fe(ii) center, they could impact outer-sphere contributions.13,40 Alternatively, if we instead assume that the reorganization energy for [Fe(dtbb)3]2+ is the same as what we determined for [Fe(bpy)3]2+, the experimental activation energy affords a value of ΔG0 = –7300 cm–1, i.e., identical to that of [Fe(bpy)3]2+. The available data do not allow us to differentiate between these two possibilities, but the fact that the variable-temperature kinetic data for [Fe(bpy)3]2+ and [Fe(dtbb)3]2+ are identical in all respects compels us to favor the latter analysis. We would therefore suggest that in the case of [Fe(dtbb)3]2+, the destabilization of the t2g orbitals indicated by the negative shift in the Fe(ii/iii) potential is offset by a corresponding destabilization of the  orbitals, leading to nearly identical ligand field splittings (and correspondingly similar variable-temperature ground state recovery dynamics) for the two compounds.
While [Fe(dmb)3]2+ and [Fe(dtbb)3]2+ exhibit very similar oxidation potentials, the Arrhenius parameters of these two complexes are more disparate. The data for [Fe(dmb)3]2+ display an increase in the measured activation energy, which implies a decrease in ΔG0 and/or an increase in λ for ground state recovery relative to [Fe(bpy)3]2+. As with the introduction of the tert-butyl group in [Fe(dtbb)3]2+, it is difficult to envision how incorporation of a methyl group on the periphery of the ligand will have a significant impact on the inner-sphere reorganization energy associated with dynamics within the ligand field manifold. That being said, regardless of whether one assumes a value of ΔG0 = –6000 ± 600 or λ = 11 000 cm–1, the experimental data for [Fe(dmb)3]2+ necessitate a reduction in the effective ligand field strength of dmb relative to bpy when bound to Fe(ii) (Table 3). Methyl groups are well-documented σ-donors and therefore should destabilize the  orbitals (although, as in case of [Fe(dtbb)3]2+, we have no direct experimental probe of these energetics). The measured oxidation potential for [Fe(dmb)3]2+ clearly reveals a destabilization of the t2g orbitals; the more negative reduction potential for dmb versus bpy indicates that the former is more electron-rich which will make it both a better π base and a weaker π acid.41 Previous soft X-ray data on an analogous Fe(ii) complex has demonstrated that the electron-donating ability of the bipyridine ligand is also intrinsically tied to the nature of the electronic state.42 Specifically, it was observed that in the 5T2 excited state, both σ-donation from and π-backbonding to the ligand are significantly attenuated relative to the 1A1 ground state. We cannot easily disentangle these various contributions a priori, but the variable-temperature time-resolved absorption data support an interpretation in which dmb presents a slightly diminished ligand field overall as compared to bipyridine.43 We point out that our conclusion, which follows directly from the experimental data provided in Table 2, is consistent with recent theoretical work by Jakubikova and co-workers suggesting a more significant role for ligand π-donation in polypyridyl complexes of Fe(ii).44
Table 3. Marcus parameters of the four complexes.
| Complex | H ab 4/λ | H ab (cm–1) | ΔG0 a (cm–1) | λ (cm–1) | ΔG0 b (cm–1) |
| [Fe(bpy)3](PF6)2 | 1/(30 ± 5) | 4.4 ± 0.2 | –7300 ± 730 | 11 000 ± 1000 | –7300 ± 730 |
| [Fe(dmb)3](PF6)2 | 1/(33 ± 4) | 4.2 ± 0.1 | –6000 ± 600 | 9700 ± 900 | –7100 ± 710 |
| [Fe(dtbb)3](PF6)2 | 1/(29 ± 4) | 4.3 ± 0.2 | –6100 ± 610 | 9500 ± 900 | –7300 ± 490 |
| [Fe(terpy)2](PF6)2 | 1/(14 ± 9) | 6.2 ± 1.2 | –7600 ± 760 | 14 100 ± 1200 | –5200 ± 480 |
aCalculated from the Fe(ii/iii) oxidation potentials (ΔEox) and eqn (5).
bCalculated assuming a value for λ of 11 000 ± 1000 cm–1 for all four complexes.
Lastly, we note that despite the subtle differences in activation energies and driving forces across these three complexes, the pre-exponential term and therefore the Hab4/λ ratios are relatively constant (Table 2). The extent to which this may be providing insight into the nature of the nuclear coordinate that defines the trajectory for excited state dynamics in this class of compounds is highlighted by the results obtained on [Fe(terpy)2]2+ described below.
Excited state dynamics of [Fe(terpy)2]2+
Variable-temperature ultrafast absorption data were acquired on [Fe(terpy)2]2+ in CH3CN solution in a manner exactly analogous to what was just described for the [Fe(bpy′)3]2+ series. To remain consistent in our study between the complexes, the same pump (490 nm) and probe (530 nm) wavelengths were used despite the red-shifted MLCT maximum for [Fe(terpy)2]2+ relative to the bpy′ series (Fig. S1†). For comparison, ground state recovery lifetimes as a function of temperature were collected with redder wavelengths and all results were consistent with those at the pump-probe energies used here, as is expected for ground state recovery. The ∼5-fold longer room-temperature lifetime for [Fe(terpy)2]2+ relative to [Fe(bpy)3]2+ coupled with the more distorted geometry of the bis-tridentate complex has in the past led to speculation that the terpy ligand imparts a weaker ligand field to a given metal than bpy does. The lifetime of [Fe(terpy)2]2+ at 235 K is 12.6 ± 1.7 ns, which corresponds to a ∼2.5-fold lengthening from the 5.2 ± 0.1 ns lifetime recorded at room temperature (Table 2).45 A plot of the complete variable-temperature data set (Fig. S11†) affords an Arrhenius activation energy of Ea = 755 ± 70 cm–1, more than twice that measured for [Fe(bpy)3]2+. In addition, the pre-exponential value of 150 ± 55 ps–1 indicates a ∼2-fold increase in Hab4/λ for [Fe(terpy)2]2+ to 1/(14 ± 9).
As with the analysis of the data for the bpy′ series, we cannot analytically solve for the three Marcus parameters for [Fe(terpy)2]2+ but we can evaluate the data numerically in order to identify a range of values that are physically reasonable. Focusing first on the pre-exponential term, if we assume that the electronic coupling between the 5T2 and 1A1 states is the same as what was determined for the [Fe(bpy′)3]2+ series, a value of ∼5000 cm–1 is found for the reorganization energy. [Fe(terpy)2]2+ exhibits relaxation along a multimode coordinate, one of which is a change in metal–ligand bond length similar to that observed for [Fe(bpy)3]2+ as evidenced by time-resolved X-ray spectroscopy.46 Moreover, recent calculations from Nance et al. identify a rocking motion of the terpy ligand to be an important vibrational mode associated with conversion from the high-spin to low-spin state.47 Based on these considerations, it seems likely that the reorganization energy for ground state recovery in [Fe(terpy)2]2+ should be at least as large if not larger than what we determined for [Fe(bpy)3]2+, which in turn implies that the magnitude of Hab must be larger for [Fe(terpy)2]2+ than what was found for the [Fe(bpy′)3]2+ series.
To understand what an increase in Hab tells us about the energetics of [Fe(terpy)2]2+, we need to consider the origin of Hab for the high-spin to low-spin conversion in Fe(ii). The 5T2 → 1A1 transition is one that involves a net spin change of two units (i.e., S = 2 to S = 0). There is no matrix element that directly couples two states for which ΔS = 2, so the avoided crossing on the lowest-energy potential surface for Fe(ii) polypyridyl complexes arises due to a higher-order interaction.48 Specifically, mixing can occur between the 5T2 and lowest-energy S = 1 excited state (i.e., 3T1) as well as between the 1A1 and 3T1 states via second-order spin–orbit coupling. The 3T1 state therefore serves as a common link between the high-spin and low-spin configurations to yield a small but non-zero degree of electronic coupling between the S = 0 and S = 2 manifolds. Whether a second-order perturbation treatment is valid for these sorts of systems is open to debate,48 however, the extent of mixing between the 5T2 and 3T1 states will still be inversely proportional to their energy separation. An increase in Hab in this circumstance is therefore indicative of a decrease in the 3T1–5T2 energy gap which, for compounds such as [Fe(terpy)2]2+ where the 5T2 state is the lowest-energy excited state of the system, can only arise from an increase in ligand field strength.49
Using the experimental activation parameters in Table 2, the data acquired on [Fe(terpy)2]2+ are consistent with a slightly larger free energy difference of ΔG0 = –7600 ± 760 cm–1, an electronic coupling of Hab = 6.2 ± 1.2 cm–1, and a reorganization energy of 14 100 ± 1200 cm–1 (Table 3). The dynamics of ground state recovery for [Fe(terpy)2]2+ are therefore still in the Marcus normal region, with the slight increase in ligand field strength being offset by a larger increase in the magnitude of the reorganization energy. An increased reorganization energy associated with ground state recovery in [Fe(terpy)2]2+ compared to [Fe(bpy)3]2+ is consistent with a more complex nuclear coordinate that possibly incorporates a Fe–N bending mode.45,46 Given the fact that the ground-state geometry surrounding the central metal ion in [Fe(terpy)2]2+ is more strongly distorted from pseudo-octahedral symmetry than what is found for [Fe(bpy)3]2+ (and therefore presumably leading to less favorable orbital overlap from the ligating nitrogen atoms), we suggest that the modest increase in ligand-field strength for terpy relative to bpy is due to an attenuation of π-donation effects from the former.
Conclusions
We have used variable-temperature ultrafast transient absorption spectroscopy to study the ground state recovery dynamics for three [Fe(bpy′)3]2+-type complexes and [Fe(terpy)2]2+ in an effort to better understand the electronic and structural factors involved in spin-state interconversion in Fe(ii) systems. Correlating the measured activation parameters to semi-classical Marcus theory has enabled a determination of the electronic coupling that exists between the 1A1 and 5T2 states in this class of compounds to a surprising degree of precision. Moreover, while the ligand field strength of this class of compounds is notoriously difficult to quantify, our results illustrate that a detailed analysis of variable-temperature time-resolved absorption data can provide insights into low-spin/high-spin energetics that are difficult to obtain by other means.
Perhaps the most significant take away from the variable-temperature data stems from the constancy in the ratio of the electronic coupling to the reorganization energy for the [Fe(bpy′)3]2+ family of complexes and the fact that this ratio changes significantly for [Fe(terpy)2]2+. Specifically, the increase in reorganization energy that we infer for [Fe(terpy)2]2+ lends support to the experimental46 and theoretical47 findings implicating a distinct and possibly more complex nuclear coordinate for the 5T2 → 1A1 conversion in this compound as compared to [Fe(bpy)3]2+-based complexes. With only the single data point of [Fe(terpy)2]2+ in hand it is difficult to generalize these results with regard to nuclear coordinate trajectories for bis-tridentate versus tris-bidentate binding motifs. It makes sufficient intuitive sense that changes in the nature of the primary coordination sphere could have a particularly significant impact on the mechanism of excited state dynamics involving ligand field states to warrant further study of these types of systems. In this regard, the fact that we are able to identify differences in the nature of the reaction coordinate from variable-temperature optical pump-probe spectroscopy hints at the potential for such measurements to provide insight into the dynamics of a much wider range of chemical systems.
Finally, an important caveat to the conclusions drawn from this work lies in the estimation of ΔG0, the driving force for ground state recovery. We strove to be as forthright as possible with regard to the potential errors that stem from the inability to directly measure the free energy difference for this doubly-spin forbidden, non-emissive process, but we acknowledge the shortcomings inherent in having to approximate ΔG0 in this way. Efforts to overcome these difficulties to allow for an unambiguous determination of all of the parameters necessary for characterizing the excited state dynamics are already well underway and will form the basis of a future report.
Conflicts of interest
There are no conflicts to declare.
Supplementary Material
Acknowledgments
The authors would like to acknowledge Drs Lindsey L. Jamula, Amanda L. Smeigh, and Christopher R. Tichnell for synthesizing the [Fe(bpy)3](PF6)2, [Fe(terpy)2](PF6)2, and [Fe(dtbb)3](PF6)2 complexes, respectively. This work was generously supported by the Chemical Sciences, Geosciences, and Biosciences Division, Office of Basic Energy Sciences, Office of Science, U.S. Department of Energy (grant no. DE-FG02-01ER15282) and a fellowship to MCC from the U.S. Department of Education Graduate Assistance in Areas of National Need (GAANN) program (grant no. P200A140215).
Footnotes
†Electronic supplementary information (ESI) available. CCDC 1810752 and 1810753. For ESI and crystallographic data in CIF or other electronic format see DOI: 10.1039/c8sc04025g
References
- Hagfeldt A., Boschloo G., Sun L., Kloo L., Pettersson H. Chem. Rev. 2010;110:6595–6663. doi: 10.1021/cr900356p. [DOI] [PubMed] [Google Scholar]
- Arias-Rotondo D. M., McCusker J. K. Chem. Soc. Rev. 2016;45:5803–5820. doi: 10.1039/c6cs00526h. [DOI] [PubMed] [Google Scholar]
- Nicewicz D. A., MacMillan D. W. C. Science. 2008;322:77–80. doi: 10.1126/science.1161976. [DOI] [PMC free article] [PubMed] [Google Scholar]
- Brown A. M., McCusker C. E., McCusker J. K. Dalton Trans. 2014;43:17635–17646. doi: 10.1039/c4dt02849j. [DOI] [PubMed] [Google Scholar]
- Gawelda W., Cannizzo A., Pham V.-T., van Mourik F., Bressler Ch., Chergui M. J. Am. Chem. Soc. 2007;129:8199–8206. doi: 10.1021/ja070454x. [DOI] [PubMed] [Google Scholar]
- Monat J. E., McCusker J. K. J. Am. Chem. Soc. 2000;122:4092–4097. [Google Scholar]
- Bergkamp M. A., Chang C.-K., Netzel T. L. J. Phys. Chem. 1983;87:4441–4446. [Google Scholar]
- Sutin N., Creutz C. Pure Appl. Chem. 1980;52:2717–2738. [Google Scholar]
- Zhang W., Alonso-Mori R., Bergmann U., Bressler C., Chollet M., Galler A., Gawelda W., Hadt R. G., Hartsock R. W., Kroll T., Kjær K. S., Kubiček K., Lemke H. T., Liang H. W., Meyer D. A., Nielson M. M., Purser C., Robinson J. S., Soloman E. I., Sun Z., Sokaras D., van Driel T. B., Vankó G., Weng T. C., Zhu D., Gaffney K. J. Nature. 2014;509:345–349. doi: 10.1038/nature13252. [DOI] [PMC free article] [PubMed] [Google Scholar]
- Auböck G., Chergui M. Nat. Chem. 2015;7:629–633. doi: 10.1038/nchem.2305. [DOI] [PubMed] [Google Scholar]
- Lemke H. T., Kjær K. S., Hartsock R., van Driel T. B., Chollet M., Glownia J. M., Song S., Zhu D., Pace E., Matar S. F., Nielson M. M., Benfatto M., Gaffney K. J., Collet E., Cammarata M. Nat. Commun. 2017;8:15342. doi: 10.1038/ncomms15342. [DOI] [PMC free article] [PubMed] [Google Scholar]
- Kirk A. D., Hoggard P. E., Porter G. B., Rockley M. G., Windsor M. W. Chem. Phys. Lett. 1976;37:199–203. [Google Scholar]
- Miller J. N. and McCusker J. K., manuscript in preparation.
- Chábera P., Kjær K. S., Prakash O., Honarfar A., Liu Y., Fredin L. A., Harlang T. C. B., Lidin S., Uhlig J., Sundström V., Lomoth R., Persson P., Wärnmark K. J. Phys. Chem. Lett. 2018;9:459–463. doi: 10.1021/acs.jpclett.7b02962. [DOI] [PubMed] [Google Scholar]
- Sutin N. Acc. Chem. Res. 1982;15:275–282. [Google Scholar]
- Hauser A. Top. Curr. Chem. 2004;234:155–198. [Google Scholar]
- Hauser A., Vef A., Adler P. J. Chem. Phys. 1991;95:8710–8717. [Google Scholar]
- Buhks E., Navon G., Bixon M., Jortner J., Hauser A. J. Am. Chem. Soc. Chem. Phys. Lett. 1980;1990;102173:2918–2923. 507–512. [Google Scholar]
- Conti A. J., Xie C. L., Hendrickson D. N. J. Am. Chem. Soc. 1989;111:1171–1180. [Google Scholar]
- Fink D. W., Ohnesorge W. E. J. Am. Chem. Soc. 1969;91:4995–4998. [Google Scholar]
- Creutz A., Chou M., Netzel T. L., Okumura M., Sutin N. J. Am. Chem. Soc. 1980;102:1309–1319. [Google Scholar]
- England J., Scarborough C. C., Weyhermüller T., Sproules S., Wieghardt K. Eur. J. Inorg. Chem. 2012;2012:4605–4621. [Google Scholar]
- Juban E. A., McCusker J. K. J. Am. Chem. Soc. 2005;127:6857–6865. doi: 10.1021/ja042153i. [DOI] [PubMed] [Google Scholar]
- Albrecht H.-S., Heist P., Kleinschmidt J., Lap D. V., Schröder T. Appl. Opt. 1993;32:6659–6663. doi: 10.1364/AO.32.006659. [DOI] [PubMed] [Google Scholar]
- The hygroscopic nature of [Fe(dmb)3](PF6)2 in air made these measurements unreliable for the precise extinction coefficient. Therefore, we scaled our value for molar absorptivity to that of [Fe(bpy)3]2+ as cited by ref. 21
- Dick S. Z. Kristallogr. - New Cryst. Struct. 1998;213:356. [Google Scholar]
- Newport application note 29, http://assets.newport.com/webDocuments-EN/images/12243.PDF, (accessed November 2017).
- El-Kashef H., Aminabhavi T. M., Patil V. B. Rev. Sci. Instrum. J. Chem. Eng. Data. 1994;1998;6543:2056–2061. 497–503. [Google Scholar]
- Aralaguppi M. I., Jadar C. V., Aminabhavi T. M., Shukla R. K., Kumar A., Awasthi N., Srivastava U., Gangwar V. S., Wang J., Song H., Yang X., Zou W., Chen Y., Duan S., Sun J. J. Chem. Eng. Data. Exp. Therm. Fluid Sci. Korean J. Chem. Eng. 1996;2012;2016;413733:1307–1310. 1–11, 2460–2468. [Google Scholar]
- Sutin N., Brunschwig B. S. ACS Symp. Ser. 1982;198:105–135. [Google Scholar]
- Rosso K. M., Smith D. M. A., Dupuis M. J. Phys. Chem. A. 2004;108:5242–5248. [Google Scholar]
- Delahay P. Chem. Phys. Lett. 1982;87:607–611. [Google Scholar]
- Jamula L. L., Brown A. M., Guo D., McCusker J. K. Inorg. Chem. 2014;53:15–17. doi: 10.1021/ic402407k. [DOI] [PubMed] [Google Scholar]
- Sorai M., Seki S. J. Phys. Chem. Solids. 1974;35:555–570. [Google Scholar]
- For the purposes of the discussion to follow, all values of ΔG0 have been calculated assuming a temperature of T = 292 K
- An additional mitigating factor is that, although the absolute values for ΔG0 will be affected by entopic contributions, it is likely that these contributions will be similar across a series of structurally related compounds such as those being considered here
- Goodman J. L., Herman M. S. Chem. Phys. Lett. 1989;163:417–420. [Google Scholar]
- Thompson D. W., Fleming C. N., Myron B. D., Meyer T. J. J. Phys. Chem. B. 2007;111:6930–6941. doi: 10.1021/jp068682l. [DOI] [PubMed] [Google Scholar]
- Xie Y., Baillargeon J., Hamann T. W. J. Phys. Chem. C. 2015;119:28155–28166. [Google Scholar]
- One could envision a potential impact on outer-sphere contributions due to changes in solvation
- Juris A., Balzani V., Barigelletti F., Campagna S., Belser P., von Zelewsky A. Coord. Chem. Rev. 1988;84:85–277. [Google Scholar]
- Huse N., Kim T. K., Jamula L., McCusker J. K., de Groot F. M. F., Schoenlein R. W. J. Am. Chem. Soc. 2010;132:6809–6816. doi: 10.1021/ja101381a. [DOI] [PubMed] [Google Scholar]
- The π-donating ability of the methyl groups stems from the orientation of one C–H sp3 orbital lying perpendicular to the plane of the bipyridyl ring, allowing for orbital donation from the methyl group into the ligand's π-system. A common occurrence in organic systems,50 this phenomenon is surprisingly also visible in the X-ray crystal structure of [Fe(dmb)3]2+, but is not present in [Fe(dtbb)3]2+, likely owing to the steric strain imposed by the tert-butyl groups
- Ashley B. C., Jakubikova E. Inorg. Chem. 2018;57:9907–9917. doi: 10.1021/acs.inorgchem.8b01002. [DOI] [PubMed] [Google Scholar]
- It should be noted that the lifetime of [Fe(terpy)2]2+ under these conditions is such that the ground state does not fully recover within the dynamic range afforded by our optical delay line. Accordingly, the error bars associated with the time constants for [Fe(terpy)2]2+ are larger than for the other complexes studied herein
- Vankó G., Bordage A., Pápai M., Haldrup K., Glatzel P., March A. M., Doumy G., Britz A., Galler A., Assefa T., Cabaret D., Juhin A., van Driel T. B., Kjær K. S., Dohn A., Møller K. B., Lemke H. T., Gallo E., Rovezzi M., Németh Z., Rozsályi E., Rozgonyi T., Uhlig J., Sundström V., Nielsen M. M., Young L., Southworth S. H., Bressler Ch., Gawelda W. J. Phys. Chem. C. 2015;119:5888–5902. doi: 10.1021/acs.jpcc.5b00557. [DOI] [PMC free article] [PubMed] [Google Scholar]
- Nance J., Bowman D. N., Mukherjee S., Kelley C. T., Jakubikova E. Inorg. Chem. 2015;54:11259–11268. doi: 10.1021/acs.inorgchem.5b01747. [DOI] [PubMed] [Google Scholar]
- Sousa C., Domingo A., de Graaf C. Chem.–Eur. J. 2018;24:5146–5152. doi: 10.1002/chem.201704854. [DOI] [PubMed] [Google Scholar]
- The one caveat to this analysis is the possibility that enhanced 3T1/5T2 mixing could arise from a reduction in symmetry, i.e., low-symmetry splitting of the T-terms leading to an effective decrease in the energy gap for mixing between the S = 1 and S = 2 manifolds without requiring a net increase in ligand field strength
- Brown R. F., Organic Chemistry, Wadsworth Publishing Company, Belmont, CA, 1975. [Google Scholar]
Associated Data
This section collects any data citations, data availability statements, or supplementary materials included in this article.


