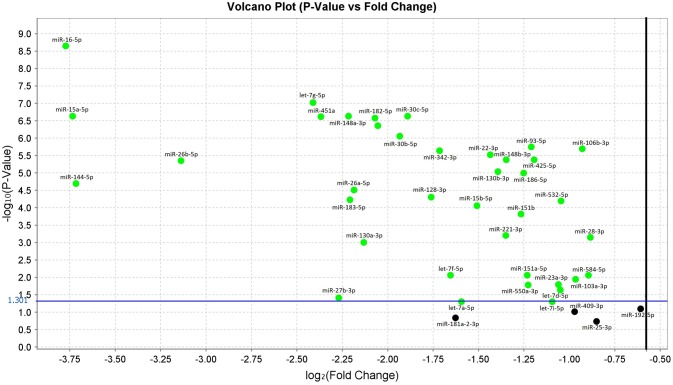
In the original article, there was a mistake in Figure 1 as published. We used the Volcano Plot, which was automatically generated using the Expression Suite v1.0.3 software (Thermo Fisher Scientific). This software visualizes the p-values and fold change values after each qRT-PCR run. A log2 (Fold Change) greater than or equal to one, is the standard boundary field.
Therefore, targets with a fold less than the lower boundary were automatically colored in green. However, as stated in the article, according to published guidelines, we validated the miRNAs with p-values < 0.05 (dot over the blue line) independently from their fold change. We have therefore adjusted the representation in the figure to avoid confusion.
The corrected Figure 1 appears below. The authors apologize for this error and state that this does not change the scientific conclusions of the article in any way. The original article has been updated.
Figure 1.
Volcano plot of validated miRNAs. Green dots represent the 38 differentially expressed miRNAs obtained from the comparison between sALS and HC subjects by qRT-PCR (p < 0.05). All black dots below the blue line did not discriminate sALS from HC. The Y-axis represents the log10 of the p-value and the X-axis represents log fold change of miRNA expression in the sALS versus HC.


