

Abstract
Objective
To assess the safety of probiotic Lactobacillus reuteri strain 17938 (with daily administration to healthy infants with colic and to determine the effect of LR on crying, fussing, inflammatory, immune and microbiome variables.
Study design
We performed a controlled, double-blinded, phase I safety and tolerability trial in healthy breast-fed infants with colic aged 3 weeks to 3 months, randomly assigned to LR (5 × 10⁸ CFUs daily) or placebo for 42 days and followed for 134 days.
Results
Of 117 screened infants, 20 were randomized to LR or placebo (sunflower oil) (in a 2:1 ratio) with 80% retention. Eleven of the 20 (55%) presented with low absolute neutrophil counts (ANC <1500 /mm3), which resolved in all subjects by day 176. LR produced no severe adverse events and did not significantly change crying time, plasma bicarbonate, or inflammatory biomarkers. Fecal calprotectin decreased rapidly in both groups. In the infants with dominant fecal gram negatives (Klebsiella, Proteus, and Veillonella), resolution of colic was associated with marked decreases in these organisms.
Conclusions
Daily LR appears to be safe in newborn infants with colic, including those with neutropenia, which frequently co-exists. A placebo response of 66% suggests that many infants with colic will have resolution within 3 weeks.
Keywords: infant, Barr diary, crying, neutropenia, immunology, microbiome, regulatory T cells
Colic is defined as inexplicable and severe crying in an otherwise healthy newborn. Despite 40 years of research, little is known about its pathogenesis. Colic appears to represent abdominal pain, as manifested by abdominal distension and tenderness. In the original review by Wessel et al,1 colonic hyperperistalsis was emphasized, and the use of enemas was suggested. Of babies with colic, 92% were reported to cry mainly after feedings,2 also consistent with a problem in the gastrointestinal tract. Two meta-analyses have suggested that LR significantly reduces infant crying and fussing time in breast-fed infants with colic.3, 4
An abnormal fecal microbial community in babies with colic was first postulated by Savino et al,5 who showed increased E. coli and reduced Lactobacilli. Our previous study suggested increased Klebsiella and reduced microbial diversity in these infants.6 Therefore, we postulated that children with colic may have an abnormal gut microbiome; the intestine may be inflamed in colicky babies, based on a high fecal calprotectin;6 and LR may reduce gut inflammation associated with this dysbiosis.7–9 During the review of our proposal, the FDA asked if an immunosuppresive effect of LR, potentially produced by increased regulatory T-cells7 could predispose newborn infants to more infections, lactic acidosis, or even lactobacillus bacteremia.
The aim of this study was therefore to demonstrate the safety of a liquid probiotic Lactobacillus reuteri DSM 17938 (LR), given over a 42-day period in infants with colic. In addition, we sought to investigate biomarkers that might give insight into the mechanism of action of LR related to infant colic.
METHODS
This trial was a single center, randomized, double-blind, placebo-controlled trial, ClinicalTrials.gov: NCT01849991. Protocol and amendments were approved by the institutional review board at the University of Texas Health Science Center at Houston (HSC-MS-11-0203) and the Food and Drug Administration (IND: 13561); reviewed by the National Center for Complementary and Integrative Health (NCCIH) (5R34AT006727) and overseen by the Office of Clinical Research Affairs (OCRA).
Screening included parent/guardians signing of the informed consent, a physical examination by 1 of the research clinicians, and a clinical blood draw. Barr diaries10 required for eligibility had to show greater than 2 out of 3 days of 3h daily of crying + fussing (nonconsecutive) at age 21-90 days, with a checked box stating that on the days with >3h/d “this was a typical day.” Subjects were required to have no previous or continuous probiotic use; no history of antibiotic exposure; and to be otherwise healthy and exclusively breast-fed. Five of the children in the study were on acid blockers (4 on lansoprazole, one on ranitidine); they were not disqualified. Clinical and basic science laboratory assessments were conducted at screening, baseline, and follow-up visits (days 21, 42, 92 and 176). Clinical and basic science laboratory blood draws were collected at screening and end of treatment (day 42). Safety laboratory assessments included complete blood count (CBC), comprehensive metabolic panel (CMP, consisting of electrolytes, aspartate and alanine aminotransferases, urea nitrogen, creatinine, calcium, glucose, total protein, and albumin, and C-reactive protein (CRP). Clinical lab results were generally considered abnormal if they were two times the upper limit in the Memorial Hermann Laboratory Directory of Services for aspartate aminotransferase (AST) & alanine aminotransferase (ALT); greater than 20% for CBC and electrolytes; or greater than 30% for glucose or kidney tests based on normal infants.11
At the baseline visit, eligible subjects were randomly assigned to probiotic (LR) or placebo (sunflower oil). Vials of sunflower oil and sunflower oil (placebo) with probiotic looked identical. Dose administration was explained to parents (5 drops once daily for 42 days). Physical examinations and laboratory values were completed at each visit. Stool was also collected for microbiota analysis and fecal calprotectin at baseline (day 1), at the end of treatment (day 42), and during observation period (day 92). Crying and fussing times were graded using the Barr Diary, 2 diaries per week until day 92.2 Case Report forms (CRF) were completed during each clinic visit. Weekly communications were completed through telephone calls or via email. Clinical visits were performed at Memorial Hermann Hospital/UT Health Clinical Research Unit, Houston. Adverse events were strictly monitored based on the FDA Adverse Events Response System (AERs) and a clinical severity index.12
The biostatistician developed a block randomization with block size of 6 for allocation to each group. Randomization was implemented by research pharmacists. To detect potential differences in safety, subjects were randomized using a ratio of 2:1 (treatment to placebo).
The dose of LR was approximately 5×10⁸ CFUs (given as 5 drops) or placebo (sunflower oil) (provided by BioGaia AB, Stockholm, Sweden). All LR vials contained ~5×10⁸ CFUs per day during treatment, documented by anaerobic cultures of every 5th returned vial.
Safety (primary outcome) was defined by strict monitoring of adverse events (AE) and severe adverse events (SAE) throughout the study. A daily diary card was completed by the each study subject’s parent, two days per week until the fifth visit. Secondary outcomes allowed us to estimate the effect sizes of biomarkers for future studies, which included crying and fussing time, immunologic, microbiologic, and hematologic findings.
The independent medical monitor and data safety monitoring board (DSMB) examined progress throughout the trial, convening after enrollment and follow up every 12 subjects. Study data were collected and managed using REDCap (Research Electronic Data Capture). Our data management system allowed logic checks to ensure data quality. All errors or discrepancies were corrected using a web-based query program.
Research lab:
Circulating Treg Cell Assay: Peripheral blood mononuclear cells (PBMCs) were isolated from whole blood and processed by flow cytometry.13 Plasma Inflammatory Biomarker Assays: Plasma levels of IL-1β, IL-2, IL-10, and TNF-α, tissue inhibitor of metalloproteinase-1 (TIMP1) and osteoprotegerin (OPGN) were assessed using human single or multiplex panel kits from Meso Scale Discovery (MSD); plasma TNF-like weak inducer of apoptosis (TWEAK) was assessed by using a human ELISA kit from eBioscience.
Fecal Calprotectin Assay: Stool samples were prepared and analyzed per manufacturer’s instructions by fecal calprotectin ELISA kit (Eagle Biosciences, Nashua, New Elampshire) as described.13
Stool microbial community analysis: Parents were instructed to collect a stool sample within 48 h of the visit; stool samples were subdivided and stored at −80 °C until analyzed. DNA extraction, polymerase chain reaction-amplification (PCR), pyrosequencing and taxonomic identification of 16S rRNA gene sequences in stool specimens were performed as previously described,14 using QIIME15 and the R statistical package R (R version 3.3.1)16 to analyze the microbial communities.
Statistical Analyses
Categorical variables were reported as frequency and percentages and compared with Fisher’s exact test or Chi-square test. Normally distributed variables were summarized by means and standard deviations (SD) and compared with 2 sample t-test, and variables that were not normally distributed were summarized by medians with inter-quartile ranges and compared with Wilcoxon rank sum test. For the primary analysis of adverse events, we compared the percentage of subjects who experienced at least 1 AE between the 2 study arms by the Fisher exact test and estimated the rate ratio and 95% confidence interval (CI) through Poisson regression. For the comparison of Barr diary crying time and fecal calprotectin, logarithmic transformation was applied to normalize distribution, and longitudinal models were used to compare the 2 groups. The adjusted geometric means and 95% CIs by groups were calculated. All the above analyses were conducted using statistical software SAS 9.4 (SAS Institute, Cary, North Carolina R version 3.3.1, ggplot 2.1.0 and gridExtra2.2.1.).16
RESULTS
Of 117 screened infants, 70 were eligible. Consent was obtained from parent/guardians between 8/2013 until 2/2016 of 21 infants, of whom 20 were randomized (Figure 1). During screening of infants, 54 were excluded because of formula feeding or prior probiotic use; 16 others were too old or had other medical conditions that led to exclusion (Figure 1). Forty-three families either refused to participate or withdrew their initial consent, mostly because of blood drawing and the requirement of 5 subsequent visits to clinic. Note that we originally aimed to screen 70 subjects in order to enroll 45 that met eligibility criteria. The proposed sample size (n=45) was based on statistical analysis indicating that 30 treated patients would be enough to detect a significant increase in the number of expected cases of sepsis or fever (more than 2 cases) in children on treatment for 60 days at the P < .01 level. During the study, there were no cases of sepsis and only one developed a fever, after a vaccination.
Figure 1:
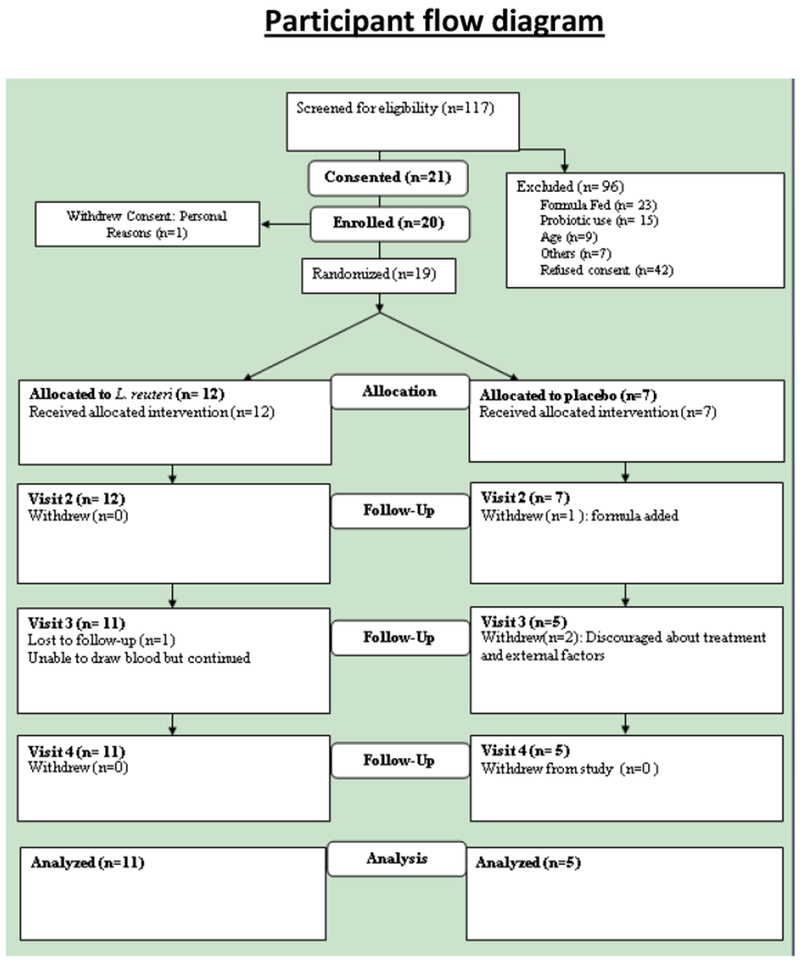
Participant Consort Diagram
In total, 20 infants received study product (Figure 1). Two families were lost to follow-up and 2 families left the study due to personal reasons. At baseline, there were no major differences between the treatment and placebo groups with respect to baseline characteristics including sex, ethnicity, weight, body mass index (BMI), vital signs, white blood cell count (WBC), glucose, blood urea nitrogen (BUN), or CRP, although age and length were higher in the LR group (Tables 2 and 3; available at www.jpeds.com). All infants were healthy with normal growth indices. There were no significant differences in major safety laboratory assessments by 42 days (Table 4; available at www.jpeds.com). There was also no significant difference in crying plus fussing time (Table 1). The number of responders (defined as a 50% reduction in crying plus fussy time) at day 21 was 66% in both groups. At day 42, plasma IL-2 level was significantly lower in the LR-treated group; and Helios-positive (thymus-derived) Tregs were decreased by 10-20%, and total Treg % remained the same in the LR-treated group.
Table 2.
Comparison of baseline characteristics of randomized patients in the two study groups
| Variables | LR (N=13) | Placebo (N=7) | P |
|---|---|---|---|
| Age at the time randomized (in days), median (Q1, Q3) | 57 (39, 72) | 40 (34, 51) | 0.053w |
| Gestational Age (in weeks), mean±SD | 39.3±1.3 | 39.1±1.0 | 0.72t |
| Birth Weight (kg) , mean±SD | 3.4±0.5 | 3.3±0.4 | 0.74t |
| Birth Height (cm) , mean±SD | 52.2±2.0 | 50.3±2.51 | 0.10t |
| Weight at the time randomized (kg) , mean±SD | 5.1±0.8 | 4.8±1.0 | 0.41t |
| Height at the time randomized (cm) , mean±SD | 59.3±2.6 | 55.7±3.7 | 0.02t |
| Male, n (%) | 9 (69%) | 3 (43%) | 0.35f |
| Race, n (%) | NR | ||
| Caucasian | 11 (85%) | 3 (43 %) | |
| African American | 1 (8%) | 0 (0%) | |
| Asian or Pacific Islander | 1 (7%) | 3 (43%) | |
| Mix (Caucasian/Asian) | 0 (0.0%) | 1 (14%) | |
| Ethnicity, n (%) | 0.27f | ||
| Not Hispanic or Latino | 12 (92%) | 5 (71%) | |
| Hispanic or Latino | 1 (8%) | 2 (29%) | |
| Breast Feed, n (%) | N/A | ||
| Yes | 13(100 %) | 7 (100%) | |
| Any Formula, n (%) | 1.00f | ||
| No | 10 (77%) | 5 (71%) | |
| Yes | 3 (23%) | 2 (29%) | |
| Formula Type | |||
| -Earth’s Best | 1 (33%) | 0 (0%) | |
| -Gentls Good Start | 1 (33%) | 0 (0%) | |
| -Similac Advance | 1 (33%) | 1 (50%) | |
| -Similace Sensitive | 0 (0%) | 1 (50%) | |
N=5
denotes p-values obtained by two sample t-test
denotes p-values obtained by Fisher’s exact test
denotes p-values obtained by Wilcoxon rank sum test; NR, not reported due to zero cells; N/A, not applicable; Abbreviations: Q1, 1st quartile; Q3, 3rd quartile; SD, standard deviation
Table 3.
Comparison Of Clinical Parameters By Treatment Group At Baseline Visit And Day 42
| Parameters (Normal Range for Age) | Baseline- Pre Treatment (Mean + SD) | Day 42 - Post Treatment (Mean + SD) | ||||
|---|---|---|---|---|---|---|
| LR (n=13) | Placebo (n=7) | P value | LR (n=10) | Placebo (n=5) | P value | |
| HGB | 11.6±1.5 | 11.7±1.2 | 0.92t | 11.4±1.0 | 11.0±0.7 | 0.42t |
| HCT | 34.0±5.0 | 34.5±4.2 | 0.83t | 33.6±3.4 | 31.8±2.0 | 0.30t |
| WBC | 8.1±1.8 | 10.4±2.9 | 0.03t | 9.7±2.5 | 10.6±2.5 | 0.47t |
| ANC | 1.4±0.5 | 2.4±1.4 | 0.10t | 2.5±1.8 | 1.7±0.7 | 0.35t |
| LYMPHOCYTES (%) | 68.4±9.7 | 66.5±11.6 | 0.69t | 66.6±14.3 | 76.6±9.4 | 0.18t |
| EOSINOPHILS (%) | 5.5±3.4 | 4.1±1.6 | 0.30t | 3.3±1.5 | 3.2±2.2 | 0.96t |
| PLATELETS | 421.2±154.5 | 392.1±117.1 | 0.66t | 439.2±120.3 | 481.8±129.9 | 0.53t |
| CRP | 2.4±1.1 | 2.1±1.3 | 0.63t | 2.3±1.8 | 2.9±0.0 | 0.36t |
| SGOT | 41.1±15.1 | 43.0±22.6 | 0.82t | 44.2±13.9 | 40.8±11.7 | 0.64t |
| SGPT | 43.6±14.5 | 39.4±13.5 | 0.53t | 44.1±15.1 | 44.2±12.9 | 0.99t |
| BILIRUBIN | 2.4±3.2 | 3.6±3.9 | 0.45t | 0.7±1.0 | 0.5±0.3 | 0.64t |
| BLOOD UREA NITROGEN | 5.2±1.4 | 6.7±2.7 | 0.10t | 5.8±2.9 | 5.8±1.9 | 1.00t |
| CREATININE | 0.3±0.1 | 0.2±0.1 | 0.53t | 0.2±0.1 | 0.3±0.1 | 0.56t |
| BICARBONATE | 22.5±2.2 | 22.1±3.4 | 0.80t | 24.8±5.8 | 22.2±0.8 | 0.19t |
denotes p-values obtained by two sample t-test
Table 4.
Comparison Of Immune Markers Data By Treatment Group At Baseline Visit And Day 42
| Baseline - Pre Treatment (median (Q1, Q3)) | Day 42 - Post Treatment (median (Q1, Q3)) | |||||
|---|---|---|---|---|---|---|
| LR (n=13) | Placebo (n=6) | P value | LR (n=11) | Placebo (n=5) | P value | |
| IL-1β | 0.1 (0.0, 0.1) | 0.0 (0.0, 0.0) | 0.34w | 0.0 (0.0, 0.1) | 0.0 (0.0, 0.0) | 0.14w |
| TNF-α | 3.5 (3.1, 3.9) | 3.5 (3.4, 4.3) | 0.79w | 4.1 (3.0, 4.8) | 3.8 (3.3, 4.9) | 0.95w |
| IL-10 | 0.7 (0.6, 0.9) | 0.6 (0.6, 0.7) | 0.66w | 0.6 (0.4, 1.2) | 0.8 (0.5, 0.9) | 0.78w |
| IL-2 | 0.2 (0.2, 0.4) | 0.3 (0.2, 0.3) | 0.44w | 0.1 (0.1, 0.2) | 0.2 (0.2, 0.2) | 0.05w |
| OPG | 355.6 (312.3, 388.1) | 367.2 (200.8, 441.0) | 0.76w | 359.5 (308.0, 456.0) | 394.2 (336.6, 476.0) | 0.69w |
| TIMP-1 | 135699.8 (124171.9,146316.9) | 152836.2 (116720.4,168662.1) | 0.79w | 126898.2 (98393.5,219956.6) | 148937.0 (129529.2,153964.6) | 0.69w |
| TWEAK | 363.4 (341.3, 441.0) | 425.3 (324.8, 447.8) | 0.63w | 384.5 (309.5, 524.2) | 476.0 (394.2, 477.4) | 0.86w |
| CD4+Foxp3+ within CD4+ | 7.2 (6.5, 7.8) | 6.2 (4.7, 7.2) | 0.39w | 6.6 (4.4, 7.8) | 7.1 (6.1, 10.6) | 0.25w |
| CD4+Foxp3+CD25 + within CD4+Foxp3+ | 70.0 (68.0, 73.5) | 68.0 (58.3, 84.2) | 0.72w | 56.8 (43.9, 74.0) | 77.5 (76.5, 78.0) | 0.01w |
| CD4+Foxp3+HELIOS+ within CD4+Foxp3+ | 87.7 (86.4, 89.2) | 82.9 (76.7, 88.4) | 0.19w | 82.4 (66.1, 87.2) | 90.2 (88.8, 91.0) | 0.04w |
denotes p-values obtained by Wilcoxon rank sum test
Table 1:
Summary statistics of baseline Barr diary and Fecal Calprotectin by treatment group. The adjusted geometric means and 95% confidence interval of Barr diary data and FC data at follow-up visits are shown after controlling for age and each individual baseline values. *
| Barry diary Visit 2 (Baseline) | Median (interquartile range) | ||||
|---|---|---|---|---|---|
| L. reuteri N=13 | Placebo N=7 | p value | |||
| Crying+fussing time (mins) | 275 (267, 368) | 283.5 (255, 612) | 0.66 | ||
| Crying time (mins) | 109.5 (70, 185) | 96.0 (38, 140) | 0.43 | ||
| Fussing time (mins) | 170.0 (147, 217) | 231.0 (187, 502) | 0.09 | ||
| Barr Diary Follow-up visits | Adjusted means (95% Confidence Intervals) | ||||
| L. reuteri | Placebo | p value | |||
| Crying+fussing time (mins) | |||||
| Visit 3 (Day 21) | 99 (42, 234) | 164 (110, 246) | 0.31 | ||
| Visit 4 (Day 42) | 94 (61, 144) | 29 (5, 162) | 0.19 | ||
| Visit 5 (Day 92) | 36 (17, 78) | 35 (14, 88) | 0.96 | ||
| Crying time (mins) | |||||
| Visit 3 (Day 21) | 19 (6, 56) | 17 (3, 81) | 0.92 | ||
| Visit 4 (Day 42) | 14 (5, 34) | 11 (2, 52) | 0.86 | ||
| Visit 5 (Day 92) | 3 (1, 7) | 5 (1, 22) | 0.55 | ||
| Fussing time (mins) | |||||
| Visit 3 (Day 21) | 68 (28, 164) | 111 (70, 177) | 0.38 | ||
| Visit 4 (Day 42) | 58 (34, 100) | 20 (5, 76) | 0.15 | ||
| Visit 5 (Day 92) | 31 (14, 72) | 22 (10, 49) | 0.56 | ||
| Fecal calprotectin (μg/g) | Median (interquartile range) | ||||
| Visit 1 (Baseline) | 216 (132, 266) | 148 (82, 192) | 0.19 | ||
| Follow-up visits | Adjusted means (95% Confidence Intervals) | ||||
| Visit 4 (Day 42) | 140 (78, 251) | 103 (62, 172) | 0.50 | ||
| Visit 5 (Day 92) | 75 (48, 118) | 94 (58, 150) | 0.57 | ||
p-values for baseline data are obtained by Wilcoxon rank sum test. For follow-up visits, longitudinal models were used as follows. Longitudinal model: (1). In(barr diary)=β0+ β1*visit3 + β2*group+ β3*visit3*group + β4*visit4 + β5*group+ β6*visit4*group + β7*(Age at baseline) + β8*(barr diary at baseline); Here, visit3and visit4 are dummy variables; visit3=1 if at visit 3, 0 otherwise; visit4=1 if at visit 4, 0 otherwise; group=1 if in LR group, 0 otherwise; (2). In(fecal calprotectin)=β0+ β1*visit4 + β2*group+ β3*visit4*group + β4*(Age at baseline) + β5*(fecal calprotectin at baseline); Here, visit4 is dummy variable; visit4=1 if at visit 4, 0 otherwise; group=1 if in LR group, 0 otherwise.
We assessed safety by comparing the number of adverse events in the 2 arms. Sixteen infants had treatment-unrelated adverse events, which included thrush, diaper rash, vomiting, diarrhea, dermoid cyst, neutropenia (see below), coryza, upper respiratory infection, and cradle cap. Five (71%) patients in the placebo group experienced at least 1 AE, and 10 (77%) patients in LR group experienced at least 1 AE (p=1.00). The average number of AEs in LR group and placebo were 2.7 and 1.6, respectively; and the rate ratio (RR) of experiencing AE in LR group compared with the placebo group was not significantly different, RR=1.71 (95% CI: 0.63, 4.67, p=0.292)
At baseline, of the 20 infants that we randomized, 11 (55%) had neutropenia (absolute neutrophil count [ANC] <1500/mm3) (Figure 2). Most sources define mild neutropenia as counts ranging from 1000-1500.17, 18 Seven of the 14 infants with laboratory assessments, specifically complete blood counts at both the beginning and the end of treatment, had neutropenia during the study (Figure 2). In the 13 infants who were to receive LR, the mean ± SD was 1,400 ± 500/mm3, and the mean ± SD in the 7 infants to receive placebo was 1,700 ± 700/mm3. In contrast, the mean ± SD for one-month old infants has been reported to be much higher (3,800/mm3, with a range of 1,000-9,800/mm3). 17, 18 Because neutropenia is associated with increased risk of infection, when some infants were noted at study completion to have neutropenia, our DSMB conferred with NCCIH and the FDA and called an interim investigator-blinded safety analysis. It was ruled that LR treatment was not associated with neutropenia. We also found that in 7 of the 10 infants who received LR (and who had 2 blood draws), the ANC increased during treatment, whereas an increase in neutrophil count occurred in only 1 of 4 on placebo (P=0.065). Crying + fussing time declined in both groups during treatment, as shown in Table 1, with no significant differences. Secondary analysis was showed no correlation between crying plus fussing time and ANC (p = 0.38).
Figure 2:

Absolute neutrophil count (ANC) from baseline to 42 days in the participants receiving LR or placebo (P). Dotted line indicates ANC = 1,500, traditionally representing higher risk of infection in pediatric patients.
Baseline value of FC was high in both groups, consistent with mild gastrointestinal inflammation.6, 19, 20 During the course of the study, FC decreased (Table 1). When we controlled for age and used log transformation, the geometric mean of the comparison of FC at visit 4 versus baseline in LR group was 142.9 (95% C: 81.5-250.3) and the geometric mean of the comparison FC at visit 5 vs baseline in the control group was 77.2 (95% C: 51.1-116.6). For comparison, we and others have found that mean normal levels in adults are <50 μg/g.13, 21 Because all children in the current study were on breast milk throughout the study, we examined levels of calprotectin in breast milk. FC in breast milk was 1,475±170.8 ng/ml, or 1.5±0.17 μg/g, n=3, which was much lower than that seen in feces (Table 1).
Fecal alpha-diversity, as assessed by the Shannon, Chao1, or Simpson diversity indices, showed no significant difference between the LR-treated and placebo groups at days 1, 42 or 90. The stool specimens of all infants were dominated by a few (1 to 3) highly abundant species. These dominant species accounted for most (65-87%) of the operational taxonomic units (OTUs, or species) in the specimens. In fact, at baseline, the stools of 8 of 10 infants with colic at day 1 and day 42 had a single dominant species that accounted for >60% of the total species.
There were 8 LR-treated infants with stools from the pre-treatment and end-of-treatment visits with adequate stool DNA, and for those in the placebo group there were 4 complete sets (Visit 1, 3, and 4). Major OTU’s at the family level (accounting for > 60% of the total) are shown in Table 5 (available at www.jpeds.com). Of the 8 infants in the LR group, 4 were dominated by members of the family Gammaproteobacteria (Escherichia in 3 and Klebsiella in 1); other dominant species included Clostridia (n=2), Bacteroides (n=1), and Veillonella n=1) (Figure 3). Of the 4 infants in the placebo group, the dominant family was Bacteroides in 3 and Prevotella in 1 (Figure 3). Thus, the infants in the 2 groups were not directly comparable with respect to community structure at entry.
Table 5.
Major Operational Taxonomic Units (OTUs) at enrollment and changes following 42 days of treatment with LR or placebo.
| Subject | Major OTU (%) | 2nd Major OTU (%) | 3rd Major OTU (%) |
|---|---|---|---|
| L1 | E. coli (39→34%) | Staphylococcus (21→0%) | Proteus (17→4%) |
| L2 | Bacteroides (65→30%) | E. coli (25→22%) | Oscillospira (4→11%) |
| L3 | Klebsiella (62→2%) | Hemophilus (27→1%) | E. coli (6→57%) |
| L4 | Lachnospiraceae (33→21%) | E. coli (23→12%) | Roseburia (9→2%) |
| L5 | Bacteroides (63→2%) | B. bifidum (21→33%) | E. coli (12→47%) |
| L6 | Veillonella (58→45%) | E. coli (31→45%) | Clostridium (9→2%) |
| L7 | E. coli (81→0%) | Clostridium (19→0%) | B. bifidum (15→29%) |
| L8 | Clostridium (35→3%) | E. coli (21→42%) | Veillonella (19→0) |
| P1 | Prevotella (78→40%) | Ruminococcus (8→1%) | Bacteroides (7→20%) |
| P2 | Bacteroides (62→95%) | Parabacteroides (17→1%) | Ruminococcus (10→2%) |
| P3 | Bacteroides (84→72%) | E. coli (16→12%) | None other (all<1%) |
| P4 | Bacteroides (87→56%) | Ruminococcus (5→1%) | None other (all<1%) |
Arrow reflects the changes in the relative abundance from the beginning to the end of study. Only results for infants who had fecal samples available at baseline and day 42 are shown.
Figure 3:

Changes in relative abundance of prominent genera over time in infants treated (blue) and infants give a placebo (orange). Each thin line represents a single infant. The mean for treated and placebo infants is represented by bold lines of the corresponding color. Only infants that had baseline (BL) and 4th visit (V4) specimens are represented in the graph.
During treatment, there were dramatic shifts in the percentage contributions of these organisms, without a major change in richness (alpha-diversity) in either group (Figure 3). In the LR group, we saw a major change (shift in percentage 5-60%) of the major taxa in all patients.
Escherichia was the most consistently identified family in all infants participating in the study and was found in both study groups (Figure 3). At visit 4, when the colic had resolved, Escherichia percentage increased in 5 of 6 infants. A second family that is known to be an early colonizer of human infants, Bacteroides, was found to be prevalent in our population; its percentage abundance in stool also increased as the crying time decreased.
LR did not change any of the biomarkers of inflammation in plasma that we measured (Table 4). LR did not change the total percentage of circulating Tregs, as measured by Foxp3 and CD25 positivity, but did reduce the number of thymus-derived (Helios+) Tregs (Table 4), suggesting that there was a coordinate increase in peripheral inducible Tregs to balance the difference.
DISCUSSION
In this pilot randomized clinical trial, we found no significant changes in important safety and immune markers in infants with colic treated with probiotics. A strength of this study was the very careful follow-up of population of breast-fed infants with colic. The current study was designed with scrutiny by FDA and the NIH/NCCIH, due to previous reports of Lactobacillus bacteremia, meningitis, endocarditis, and D-lactic acidosis, mostly in adults.22, 23 Furthermore, newborn infants are considered a vulnerable population. In 2014, a fatal case of gastrointestinal (GI) mucormycosis caused by Rhizopus oryzae was reported in a premature infant. The infant had been given a probiotic to prevent necrotizing enterocolitis, but testing of the same lot of unopened probiotic powder revealed contamination with Rhizopus oryzae.24
None of the 20 studies in the meta-analysis of probiotics used to prevent necrotizing enterocolitis by Wang et al25 and none of the LR colic trials in the systematic reviews by Xu et al26 or by Harb et al4 were conducted in the US, most likely because of the requirement for US Food and Drug Administration approval. Our study demonstrated that in a small but carefully-selected sample of healthy newborns, with 42 days of daily LR treatment, there was no increase in the rate of infection, lactic acidosis, gastrointestinal symptoms, or other adverse events. However, findings of safety in such a small sample size cannot be overstated.
An unexpected finding encountered in more than half of the infants was neutropenia, an abnormality associated with increased risk of infection. Mild neutropenia has been generally defined as an ANC < 1500/mm3in children.18 At baseline, 8 infants had peripheral blood neutropenia, 6 LR-treated and 2 placebo-treated, a finding that improved in the LR treated group with time, whereas in the placebo group we found that 3 of 4 cases (who had blood samples available at study beginning and completion) had either no change or a decrease in ANC. Due to small numbers and this being a safety trial, we cannot make definitive statements about the correlation between colic and a low neutrophil count. However, our studies lead to two considerations that the “old literature” normal range of neutrophil counts for infants in the 2-6 month-old age range should be lower, or that colic may be a condition associated with neutropenia. One hypothesis consistent with our data is that in the infant with colic, mild intestinal inflammation could lead to neutrophil emigration into the gut lumen, resulting in an elevated fecal calprotectin (which constitutes 60% of neutrophil cytosolic protein). The blood neutrophil count is replenished by production, with release of neutrophils from the bone marrow. More than 90% of mature neutrophils are in the bone marrow. However, during early post-natal life, it is not unusual for infections to cause neutropenia, especially viral infections. We do not believe any of our patients had neonatal alloimmune neutropenia or congenital neutropenias.27
Our working hypothesis is that gut inflammation may be related to colic.6 The current results are consistent with this hypothesis. At enrollment, ~50% of the infants presented with platelet counts > 450,000, a condition not unusual at this age but generally felt to be suggestive of mild inflammation.28 Furthermore, fecal calprotectin was elevated at enrollment and diminished over the course of the study in both groups of infants. Calprotectin is viewed as an innate antimicrobial peptide.29 We chose to monitor this marker because levels of the often-used alternative biomarker, lactoferrin, are elevated in children on breast milk. Konikoff and Denson reviewed previously the finding that calprotectin is up to 10-fold higher in infants than in adults.21 However, calprotectin may not be an optimal marker for measuring gut inflammation in breast-fed infants, because its level is reported to be increased in children on breast milk.19, 20 Our study has ruled out that the level of calprotectin in breast milk was high enough to explain the increased level in stool.
Although the gut may be inflamed, we did not find evidence of systemic inflammation in these babies, based on a group of cytokines which we assessed in serum, nor did we find evidence in a previous study of colic that used a different panel.30 Recently, several chemokines were reported to be abnormal in infants with colic by Partty et al.31 These included interleukin-8 (generally felt to be a chemokine), monocyte chemotactic peptide-1 (MCP-1), and macrophage inhibitory protein-1-beta (MIP-1β). Our cytokine levels are similar to those they reported; but we did not measure chemokines. Of note, their study also did not find alterations in cytokines or intestinal fatty acid-binding protein (I-FABP), a peptide released by damaged enterocytes. No group to date has performed endoscopy or colonoscopy on infants with colic to directly address the question of inflammation.
We found that LR treatment did not change the % of Foxp3+Tregs in peripheral blood compared to placebo, but the percentages of CD25+ and Fielios+ populations among Foxp3+Tregs were both lower in LR-groups compared to placebo group at Day 42. In human CD4+ cells, the level of Flelios expression is positively associated with CD25 expression.32 Flelios expression in human and murine Tregs discriminates thymic-derived nTregs (Helios+) from inducible Tregs (Helios−, iTregs).32, 33 Our results, therefore, indicate that inducible Tregs in the gut may be “shaped by probiotic.”
Previously, Moore et al found evidence of elevated breath hydrogen, suggesting an abnormal population of colonic microorganisms, in their children with colic.34 In a previous report we found Klebsiella in 8 of 17 infants with colic compared to 1 of 18 without colic6 We are aware of several previous studies of the fecal microbial composition of infants with colic from other centers. Savino’s group showed that there were decreased lactobacilli and increased anaerobic gram negative organisms in the stools of infants with colic35, and later found L. brevis and L. lactis were present only in colicky infants and L. acidophilus was found only in healthy infants.36 However, Roos et al37 and Sung et al38 did not find changes in fecal microbiota or Escherichia numbers, respectively. In the current study, definitive effects of LR on alpha- or beta-diversity or relative composition of the different species could not be addressed because of a poorly diverse microbial population, small numbers of observations, and differential community composition at the time of randomization, similar to Roos et al.37
Our study differed from some previously published LR trials in that we found 66% of infants in the placebo group had resolution of their colic by 3 weeks. In the previous trials, the placebo response at 3w was low (5%-38%) in 3 studies,3, 39, 40 but was similar to ours (48%-71%) in the studies of Sung et al38 and Savino et al.41
Our study suggests safety and tolerability of probiotic Lactobacillus reuteri DSM 17938 in infants with colic. We frequently found laboratory abnormalities in these infants, such as neutropenia, thrombocytosis, and elevated fecal calprotectin, possibly consistent with mild gut inflammation. Future research will be needed to prove the concepts of dysbiosis, gut inflammation, and probiotic efficacy in infants with this condition.
ACKNOWLEDGEMENTS
We acknowledge our participants, both the infants and their parents, for their multiple visits and dedication to the study. We appreciate the support and scientific contributions to the project of our Data Safety Committee and Independent Medical Monitors, Drs. H. Dupont, G. Heresi, and S. Hashmi. We thank Memorial Hermann Hospital/U.T. Health Clinical Research Unit, Houston, and research staff for all their efforts during this study. The University of Texas Health Science Center at Houston, McGovern Medical School pediatric clinics, faculty and staff played an essential role in identifying subjects. We also thank Drs. Robert Yetman and Johnnie Frazier of the University of Texas Pediatric Clinic, Alisa Sanders of the University of Texas Health Science Center Lactation Clinic, the Lactation Foundation, and Dr. Helene Sheena of the Kelsey Seybold Clinic for help in recruitment. Finally, we thank the University of Texas Health Science Center at Houston pediatric phlebotomy facilities, especially Shantel Beasley, for the dedication to the project and Meredith Rayne and Deborah Lake of the McGovern Medical School Media Relations Team for publicizing the investigation.
Supported by the National Institutes of Health/National Center for Complementary and Integrative Health (R34 AT006727), the National Center for Advancing Translational Sciences (NCATS): UL1 TR000371& UL1 TR000445 (Redcap – Vanderbilt University), Public Health, Service (P30DK56338), which funds the Texas Medical Center Digestive Diseases Center. The authors declare no conflicts of interest.
Footnotes
Publisher's Disclaimer: This is a PDF file of an unedited manuscript that has been accepted for publication. As a service to our customers we are providing this early version of the manuscript. The manuscript will undergo copyediting, typesetting, and review of the resulting proof before it is published in its final citable form. Please note that during the production process errors may be discovered which could affect the content, and all legal disclaimers that apply to the journal pertain.
Trial registration ClinicalTrials.gov: NCT01849991
References
- (1).WESSEL MA, COBB JC, JACKSON EB, HARRIS GS Jr., DETWILER AC. Paroxysmal fussing in infancy, sometimes called colic. Pediatrics 1954;14(5):421–35. [PubMed] [Google Scholar]
- (2).Barr RG, Rotman A, Yaremko J, Leduc D, Francoeur TE. The crying of infants with colic: a controlled empirical description. Pediatrics 1992;90(1 Pt 1):14–21. [PubMed] [Google Scholar]
- (3).Chau K, Lau E, Greenberg S, Jacobson S, Yazdani-Brojeni P, Verma N, et al. Probiotics for infantile colic: a randomized, double-blind, placebo-controlled trial investigating Lactobacillus reuteri DSM 17938. J Pediatr 2015;166(1):74–8. [DOI] [PubMed] [Google Scholar]
- (4).Harb T, Matsuyama M, David M, Hill RJ. Infant Colic-What works: A Systematic Review of Interventions for Breast-fed Infants. J Pediatr Gastroenterol Nutr 2016;62(5):668–86. [DOI] [PubMed] [Google Scholar]
- (5).Savino F, Cordisco L, Tarasco V, Calabrese R, Palumeri E, Matteuzzi D. Molecular identification of coliform bacteria from colicky breastfed infants. Acta Paediatr 2009;98(10):1582–8. [DOI] [PubMed] [Google Scholar]
- (6).Rhoads JM, Fatheree NY, Norori J, Liu Y, Lucke JF, Tyson JE, et al. Altered fecal microflora and increased fecal calprotectin in infants with colic. J Pediatr 2009;155(6):823–8. [DOI] [PubMed] [Google Scholar]
- (7).Liu Y, Fatheree NY, Dingle BM, Tran DQ, Rhoads M. Lactobacillus reuteri DSM 17938 changes the frequency of Foxp3+ regulatory T cells in the intestine and mesenteric lymph node in experimental necrotizing enterocolitis. PLoS ONE 2013;8 (2):e56547. [DOI] [PMC free article] [PubMed] [Google Scholar]
- (8).Liu Y, Fatheree NY, Mangalat N, Rhoads JM. Human-derived probiotic Lactobacillus reuteri strains differentially reduce intestinal inflammation. Am J Physiol Gastrointest Liver Physiol 2010;299(5):G1087–G1096. [DOI] [PMC free article] [PubMed] [Google Scholar]
- (9).Liu Y, Tran DQ, Fatheree NY, Marc RJ. Lactobacillus reuteri DSM 17938 differentially modulates effector memory T cells and Foxp3+ regulatory T cells in a mouse model of necrotizing enterocolitis. Am J Physiol Gastrointest Liver Physiol 2014;307(2):G177–G186. [DOI] [PMC free article] [PubMed] [Google Scholar]
- (10).Barr RG, Kramer MS, Boisjoly C, McVey-White L, Pless IB. Parental diary of infant cry and fuss behaviour. Arch Dis Child 1988;63(4):380–7. [DOI] [PMC free article] [PubMed] [Google Scholar]
- (11).Physician LINK. Memorial Hermann Laboratory Directory of Services. Available from: http://www.newphysicianlink.org/ClinicalReference/LabTest/LabTestIndex.asp 2016.
- (12).U.S. Department of Health and Human Services, National Institutes of Health, National Institute of Allergy and Infectious Diseases, division of AIDS. Division of AIDS (DAIDS) Table for Grading the Severity of Adult and Pediatric Adverse Events, Version 2.0. [Novermber 2014]. Available from: http://rsc.tech-res.com/docs/default-source/safety/daids_ae_grading_table_v2_nov2014.pdf 2014.
- (13).Mangalat N, Liu Y, Fatheree NY, Ferris MJ, Van Arsdall MR, Chen Z, et al. Safety and tolerability of Lactobacillus reuteri DSM 17938 and effects on biomarkers in healthy adults: results from a randomized masked trial. PLoS ONE 2012;7(9):e43910. [DOI] [PMC free article] [PubMed] [Google Scholar]
- (14).Gupta RW, Tran L, Norori J, Ferris MJ, Eren AM, Taylor CM, et al. Histamine-2 receptor blockers alter the fecal microbiota in premature infants. J Pediatr Gastroenterol Nutr 2013;56(4):397–400. [DOI] [PubMed] [Google Scholar]
- (15).Caporaso JG, Kuczynski J, Stombaugh J, Bittinger K, Bushman FD, Costello EK, et al. QIIME allows analysis of high-throughput community sequencing data. Nat Methods 2010;7(5):335–6. [DOI] [PMC free article] [PubMed] [Google Scholar]
- (16).The R Foundation. The R Project for Statistical Computing. Available from: http://www.r-project.org/ 2016.
- (17).Ozyurek E, Cetintas S, Ceylan T, Ogus E, Haberal A, Gurakan B, et al. Complete blood count parameters for healthy, small-for-gestational-age, full-term newborns. Clin Lab Haematol 2006;28(2):97–104. [DOI] [PubMed] [Google Scholar]
- (18).Segel GB, Halterman JS. Neutropenia in pediatric practice. Pediatr Rev 2008;29(1):12–23. [DOI] [PubMed] [Google Scholar]
- (19).Li F, Ma J, Geng S, Wang J, Ren F, Sheng X. Comparison of the different kinds of feeding on the level of fecal calprotectin. Early Hum Dev 2014;90(9):471–5. [DOI] [PubMed] [Google Scholar]
- (20).Savino F, Castagno E, Calabrese R, Viola S, Oggero R, Miniero R. High faecal calprotectin levels in healthy, exclusively breast-fed infants. Neonatology 2010;97(4):299–304. [DOI] [PubMed] [Google Scholar]
- (21).Konikoff MR, Denson LA. Role of fecal calprotectin as a biomarker of intestinal inflammation in inflammatory bowel disease. Inflamm Bowel Dis 2006;12(6):524–34. [DOI] [PubMed] [Google Scholar]
- (22).Boyle RJ, Robins-Browne RM, Tang ML. Probiotic use in clinical practice: what are the risks? Am J Clin Nutr 2006;83(6):1256–64. [DOI] [PubMed] [Google Scholar]
- (23).Hammerman C, Bin-Nun A, Kaplan M. Safety of probiotics: comparison of two popular strains. BMJ 2006;333(7576):1006–8. [DOI] [PMC free article] [PubMed] [Google Scholar]
- (24).Ceners for Disease Control and Prevention.Emergency Preparedness and Response. Fatal Gastrointestinal Mucormycosis in an Infant Following Ingestion of Contaminated Dietary Supplement-Connecticut, 2014. Available from: https://emergency.cdc.gov/HAN/han00373.asp 2014.
- (25).Wang Q, Dong J, Zhu Y. Probiotic supplement reduces risk of necrotizing enterocolitis and mortality in preterm very low-birth-weight infants: an updated meta-analysis of 20 randomized, controlled trials. J Pediatr Surg 2012;47(1):241–8. [DOI] [PubMed] [Google Scholar]
- (26).Xu M, Wang J, Wang N, Sun F, Wang L, Liu XH. The Efficacy and Safety of the Probiotic Bacterium Lactobacillus reuteri DSM 17938 for Infantile Colic: A Meta-Analysis of Randomized Controlled Trials. PLoS ONE 2015;10(10):e0141445. [DOI] [PMC free article] [PubMed] [Google Scholar]
- (27).Dale DC. How I manage children with neutropenia. Br J Haematol 2017;April 17:Doi: 10.111/bjh.14677. [DOI] [PubMed] [Google Scholar]
- (28).Chiarello P, Magnolia M, Rubino M, Liguori SA, Miniero R. Thrombocytosis in children. Minerva Pediatr 2011;63(6):507–13. [PubMed] [Google Scholar]
- (29).Siddiqui I, Majid H, Abid S. Update on clinical and research application of fecal biomarkers for gastrointestinal diseases. World J Gastrointest Pharmacol Ther 2017;8(1):39–46. [DOI] [PMC free article] [PubMed] [Google Scholar]
- (30).Fatheree NY, Liu Y, Ferris M, Van AM, McMurtry V, Zozaya M, et al. Hypoallergenic formula with Lactobacillus rhamnosus GG for babies with colic: A pilot study of recruitment, retention, and fecal biomarkers. World J Gastrointest Pathophysiol 2016;7(1):160–70. [DOI] [PMC free article] [PubMed] [Google Scholar]
- (31).Partty A, Kalliomaki M, Salminen S, Isolauri E. Infantile Colic is Associated with Low-grade Systemic Inflammation. J Pediatr Gastroenterol Nutr 2016. [DOI] [PubMed] [Google Scholar]
- (32).Akimova T, Beier UH, Wang L, Levine MH, Hancock WW. Helios expression is a marker of T cell activation and proliferation. PLoS ONE 2011;6(8):e24226. [DOI] [PMC free article] [PubMed] [Google Scholar]
- (33).Thornton AM, Korty PE, Tran DQ, Wohlfert EA, Murray PE, Belkaid Y, et al. Expression of Helios, an Ikaros transcription factor family member, differentiates thymic-derived from peripherally induced Foxp3+ T regulatory cells. J Immunol 2010;184(7):3433–41. [DOI] [PMC free article] [PubMed] [Google Scholar]
- (34).Moore DJ, Robb TA, Davidson GP. Breath hydrogen response to milk containing lactose in colicky and noncolicky infants. J Pediatr 1988;113(6):979–84. [DOI] [PubMed] [Google Scholar]
- (35).Savino F, Cresi F, Pautasso S, Palumeri E, Tullio V, Roana J, et al. Intestinal microflora in breastfed colicky and non-colicky infants. Acta Paediatr 2004;93(6):825–9. [PubMed] [Google Scholar]
- (36).Savino F, Bailo E, Oggero R, Tullio V, Roana J, Carlone N, et al. Bacterial counts of intestinal Lactobacillus species in infants with colic. Pediatr Allergy Immunol 2005;16(1):72–5. [DOI] [PubMed] [Google Scholar]
- (37).Roos S, Dicksved J, Tarasco V, Locatelli E, Ricceri F, Grandin U, et al. 454 pyrosequencing analysis on faecal samples from a randomized DBPC trial of colicky infants treated with Lactobacillus reuteri DSM 17938. PLoS ONE 2013;8(2):e56710. [DOI] [PMC free article] [PubMed] [Google Scholar]
- (38).Sung V, Hiscock H, Tang ML, Mensah FK, Nation ML, Satzke C, et al. Treating infant colic with the probiotic Lactobacillus reuteri: double blind, placebo controlled randomised trial. BMJ 2014;348:g2107. [DOI] [PMC free article] [PubMed] [Google Scholar]
- (39).Mi GL, Zhao L, Qiao DD, Kang WQ, Tang MQ, Xu JK. Effectiveness of Lactobacillus reuteri in infantile colic and colicky induced maternal depression: a prospective single blind randomized trial. Antonie Van Leeuwenhoek 2015;107(6):1547–53. [DOI] [PubMed] [Google Scholar]
- (40).Szajewska H, Gyrczuk E, Horvath A. Lactobacillus reuteri DSM 17938 for the Management of Infantile Colic in Breastfed Infants: A Randomized, Double-Blind, Placebo-Controlled Trial. J Pediatr 2013;162(2):257–62. [DOI] [PubMed] [Google Scholar]
- (41).Savino F, Cordisco L, Tarasco V, Palumeri E, Calabrese R, Oggero R, et al. Lactobacillus reuteri DSM 17938 in infantile colic: a randomized, double-blind, placebo-controlled trial. Pediatrics 2010;126(3):e526–e533. [DOI] [PubMed] [Google Scholar]